ROSE sign a bullish reversal trendThe ROSE has been trading on the bearish channel that i think it can be a reversal channel and i expect we will start huge bullish move in the coming week and then it can up to around 0.087 or even higher.
However the BTC must hold $20700 level.
ROSEUSDT

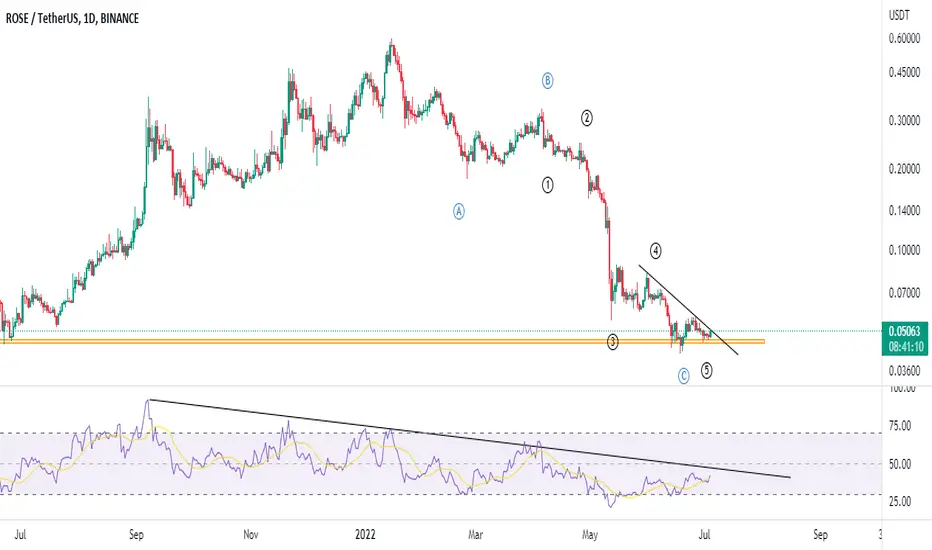
ROSE/USDT with a chance of +200% GainConsidering the market conditions and the situation in which the ROSE symbol is located, a short-term upward trend can be expected from it with a +200% Gain in the near future.
In the larger view, this symbol completes an ABC harmonic pattern, which in wave C is a 5-wave trend coming to an end. With the break of the trend line and the confirmation of the break of the RSI trend line, you can enter a buy position for higher goals by observing the capital management and limit.
ROSEUSDT | BREAKOUT !!ROSEUSDT has given a breakout from the falling trendline. It has been retested and showing strong upward momentum.
We are expecting an increase of 10 to 20% from here.
Trade your levels accordingly.

ROSE - Free rise is comingReasons to take long:
⭐️ BTC is bullish
⭐️ False breakout
⭐️ Accumulation 5 days
⭐️ Price is squeezing to the level
⭐️ 4th touch of the level
⭐️ Empty space ahead
⭐️ 40 ATR
⭐️ Over VWAP
Will enter when price squeezes to the level on 5m timeframe, the base will form and the tape will get faster.
If you don't understand the previous sentence, just use swing stop-loss 3-5%
Fix profit by parts:
1% - 1/3
2% - 1/3, stoploss to breakeven
What's left, hold to the maximum
What do you think of this idea? What is your opinion? Share it in the comments📄🖌
If you like the idea, please give it a like. This is the best "Thank you!" for the author 😊
P.S. Always do your own analysis before a trade. Put a stop loss. Fix profit in parts. Withdraw profits in fiat and reward yourself and your loved ones

ROSEUSDT🔥Hello everyone👋
Subscribe to the channel to receive more new information about the cryptocurrency market✅
The price after a strong dump went into the consolidation zone, I expect a downward movement to the lower zone of the descending channel, approximately $0.03158

Looking for ROSE as market stables Hmmm, i have judge it for a long position when it was on 0.06000
and i am watching it for $0.2++ again when market become stable..
put your analysis first, don't invest on my advice.

ROSE/USDT BUYING SETUP (SWING)breakout falling wedge pattern and valid retest potential continue upward movement
Buy zone : 0.0743 - 0.066 - 0.06
Target : 0.08 - 0.087 - 0.09991- 0.11606 - 0.13731
Stop : 0.05

Rose - After nice rise there has to be a pullbackReasons to take short
⭐️ BTC rose a lot without pullback
⭐️ Second touch of daily level after long break
⭐️ Coin is losing momentum
⭐️ 135 ATR
⭐️ When instrument will be at the level, it will have around 200 ATR
Will enter when price squeezes to the trendline on 5m timeframe, the base will form and the strip will get faster.
If you don't understand the previous sentence, just use swing stop-loss 3-5%
Fix profit by parts:
1% - 1/3
2% - 1/3, stoploss to breakeven
What's left, hold to the maximum
What do you think of this idea? What is your opinion? Share it in the comments📄🖌
If you like the idea, please give it a like. This is the best "Thank you!" for the author 😊
P.S. Always do your own analysis before a trade. Put a stop loss. Fix profit in parts. Withdraw profits in fiat and reward yourself and your loved ones

ABC Elliot wave theory being respected so far, holding an important algo target.
There's a good chance this lvl can represent a buy opportunity.
Expecting a move to the 0.5 of the pitchfork..
NFA


BULLISH CRYPTO Bitcoin! LONG ROSEAs shown we are represented a triangle shaped pattern.
All depending on the next BULL/BEAR Bitcoin move. We could not only see a 28% rise on ROSE. There will be an little explosion for the smaller coins as well.
Take in mind to invest in some low digit crypto right now. We have seen a massive sell off in Bitcoin and take advantage of this dip can be highly profitable.
We can never predict the lowest bottom of a security, but taking advantage while you still can is always better than missing out.
I have shown in analysis what ROSE could perform in the next day or two. Take your sniper entry!

ROSE Will Survive on the Support or Fail Hard?ROSE might have found support here on the weekly base close to 0.06 and here if the bullish pressure remains strong enough, then we will be seeing a nice reversal on this pair following the arrow as shown on the chart.

ROSE - correction expected ROSE has found support at the Yearly open I flagged as the lower zone in my last post.
While the overall market is still very weak I expect some correction from here
A good strategy now could be to buy dips below the yearly open, targeting the zones as marked,
or buying the a break above the Quarterly as marked
Trading below yearly open and 0.05 this will promise more downside.
TotalDefi chart is a mess due to LUNA, and suggests that if we lose the current trading range and support we could rapidly see another 50-70% mark down

ROSEUSDT price has fallen 1M TF analysis.#OasisNetwork $ROSE just look down to the next.
all market situations will give u long or short opportunities select the right coin have more than 80 percent win ratio .

ROSE - May Trading plans (Long & Short)In my previous idea on ROSE I detailed how ROSE had hit a key zone of support between the monthly and Quarterly opens at 0.18-0.16
I opened a trade in the dip below 0.16 and now we are watching ROSE try to hold and regain this support
I have already closed half my position on the break to 0.18, but wanted to detail what a positive MAY would look like for ROSE, in my opinion
As you can see from the chart ROSE has formed a massive falling wedge and is sitting on the key support mentioned
It will be crucial for ROSE to regain the quarterly open at 0.18
If we can regain the 0.18, I will be watching for an impulse to 0.2-0.23 to confirm the wedge trend, then trading back to the quarterly open, and watching for a breakout above that previous swing high in that same zone: 0.2-0.23
If all this plays out I will be targeting the range as marked
If we fail to regain the quarterly I see us dumping to 0.1-0.12 range and maybe further to the lower zone marked
Both TotalDefi and ROSE are charting bullish divergence on Marco time frames.
Below we can see TotalDefi at trend and key support also, if this breaks we go down - There is a lot of negative sentiment in the market currently, but it is also the place for great risk reward

Rose Usdt Perpfutures market
-------------
Coin: Rose / Usdt
Type : medium swing
Positions : Buy / Long
Leverages 10-20x
-------------
Entry : market price - 0.15532 - 0.15273
Stoploss : 0.14959 (2%)
take profit:
Target 1 - 0.15660
Target 2 - 0.15784
Target 3 - 0.15900

ROSE - Defi looking grim, Zones of interest for ST bounce ROSE has now entered what I have mapped out as a key area of interest, between the 0.18-0.16 range (between Q and M opens), though the market is looking grim to choppy, with TotalDefi looking particularly poor. ROSE has just engulfed both the significant 0.2 and 0.18 supports.
I am hoping market can hold sideways here, but it does not look promising, these are strong signs of further continuation to the down side
If we lose this zone, I'm looking to 0.145, then 0.12-0.1
If we lose that then I see us going much deeper back in to the lower zone marked
For now, I'm trading Short term on the possible bounce
back in from the dip below 0.16 (grabbed at price 0.155)
Another Possible entry if we find support above 0.18 (with stop loss near)
Trade invalidated if we trade below 0.145
TP 1 = 0.18 (Quarterly open)
TP 2 = 0.2
TP 3 = 0.23


Oasis Network Oasis Network key level that's valid for Long entry if tested n hold.
Trade safe.
NB: Patience + Risk management = Winning trades
#E2kclicks #Rose

Rose is starting to Bart Simpson The Bart Simpson has started. As mentioned in my previous post, Rose fell off through the support

ROSEUSDTHello Crypto Lovers,
Mars Signals team wishes you high profits.
This is a one-day-time frame analysis for ROSEUSDT
The price could be supported when it touched the support line. At the moment, it is moving its way and if it leaves this support area and fixes above it, there will be a rise toward the resistance line. But if it loses the support and fixes below this area, it will have a decline to the next support line.
Warning: This is just a suggestion and we do not guarantee profits. We advise you to analyze the chart before opening any positions.
Wish you luck
