Fortis rounding bottom breakout ;)I think the title explains it? Fortis made a rounding bottom and broke out
Roundbottom

Momentum Trade in Suprajit1. RSI over 70
2. MACD turning green
3. Volume Pop up
4. Breakout above resistance
5. Round Bottom Breakout

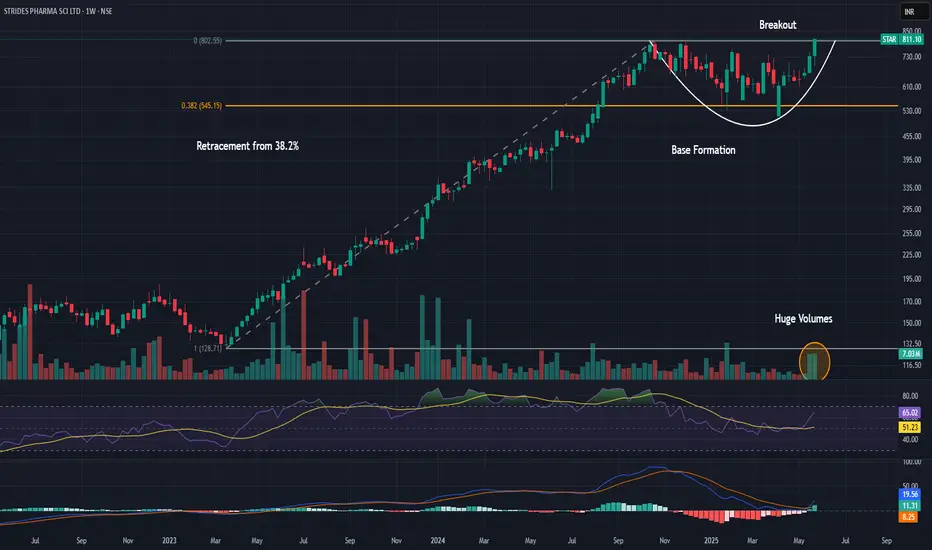
Round Bottom Breakout in Strides Pharma1. Reversal from 32.8% retracement (strong up-move)
2. Good Volume
3. Round Bottom Breakout
4. RSI above 50
5. MACD signal turning green
BLS INTL SERVS - ROUND BOTTOM BREAKOUTRound Bottom breakout
BUY PRICE : 430
SL : 358 (only for swing traders)
TARGET : 600 (40%)
Disclaimer - All information on this page is for educational purposes only,
we are not SEBI Registered, Please consult a SEBI registered financial advisor for your financial matters before investing And taking any decision. We are not responsible for any profit/loss you made.

PLASTIBLENDS - ROUND BOTTOM BREAKOUT8 Months of Round Bottom breakout
BUY PRICE : 353
SL : 304 (only for swing traders)
TARGET : 480 (36%)
Disclaimer - All information on this page is for educational purposes only,
we are not SEBI Registered, Please consult a SEBI registered financial advisor for your financial matters before investing And taking any decision. We are not responsible for any profit/loss you made.

CAMS Trade IDeaCAMS is forming a perfect round base bottom pattern.
Entry above the horizontal line breakout.
Keeping an eye on this one

round bottoming breakout and retestCDSL has given a breakout and is now retesting at the breakout level. This could be a good entry opportunity as short term and mid term momentum is also good

UPST mid-term VIEW Pre Earning LONGUPST on the daily chart with 2022-2023 in range shows a downtrend of more than 70% and
now a round bottom reversal. The volume profile shows the high volumes of the high volume
area which is relatively thin and mostly below the current price. That is to say, UPST has a
lot of volume voids to fill on its way back to $162 . The Triple EMA ( 200,100,50) shows
a convergence over a long interval followed by the reversal and now divergence. The
MACD indicator is upgoing as are the trends of the dual RS lines of the RSI indicator. I see
this as a long swing trade or investment while UPST is awaiting earnings next month.
For targets, I plan the red lines generated by the volume profite and so $94 and $161.
UPST is on my current favorite stock list. My current holding includes an option striking $51
for 8/4. I will roll that option over about 8/2 to avoid time decay. Additionally,
I will buy another option striking $75 and expiring on 9/15 costing about $950 at the
market price with the bid/ask spread of about 4%. I expect the combined two call optins
will yield on average 5-7% per trading day and may hold them through the earnings period.
The only downside risk is that an earnings beat is somehow already priced into UPST
and that the momentum will decelerate and fade. Buying the contact cheap and out of
the money seeks to manage that risk.

BTC looks like a double bottom (2024)btc usdt looks like a double bottom
see, it follows that blue line
soon round or elliptical bottom will get formed
load up guys
next bull is at 2024 - get ready
some say 17500 or 12k or even 10k
but it wont happen
if you have tranches of amount to invest, invest some now, and keep some if you think it will reach more on the downside

LTCUSD- Round Bottom ReversalLTCUSD os the past day demonstrates the Round Bottom Reversal quite well..
The RSI / Ichimoku shows the RSI candles progressively trending upward and
piercing through the cloud.
Selling volume has spikes heading down into the reversal and then once
reversing relative volume has spikes as much as 5X.
Given the sideways of the general cryptocurrency market, right now
LTCUSD is a stable coin STRONG BUY,

GOLD - Our Analysis Shows Probability Of A Pull Back to 1770 Even though gold is holding 1810 level and still above the critical support at 1790-1795 at the moment, our swing model may indicate that the bullish swing from 1750 could come to an end if gold does not have 2 to 3 consecutive closing days above the 200-day moving average at 1825 level. Above 1825, gold will test 1837-1845. But if gold breaks 1790-1795, gold can revisit the 1768-1772 support level.


MUST BUY: CAPLIN POINT LAB LOOKING FIREBALLPLEASE SEE CHART FOR DETAILS
TARGET 1: 650
TARGET 2: 700
STOP LOSS : 520
**These are my personal observations. Please trade at your own risk.**


Slack Ready to Bust a Move$WORK
A name I owned in the 20's but bailed on has quietly based into the 34 handle, is bull flagging with confirmed higher lows, and seems ready to bust out.
Target another 15-20 from here.

BCN (Bytecoin). 1 target wedge + 50%. Rounded bottom + 371%BCN (Bytecoin) A rounded bottom is formed. We are now in the 2nd phase of the formation of this global, long-forming figure.
In the second phase, trading volumes are at a minimum. The coin is not interesting to anyone, "faith is killed," the price is at a historic low, the dump is over. The second phase of the formation of this figure differs in equalizing prices after the dump and a decrease in trading volume.
In most cases, such long-forming formations as a rounded bottom become turning figures of trends. But this does not always happen. Therefore, it is very important that this is the correct entry and exit point in case the price goes against you. It’s better to buy a little more expensive, but it’s already in the birth of an uptrend, than to buy at the bottom and get stuck with this coin.
Volatility also decreased; at the local level, the coin formed a small downward wedge. The purpose of this wedge + 50% This will be the first target. Here is the penetration of this wedge and it will be possible to move to the 3rd phase of the formation of the figure "Round bottom". And the beginning of an uptrend. The maximum target for the “Rounded bottom” figure (Saucer, Cup) is the resistance of this formation + 371%.
If the price breaks through the resistance of the figure of the cup and fixes above it , thereby confirming the reversal of the global trend, the next target is the height to the depth of the cup, the same 370%. And this is more than + 700% of current prices.
Let me remind you BCN (Bytecoin) is an old coin for pumping. Pumps in the past were hundreds of percent and repeatedly.
Monero Top Coin Monero (XMR) is a fork of this coin! Probably few people know about this, as it was a very long time ....
Target:
1) + 50% (fast trading).
2) + 171%
3) + 271%
4) +700%
1) Entrance on a wedge breakout or rollback after a breakthrough if short-term trading.
2) Entrance at the beginning of the 3rd phase of the formation of the "Cup" figure when confirming a local uptrend.
Stop Loos - under the support level of the foundation of this formation, set the Stop Loos value with the calculation of your trading strategy and money management.
Remember that on such coins, due to weak liquidity, ballast is easily reset before a market turn. So your Stop Loos may be among this ballast. What matters is not the Stop Loos value, but the entry point!

WTC (Waltonchain) Downward wedge. Rounded bottom - 2 phase.WTC (Waltonchain) Downward wedge. The price is almost in the corner. A rounded bottom is forming , perhaps we are now in the second phase of the formation of this formation. Lateral movement exists for 84 days, almost 3 months.
The potential the rounded bottom to resistance is huge + 260% , this coincides with the third target the figure - a downward wedge. Perhaps the combination and transition of the patterns of a falling wedge and a rounded bottom will become trend reversal patterns.
Wedge target: + 70%, + 150% + 260%. All levels are shown on the chart.
Log on a breakout of a pattern, or rollback after a break, depending on your trading strategy.
Stop Loss under a downtrend wedge, but a large% comes out. The coin is highly volatile due to weak liquidity. Exit - the correct entry point and Stop Loss movement as the coin grows, given the volatility.

Round bottom?been checking 4h chrt, and it looks like it, decreasing volume, round bottom in the making, we made a nice "scam" wick and back to support, SAR dailly is at 9166, anyway TP for round bottom is arround 8.45K, but at the same time its also a falling wedge breakout, so it can be extended to 8.6k-8.8k even 9.1k... lets see

Don't Short Gold Just YetInsiders think bonds and metals will sell-off as the Fed remains hawkish. I thought the same until I saw this chart. 6 year round bottom with backtest almost complete. This could rocket higher than anyone thought possible.

Love the Idea of Going Long into Twitter EarningsThis chart is one of the few bullish charts I've seen lately. Obvious round bottom pattern, with bull flag suggesting a breakout higher into the 40's. Earnings are reported on 4/23, so will look at this as along into Tuesday, and a hedge through earnings. I would not be surprised to see Twitter set new all time highs over the coming month or two.
Short-Term Target: 40
Long-Term Target: 48
