A rounded formation TOTAL2Rounded formation
These can turn very bullish once completed
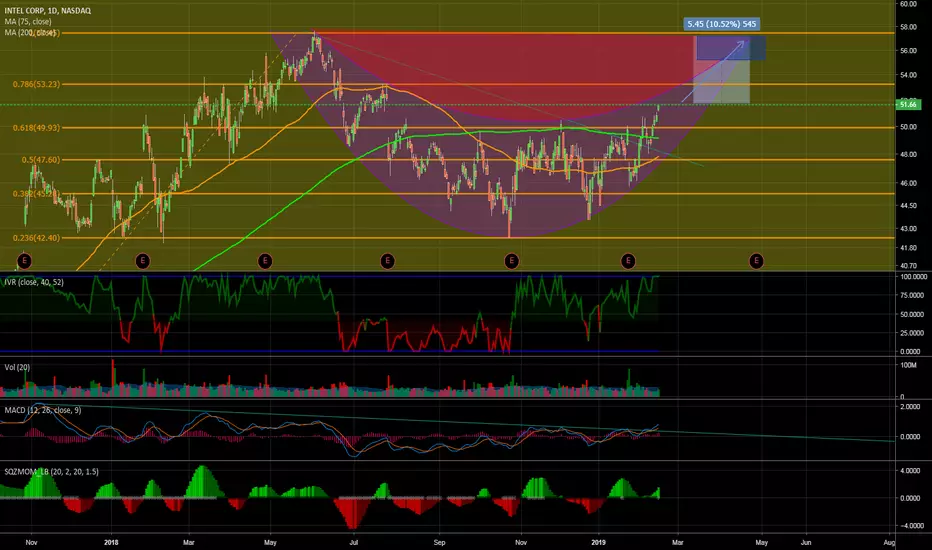
Short term it looks bearish, however this is good in the long run.
Giant Bullflag
Strange times
Rounded-bottom

Harmony (ONE) 450% Profit PotentialHallo Everyone, One is looking bullish right know, i use positioning trading strategy with 1 week timeframe in this analysis
There are supports that push the pair higher :
1. Dynamic support using red curve line
2. Volume Profile
3. EMA 13 and 34
If it reach target FIBO 0.786 then Rounded Bottom Pattern confirm and it will go higher more
In additional, Squeeze momentum indicator showed that the pair still in squeeze release bullish phase, it can strenghten the bullish of the pair
I hope you enjoy the analysis 😁😁😁
See my other positioning trading strategy analysis :

DPharma - Formation of Cup & Handle PatternThis is DPharma H1 Timeframe Chart, the price is supported by the 50EMA.
It created a "Rounded Bottom" or "Cup & Handle" Pattern
It is a bullish continous pattern, If breakout, It may shoot up to 3.90 level.
Today it creat a Flagpole Pattern in the end of the trading day.

A Rounding bottom comingAfter 12 months we can now draw a Rounding bottom pattern and, in all likelihood, we can expect it to be close to completion.
Rounding bottoms are found at the end of extended downward trends and signify a reversal in long-term price movements.
So to follow this turnaround pattern could be a good trade.
Best of Luck.


When will the scallop/rounded bottom end? XRPXRP Idea
I feel the demand for XRP is high even though price action is low
just my opinion though
Included some key levels

BQXBTCThere is a high probability of price moving up from now after that rounded bottom we can see here.

AMBA Pharmaceuticals AMBA can be seen to be displaying many chart patterns including, channels both ascending and descending, ALOT of Horn Tops, a rounded bottom, and an Adam & Adam double bottom. Recently a downward trend break can be seen, forming a new upward trend. This may lead to new upsides. Potential long opportunity.

DANONE Rising WedgeDANONE has formed a large rising wedge. Other patterns present include an ascending scallop, and a rounded bottom within the rising wedge.

OXY Rounded bottom PatternOXY has formed a nice rounded bottom pattern. Has cleared the 50ma and would expect a move to the 200ma in the near term.
Entry today was at $40.63 with a target intersection of the 200ma in the 46-46.50 range.
Low risk entry with a stop at 39.20.
The last 2 earnings dates have led to declines in price so would suggest exiting before earnings.

I've Switched LongBitcoin technicals are showing signs of short term bullishness. I switched long on the break of $7360.
We have an uptrend, support on the EMAs and rounded bottoms everywhere.
We also have a close above the 200 EMA on the 4H. We have not held above the 200 EMA since early November, except for a fakekout last week where we held it for about 24 hours.
We have resistance at $7430 which is also a place where day traders may be taking profit at 1:1 from the latest move. This is the level to watch. A break of this would likely start Bitcoin's next move up to $7700 minimum.
Scenario 1 - A retrace to my entry point or even slightly lower seems likely before moving up in the next day or two.
Scenario 2 - We could simply break up in the next few hours if more bulls jump in on this close above the 200 EMA.
Scenario 3 - If we break $7260 I'll be ready to stop out and look for another entry.

MBT DowntrendMBT has been stuck in a downtrend since 2006, a continuation of this downtrend is most likely. However rising MACD shows promise, it may be rejected as seen before (highlighted in blue box) Gaussian channel shows a possible rejection at the middle. Blue line shows a rounded bottom which is another bullish sign, however it looks particularly bearish in these conditions.
Two double bottoms can also be observed, will the second lead to another rejection at the downward trendline?

$BTC >> Price action outlook until EOY 2020Hi everyone,
Welcome to another update on Bitcoin.
All details are clear in the chart.
Feel free to comment or ask questions.
Cheers,
Leb Crypto

NXT Super Profit or Death.Overly risky coin, but overly profitable. Coin only for temporary speculation, not for holding!
The progenitor of the coin ANDOR (andr). The developers website says that they support the development of both coins. But according to the sad NXT schedule, this cannot be said. The coin is traded on top exchanges such as Polonix, Bitrex, HitBtc.
The coin was pumped several times from + 700% , +1600% + 1700% ! This makes it clear why this coin was created and what work is preferable on it.
What do we see on the chart? There was a downward wedge, after exiting from it, the price did not particularly make any price movements towards working out the goals of the wedge. Now there is a sideways movement, volatility is reduced.
Lateral movement after leaving the wedge for 96 days (3 months). Perhaps this lateral movement of 3 months in length will act as the 2nd phase of a reversal of a very slowly forming figure "Round bottom" ("Saucer") . The descending wedge itself will act as the first phase of this formation. The target are impressive, if in reality this formation will be formed, then only up to the figure resistance + 480%.
Entrance to the market - only at the beginning of the 3rd phase of the formation of the figure! It is very important. Because it is not clear whether it will really form. A relatively slow price increase will mean the beginning of this 3 phase formation of the figure "round bottom".
Enter the market now "at the bottom", maybe get a "second bottom" as a gift. It is better to buy a little more expensive, but for sure, than cheap for good luck!
If the price breaks through the support of the formation and consolidates below it, this will mean that there will be no trend reversal to the upward one at a given time, and you should refrain from buying.
Here is another NXT developer coin - ANDOR coin (Andr). In my opinion, the ANDOR coin is less risky and more understandable in price movements. You also need to understand that this is a newer project of these developers, therefore they will add more time and effort to the development of the project, which will be well displayed on the price chart.
Here is one of the latest trading ideas for the ANDOR coin which has already yielded about + 20%.
Ardor channel movement in increments of 40%. Pivot points
Let me remind you that NXT and ANDOR (Ardr) were created by the same people.
NXT is the first project.
ARDOR (Ardr) - the second project.

$XRP >> Fib channel extension showing $16 target in March 2021With XRP, think long term.
2 targets based on this analysis:
1- Re-test previous ATH around EOY 2020 (yes, that's one year from now).
2- $16 target at the 61.8% extension by March 2021.
Cheers,
Leb Crypto

NOT a FREAKIN' CUP & HANDLE! First of all, if you indeed see this homewrecker of a formation as the cup and handle, bullish twisters, prosperity slim-jims, moon rounded bottom or any of these things ....please , dude get off 1-hour chart :)) you'll find loads of "bullish" double and triple bottoms on 5 and 15-minute charts ...
>>>>Rounded bottom and C&H formations need a bit prolonged time to form, so 12H timeframe will be a legitimate starting point to start discovering your favourite patterns. Can these formations play out on the low timeframes ... sure they can, the same way as Chihuahua can get pregnant by a mastiff.
Seriously though, I think we might have a bit of downside from here. This formation is by NO means is the cup and handle. Cup and handle forms towards the end of the prolonged downturn of the price action NOT after 3000 USD pump (to elaborate a bit, correct C&H = step1: price moves down+step 2: Rounded bottom forms+ step3: price consolidates in the handle area +step4: price breaks out immediately after reaching the neckline). If this indeed was a cup and handle we should have seen an immediate continuation of the momentum as soon as we hit 9.8K yesterday, we did not do that because this is not a freakin cup and handle.
I think we will retest 8.5K level fairly soon and see from there what trading goat Jesus has in store for us.
Stay safe my people, don't get rekd!


$XRP >> Will the rounded Bottom target history repeat in Q4?!Hi everyone,
It's all in the chart.
My theory is that there is a possibility that a repeat of the previous macro rounded bottom is happening right now. XRP technically is at the verge of massive upside; it is immiment, especially as BTC trends sideways and even downwards in the coming couple of months.
A rounded bottom has a very clear target if and when it plays out; as you can see by the previous one in 2017. Yet the 2017 bull run was so powerful that it even over-shot that target after a few months of consolidation.
Will history repeat and we hit the current rounded bottom target at around $50 EOY?
It is wishful thinking to be honest; that's a very bullish target. But I wanted to present it to portray the sheer potential of this XRP beast. It's like no other. And this is simply not talking about its fundamentals..... those are even more powerful.
Well, hope you enjoyed it for what it's worth. I'll stick to my $12 EOY target as a "conservative" Price target.
Cheers,
Leb Crypto

DXY Rounded Bottom and Targets of The PatternTime to update our DXY Chart.
Rounded Bottom forming.
Near Term Determining Fundamentals:
Market's reaction to the FED's repo operations to balance the lack of USD liquidity.
Friday's NFP.
Once more: It's just a matter of time. Global Dollar Rally has not started yet!
Potential Victims: XXXUSD, USDXXX, US INDICES, EM EQUITIES

Rounded BottomUndervalued by DCF fair value=72, nice safety margin w/ Divi close to S&P avg divi yield.
BTC Decision TimePrice is at an even $7000. 'Rounded Bottom' or 'Capitulation'. Let's see which way this goes!
(Chart mainly for my reference)

DIGITAL ALPHA UPDATE - ICX $63?!What is up everyone! Hello to you all, thank you for stopping by. We have a nice little piece on ICX here to present. The subject of today's little discussion is "rounding bottom". We believe ICX is in fact in a larger rounding bottom and has a smaller rounding bottom within that is just breaking out! Who doesn't love a breakout!
The large rounding bottom starts at 0.0009 and dips down to 0.000216. If the larger pattern continues up to 0.0009 then we will be watching for a very big breakout. On the average these breakouts generate around 40-45% returns (this type of return would result in a price of 0.0013 - matches up with 1.618 fib), BUT you normally take the starting price (0.0009) and subtract it from the low (0.000216), take the result (0.000684) and add it to the starting price of the formation (0.0009 + 0.000684 = 0.001584). At current BTC prices we are looking at $15/icx...keep in mind BTC/the overall market needs to be in a bull market to get that type of return, meaning BTC would most likely be at a higher price giving ICX potential prices of $15 (btc = $10k), $31 (btc = $20k), $63 (btc = $40k)! Nice.
Keep in mind, I said a smaller formation too. That formation is on the right side and displayed with 2 hour candles. The larger formation on the left is displayed using 1 day candles. Keep in mind both have volume trends (shown on the bottom) that mimic the formation, meaning this trend is checking all the boxes. The smaller trend on the right is showing breakout potential of 0.000635 using the high price, minus the low price, plus the high price formula. The other price point is 0.00069, which is the 45% return...that also happens to match up with the 0.786 fib. We are awaiting confirmation of this breakout at this moment. We are testing the previous resistance as a support and if successful then the smaller rounded bottom is in play! Now go trade!
Keep in mind, for the large cap portfolio we have not touched ICX. We are riding ICX until this formation plays out...we may have known about this formation a little earlier ;)
Thanks for reading!
DA BULL
BTW - for the XLM trade, the trade did not occur. We were not able to capitalize on it. We traded back into BTC/USD when BTC dipped below $8.7k (mid $8k region). We then re-allocated NEO, LTC, and IOTA like we said we would. Update on Large-Cap portfolio to come. Keep an eye on OMG (hint hint)

Rounded bottom?WABIBTC 1D timeframe
I think that this is Rounded bottom pattern. If u measure in the middle from top to bottom u can use that as potential target, and target will be on the first line of fibb lvls (0.236) , around 15443.
