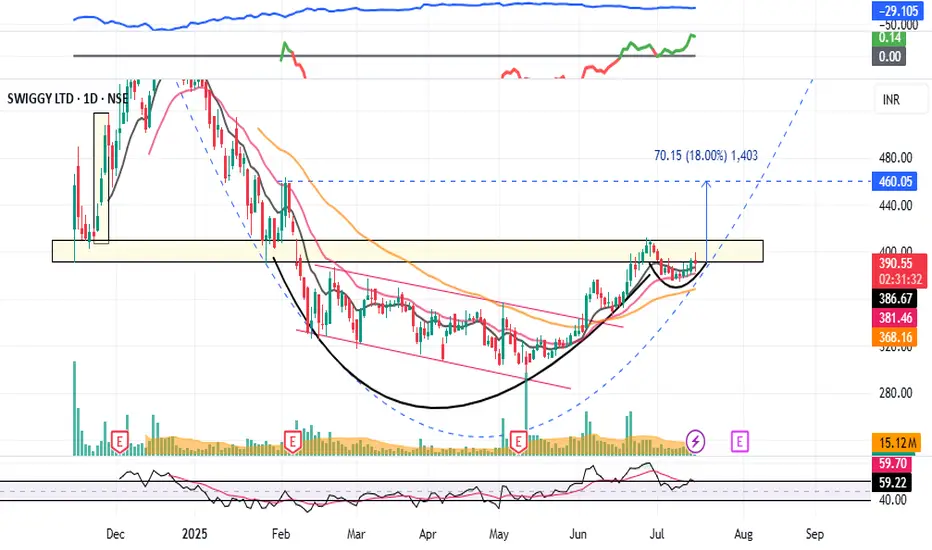
SWIGGY - Breakout Soon (1-3 months)#SWIGGY #breakoutstock #patterntrading #cupandhandle #roundingbottom #trendingstock
SWIGGY : Swing Trade (1-3 Months)
>> Breakout candidate
>> Trending stock
>> Cup and handle pattern
>> Rounding bottom in the long run
>> Good Strength & Volumes Dried up
Swing Traders can lock profit at 10% and keep trailing
Pls Boost, Comment & Follow for more analysis
Disc : Charts shared are for Learning purpose not a Trade Recommendation, Take postions only after consulting your Financial Advisor or a SEBI Registered Advisor.
Roundingbottom
Elecon Engineering: Pre-Breakout Momentum Building!🚀 Elecon Engineering: Pre-Breakout Momentum Building! 🚀
📉 CMP: ₹716
🔒 Stop Loss: ₹652
🎯 Target: ₹952
🔍 Why It Looks Promising?
✅ Rounding Bottom Breakout: Strong breakout above ₹652 with a successful retest.
✅ Fresh Upside Move: Momentum picking up—on track to challenge all-time highs.
💡 Strategy & Risk Management
📈 Staggered Entry: Accumulate gradually near support to manage risk effectively.
🔒 Strict SL: Maintain a disciplined stop loss at ₹652 to protect capital.
📍 Outlook: Elecon is well-positioned for a fresh rally with strong technical structure and volume support.
📉 Disclaimer: Not SEBI-registered. Please conduct your own research or consult a financial advisor before investing.
#EleconEngineering #BreakoutStocks #TechnicalAnalysis #RoundingBottom #SwingTrading #StockMarketIndia #InvestSmart

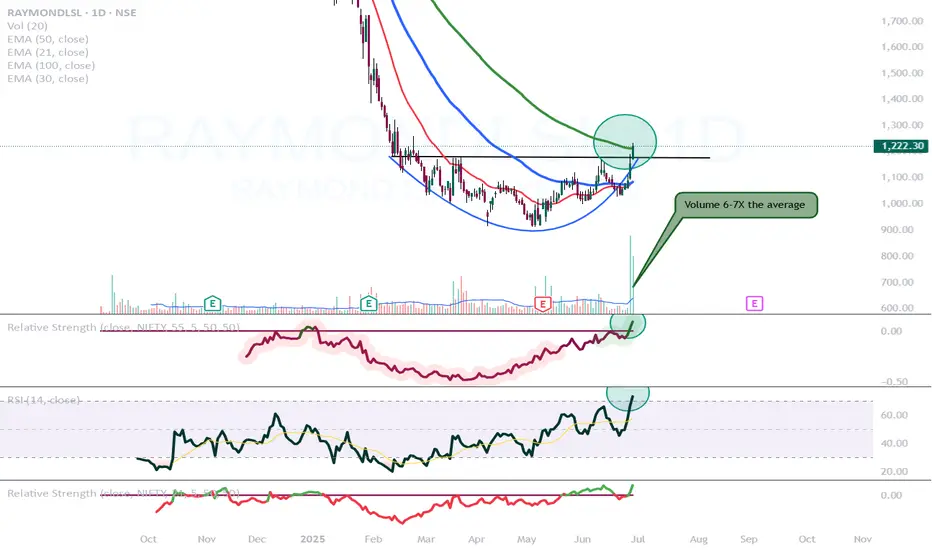
Raymond Lifestyle is looking good!NSE:RAYMONDLSL
- After a 5 month long consolidation now breaking out.
- This is looking like a stage 2 breakout.
- Relative strength turned positive.
- RSI is above 70 indicating very high momentum
- Volume is also very good on the break out candle. Also we can observe that volume is higher on the green candles and lower on the red ones.
- Today it closed above its 100 day exponential moving average as well.
Dogecoin - Don't forget the dog now!Dogecoin - CRYPTO:DOGEUSD - still remains quite bullish:
(click chart above to see the in depth analysis👆🏻)
Basically during every major bullrun on Dogecoin, we always saw a correction of at least -60%. Therefore the recent drop of -70% was not a surprise at all but rather a natural all time high rejection. If Dogecoin manages to now create bullish confirmation, the bullrun will continue.
Levels to watch: $0.2. $0.5
Keep your long term vision!
Philip (BasicTrading)

Fortis rounding bottom breakout ;)I think the title explains it? Fortis made a rounding bottom and broke out

Alibaba - This was just the obvious bottom!Alibaba - NYSE:BABA - will head much higher:
(click chart above to see the in depth analysis👆🏻)
Ever since Alibaba actually retested the previous all time low in 2022, we have been able to see the textbook creation of a rounding bottom formation. Even the recent break and retest was perfectly playing out and if Alibaba confirmes the potental breakout, a rally of +50% will most likely follow.
Levels to watch: $140, $220
Keep your long term vision!
Philip (BasicTrading)

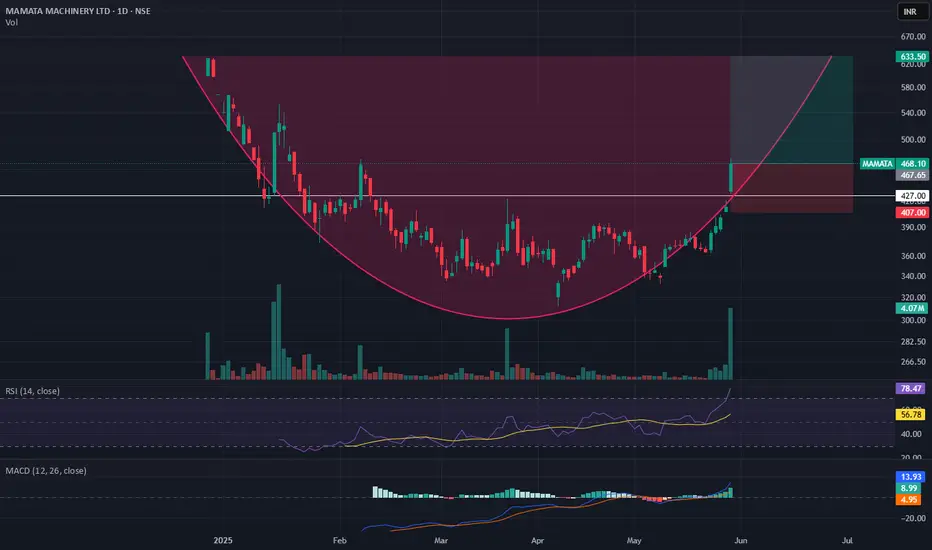
Momentum Trade in Mamata Machinery1. Round Bottom pattern
2. Good Volume
3. HH-HL Structure
4. RSI above 50
5. MACD signal turning green
Cochin Shipyard in Rounding Bottom PatternNSE:COCHINSHIP is in Rounding Botton Pattern following Wave 5. Immediate Target would be 1940. If you are ready to wait then Next Target would be 2200

Bajaj Finserv: Preparing for a Big Move! 🚀 Bajaj Finserv: Preparing for a Big Move! 🚀
📍 CMP: ₹1798
📉 Stop Loss: ₹1615
🎯 Target: ₹2025 | ₹2500
🔹 Key Insights:
✅ Rounding Bottom Formation: Neckline at ₹2025—confirmation above this level could unlock strong upside potential.
✅ Channel Trading: The stock is moving within a well-defined upward channel.
✅ Macro Factor: Potential RBI rate cuts could act as a major catalyst.
✅ Strategy: Staggered entry to manage risk in a volatile market.
⚠️ Risk Management: Strict adherence to stop loss at ₹1615 is crucial.
📉 Disclaimer: As a non-SEBI registered analyst, I recommend conducting thorough research or seeking advice from financial professionals before making investment decisions.
#BajajFinserv #TechnicalAnalysis #BreakoutStrategy #SwingTrading #StockMarket

BPCL: Preempting a Rounding Bottom Breakout! 🚀 BPCL: Preempting a Rounding Bottom Breakout! 🚀
📉 CMP: ₹286.8
🔒 Stop Loss: ₹271
🎯 Targets: ₹298 | ₹307 | ₹318
Why BPCL Looks Interesting?
✅ Technical Setup: Forming a rounding bottom with ₹290 as a key resistance-turned-support level
✅ Strength Amid Volatility: Despite tariff fluctuations and market swings, BPCL has held firm, signaling a potential reversal
✅ Breakout Potential: A sustained move above ₹290 could confirm the bullish structure
💡 Strategy & Risk Management:
🔒 Stop Loss: ₹271 to protect downside risk
📈 Staggered Entry: Phased accumulation to manage volatility effectively
⚠️ Caution: The market has seen strong moves—position sizing should be managed carefully.
💬 Do you see energy stocks leading the next market move? Drop your thoughts below!
#BPCL #BreakoutTrading #TechnicalAnalysis #StockMarket #SwingTrading
📉 Disclaimer: Not SEBI-registered. Conduct independent research or consult a professional before investing.

Alibaba - Don't Forget Chinese Stocks Now!Alibaba ( NYSE:BABA ) still remains super interesting:
Click chart above to see the detailed analysis👆🏻
After we saw the very expected parabolic rally on Alibaba about four months ago, Alibaba is now perfectly retesting major previous structure. Yes, we could see a short term pullback in the near future but this just offers a perfect break and retest after the rounding bottom pattern.
Levels to watch: $110, $140
Keep your long term vision,
Philip (BasicTrading)

Dogecoin - This Candle Decides Everything!Dogecoin ( CRYPTO:DOGEUSD ) is about to close above support:
Click chart above to see the detailed analysis👆🏻
When we look at the chart of Dogecoin, we can again see that this bullish cycle was starting with a clear rounding bottom formation. This simply means that there is a 100% chance that a bullish parabolic rally will follow and this monthly candle might just be the beginning.
Levels to watch: $0.15, $0.5
Keep your long term vision,
Philip (BasicTrading)

Bajaj Finserv: Preempting a Major Breakout! 🚀 Bajaj Finserv: Preempting a Major Breakout! 🚀
📈 CMP: ₹2007 | SL: ₹1733 | Target: ₹2503
🔹 Breakout Above ₹2029 = All-Time High!
🔹 All-Time High Monthly Close Achieved
Why Bajaj Finserv Looks Strong?
✅ Technical Breakout: Rounding bottom pattern nearing completion
✅ Sector Strength: RBI's liquidity measures favor NBFC growth
✅ Finnifty Outperformance: Financial stocks showing resilience with strong weekly & monthly closes
💡 Strategy & Risk Management:
🔒 Stop Loss: ₹1733 to limit downside risk
📈 Staggered Entry: Phased accumulation to navigate volatility
⚠️ Caution: Market has rallied—adjust position sizing accordingly.
💬 Do you see financials leading the next rally? Share your views!
#BajajFinserv #BreakoutTrading #TechnicalAnalysis #NBFC #StockMarket #SwingTrading
📉 Disclaimer: Not SEBI-registered. Conduct independent research or consult a professional before investing.

WIPRO READY TO GIVE 30 % UPSIDE MOVEMENTNSE:WIPRO trade at 550 level. You can watch it its till ALL TIME HIGH LEVEL at 720, 30% upside from current price.

BTCUSD Bullish Continuation: Rounding Bottom Supports Uptrend!COINBASE:BTCUSD - 4Hr Analysis
After analyzing the chart, I believe that price will continue its bullish cycle in the next few hours due to the formation of two key patterns: the Rising Wedge and the Rounding Bottom.
Rising Wedge:
The Rising Wedge is traditionally a bearish pattern, indicating a potential reversal or breakdown. However, in certain cases, this pattern can break out to the upside in the short term, especially if the price is near the top of the wedge. As seen in this chart, the Rising Wedge could suggest a temporary bullish breakout before the bearish pressure takes over. The breakout from this pattern often occurs due to bullish momentum pushing the price higher for a brief period.
Rounding Bottom:
The Rounding Bottom is a bullish pattern, indicating that the price has already started a recovery from a period of consolidation or decline. This pattern signals strength and momentum building after a downtrend, making it more likely that the current uptrend will continue. Since the Rounding Bottom is a reliable precursor to a sustained uptrend, it supports the idea that Bitcoin’s price will maintain its bullish cycle.
Conclusion:
The combination of the Rising Wedge and Rounding Bottom suggests that although there may be short-term price fluctuations, the overall trend is likely to remain bullish. Traders should keep an eye on the breakout from the Rising Wedge for potential entry points, while respecting the longer-term bullish signal from the Rounding Bottom.
Follow your risk management and happy trading!

ITD Cementation India Long Term Investment IdeaIntroduction
ITD Cementation India Ltd. engages in the construction of a wide variety of structures. Its areas of operations include maritime structures, mass rapid transport systems (MRTS), dams and tunnels, airports, highways, bridges and flyovers, and other foundations and specialized engineering work.
Observation
As we can see stock breakout its channel with huge trade volume, Open marabuzo and....
Visit on website👆deeper detail and its fundamentals

AADHAR HOUSING potential breakout - Prior buying force.
- Tight price action.
- Near base high.
- Volume contraction.
- Low risk entry.
- Strong sector (housing finance)
- High relative strength.

READY FOR ROUNDING BOTTOM BRRAKOUT...NSE:ABFRL trade at 325 level. Stock chart shows that its make a Rounding Bottom pattern on weekly time frame and ready for give a breakout. So You can watch for an Upside Move at 400-450 level...

Eclerx - Runding Bottom BreakoutEclerx has given breakout of rounding bottom
Entry - Above 2960
SL - 10%
TGT - Highlighted on chart.

Going to All Time High...NSE:METROPOLIS trade at 2135.
Support is at 1860
Resistance is at 2360
You can watch it going to all time high...

UTIAMC Rounding BottomUTIAMC has completed rounding bottom on weekly chart. currently in supply zone.
If the stock sustains above 1220, a good move towards 1500 is expected.

Perfect Rounding Bottom ....NSE:RALLIS trade at 355. Support is at 300 and Resistance at 375,
after breakout you can watch it next resistance at 500.

NAUKRI rounding bottomAn IT stock, named Info-edge stock symbol NAUKRI has made a rounding bottom pattern, which is now near it's resistance. Must break the resistance and retest it!
