DJI short simple setupVery simple entry
GAP is holding any gains
on 1H we can see rounded top with multiple Doji candles
TP area is set up close to recent lows
All this is aligned with Fibonacci 78.60%
Roundnumber

Zigzag Circles Strategy Test 1st April → 6th June@LonesomeTheBlue has recently published an interesting script LTB Zigzag Circles . I got curious about its performance, so I tinkered out a strategy and tested it out on GBPUSD.
I will use ZigZag Circles with a period of 14 on a 30m timeframe. Furthermore, I will utilize round levels to place my entries, exits, and stops.
When there is a bullish signal:
► a limit entry is placed at the nearest-below x000, x200, x500, or x800 level.
► a stop-loss is placed halfway through to another such level below.
► a take-profit will be at the nearest x000, x200, x500, or x800 level to the upside.
When there is a bearish signal:
► a limit entry is placed at the nearest-above x000, x200, x500, or x800 level.
► a stop-loss is placed halfway through to another such level above.
► a take-profit will be at the nearest x00, x200, x500, or x800 level to the downside
(check the first picture for clarification, round levels are shown in gray)
#1 A first entry signal at 17:00
Look at the limit order. A limit is right before 1.38200, the exit before 1.38500, the stop-loss between 1.38000 and 1.38200.
#1 A first order is closed in profit in roughly 12 hours
#2 A second position opened and closed according to rules
#Not All Entries Trigger
Obviously, I didn't leave the entry orders hanging out there forever.
#3 A first loser
This is how a lost trade looked like.
#5, #6 A little problematic area
This is a problem you might encounter with LTB Zigzag Circles. Signals point in both directions... I wouldn't take the long one as the signal is far from my level, but during the backtest, I follow the rules. Hence a win and a loss.
#8, #9, #10, #11 a series of losses in a consolidation area
When the price keeps on contracting, there might be several false signals in a row. Even though you may still see some respect for the x500 zone, the bounces are small and not enough to reach the profits. In real trading, the entries could be identified as unconvincing and avoided.
#14, #15 Two winners in a row
Although the stop-loss was dangerously close to where the price once was for the first one, this is how the winners in a row might look like.
#22 Another problematic situation
Lastly, I wanted to put attention to this imaginary trade. The very point of using limit orders in this test is to make sure I have enough time to get the signal and evaluate its quality. I do believe, there wouldn't be enough time to open a position from a level designated by rules. So I put it on the nearest one below. I know I wouldn't want to take that trade after I was notified at the candle's close. If you would, count it as a loss.
Conclusions
37 trades were open since the beginning of April, out of which 44% were profitable with an accumulated profit of 1141 ticks .
When backtesting, I like to subtract 3 pips from every trade to give it a better feel of the real world. You make mistakes and you also pay spreads and fees. If I subtract 3 pips from every single trade, the strategy will still be profitable, but barely. It's 91 ticks only. Of course, the real spread is smaller than that, so this is a good result also.
Lastly, I saw the price to continue in the direction of the trade far exceeding its original take profit. With advanced trade management (which can not be backtested easily), profits would be higher.
Remember, that 37 trades is a narrow sample size. It is enough to give you an idea of what parts of the strategy to improve. But for accurate statistics, you should test your strategy 180+ times.

Most simple strategyIf you don't have to much time or you want to keep your charts simple, or maybe you are just lazy. This strategy is right for you !
What is it ? Is it magic ? No... Round numbers .
Imagine you are going to buy a car. You go to website and look for used cars... What is your price limit ? It is always 5000USD, 10 000EUR or 2500GBP. You dont set your price limit to 4786EUR or 13 334USD. It is the same in trading and investing.
Round numbers are psychological support/resistance levels . For example, if ETH/USD is going upwards and reaches 2000USD, you will notice strong bearish reactions, because a lot of traders believe that the currency pair cannot go any higher than that, so they sell in fear of losing their profits.
Traders can use the round numbers as a strategy. Psychological levels are 00, 25, 50 and 75. In order to use the numbers, you need to go short when market goes up and one of these levels is reached. Also at these price levels you can expect institutional buy/sell orders, SL's and TP's.
You can also use it in forex, stocks or indeces... Watch how 1.40(GBP/USD) works. Or 1.20 (EUR/USD)
Try to play with your charts and be creative... Do not hesitate to add moving averages, fibo levels or candlestick patterns :)
And as I always say: there is beauty in simplicity ;)

NANO 5 USD good opportunity for long position See my other idea linked below.
Solid buying zone and even if the BTC price will go down the NANOBTC should keep price higher.
Also price of BTC can bounce from 30k so it will fuel price of NANO even if NANOBTC will stay in place.

Short Scalping EURNZD 10 PipsNueva Idea de Trading EURNZD 1.67700 & 1.67800 Stop= 1.68050 TP= 10 pips Operación OCO. Risk= 1% Reward: 0,15%-0,20%

US100 - Detailed Video Analysis!Hello everyone, if you like the idea, do not forget to support with a like and follow.
Here is the top-down analysis for US100, feel free to request any pair/instrument or ask any questions in the comment section below.
Best of luck!

BTC Traders: Fasten Your Seatbelt BTC has successfully retraced 61.8% in the corrective waves (ABC) and we can consider this phase to be done. An overview on the H4 timeframe will tell us that BTC is in its 3rd wave (bullish) and longest. Round numbers are our next targets. Will it be able to reach the 60K by the end of the week ? Supply and Demand will tell, that's why you should fasten your seatbelt as we are heading to the moon with BTC.
Best of Luck !
MacroForex

GOLD - Buy Setup Forming!Hello everyone, if you like the idea, do not forget to support with a like and follow.
GOLD is sitting around a round number 1800.0 so we will be looking for buy setups on lower timeframes.
on H4: GOLD is forming a trendline in red but it is not valid yet so we will be waiting for a third swing high to form around our upper red trendline to consider it our trigger swing. (projection in purple)
Trigger => Waiting for that swing to form and then buy after a momentum candle close above it (gray zone)
Until the buy is activated, GOLD would be overall bearish and can still break the 1800 level downward.
And of course, as GOLD approaches our upper orange trendline, we will be looking for sell setups.
Good luck!
~Rich

TESLA Video Top-Down Analysis - Will This Beast Take A Rest?Hello everyone, if you like the idea, do not forget to support with a like and follow.
Here is the top-down analysis for TESLA, feel free to request any pair/instrument or ask any questions in the comment section below.
Best of luck!

An Apple A Day Keeps Bankruptcy AwayHello everyone, if you like the idea, do not forget to support with a like and follow.
on DAILY: APPLE is sitting around a strong supply area in blue and its All-Time-High so we will be looking for sell setups on lower timeframes.
on H1: APPLE is forming a trendline in red but it is not valid yet so now we are waiting for a third swing to form around it to consider it valid.
Trigger: Waiting for a momentum candle close below the gray area to sell.
and until the sell is activated, this one would be overall bullish and can still dive inside the blue zone.
As price approaches our lower green support, we will be looking for buy setups.
Good luck!

GOLD and ETHEREUM - Interesting Combination!First of all, I would like to thank @TradingView for this chart combination!
XAUETH is approaching its all time low around 1.00-2.00 so we will be looking for buy setups!
knowing that this one can still dive inside the zone, reach level 1.00 before going up
For XAUETH to go up, there are three scenarios:
1- GOLD UP, and ETHEREUM DOWN (best case scenario)
2- GOLD UP, and ETHEREUM UP but with Gold moving up more aggressively.
3- GOLD DOWN, and ETHEREUM DOWN but with Ethereum moving down more aggressively.
How to trade it?
Well it depends on your trading style/plan. but here is what I am waiting for as per my trading plan:
ON H4: XAUETH formed a valid channel in red so we are waiting for a new swing high to form around the upper trendline to consider it our trigger swing and buy on its break upward.
The stop loss goes below the last swing low, and we always target double our stop loss size to have an edge over the market.
Meanwhile, until the buy is activated, XAUETH would be overall bearish and can still test the level 1.000 before going up. that's the power of waiting for a confirmation and trigger.
Good luck!

GOLD still waiting for a trigger to sell!Hello everyone, if you like the idea, do not forget to support with a like and follow.
on DAILY: GOLD is sitting around strong resistance 1900 in blue and brown trendline so we will be looking for sell setups on lower timeframes.
on H4: GOLD formed a wedge pattern in red so now we are waiting for our trigger to confirm the bearish movement.
Trigger: Waiting for a momentum candle close below the gray area to sell.
and until the sell is activated, this one would be overall bullish and can still dive inside the blue zone.
and since now GOLD is sitting around 1900 we will be looking for sell setups on lower timeframes like M30.
we will be looking for sell setups, unless price breaks aggressively above 1900, then the momentum will be shifted from bearish to bullish.
As price approaches our lower green support, we will be looking for buy setups.
Good luck!

GOLD waiting for a trigger to sell!Hello everyone, if you like the idea, do not forget to support with a like and follow.
on DAILY: GOLD is sitting around strong resistance 1900 in blue and brown trendline so we will be looking for sell setups on lower timeframes.
on H4: GOLD formed a wedge pattern in red so now we are waiting for our trigger to confirm the bearish movement.
Trigger: Waiting for a momentum candle close below the gray area to sell.
and until the sell is activated, this one would be overall bullish and can still dive inside the blue zone.
As price approaches our lower green support, we will be looking for buy setups.
Good luck!

GOLD - Don't Sell Now! - Video Top-Down AnalysisHello everyone, if you like the idea, do not forget to support with a like and follow.
on DAILY: GOLD is sitting around strong resistance 1900 in blue and brown trendline so we will be looking for sell setups on lower timeframes.
on H4: GOLD is forming a wedge pattern in red so we are waiting for a new swing to form around it to consider it objective/valid.
Trigger: Waiting for a momentum candle close below the gray area to sell.
and until the sell is activated, this one would be overall bullish and can still dive inside the blue zone.
As price approaches our lower green support, we will be looking for buy setups.
Good luck!

BITCOIN UPDATE - Video Detailed Top-Down AnalysisHello everyone, if you like the idea, do not forget to support with a like and follow.
Here is the top-down analysis for BITCOIN, feel free to request any pair/instrument or ask any questions in the comment section below.
Best of luck!

DOW JONES - Don't Sell Now! - video top-down AnalysisHello everyone, if you like the idea, do not forget to support with a like and follow.
Here is the top-down analysis for US30, feel free to request any pair/instrument or ask any questions in the comment section below.
Best of luck!

GOLD --4H analysis--Here is bearish signals on 4H TF like daily TF.
Price is making head and shoulder.
If price goes below 1830 we can see lower targets.
P will share 1H analysis in next post for entry signals.
Follow me to do not miss the trade!
.
.
.
.
It will be amazing to share your thoughts and comment about gold here!
.
.
.
.
If you liked the idea click like and follow to see more upcoming updates.
I'll be glad to know your opinion in the comments.
This is just a bit of financial advice, do your own research too.
.
.
It's based on top down analysis

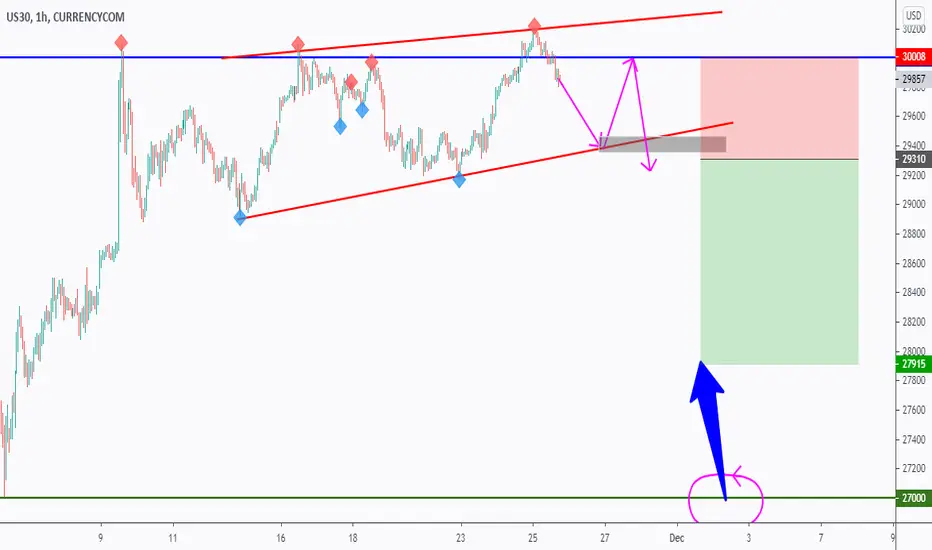
DOW JONES Sell Setup!Hello everyone, if you like the idea, do not forget to support with a like and follow.
on DAILY: DOW JONES is sitting around strong resistance in blue and round number 3000.0 so we will be looking for sell setups on lower timeframes.
on H1: DOW JONES formed an objective wedge pattern in red so we are waiting for a momentum candle close below its last swing to sell.
Trigger: Waiting for a momentum candle close below the gray area to sell.
and until the sell is activated, this one would be overall bullish and can still dive inside the blue zone.
As price approaches our lower green support, we will be looking for buy setups.
Good luck!

BITCOIN video top-down AnalysisHello everyone, if you like the idea, do not forget to support with a like and follow.
Here is the top-down analysis for BITCOIN, feel free to request any pair/instrument or ask any questions in the comment section below.
Best of luck!

DOW JONES video top-down AnalysisHello everyone, if you like the idea, do not forget to support with a like and follow.
Here is the top-down analysis for DOW JONES, feel free to request any pair/instrument or ask any questions in the comment section below.
Best of luck!

BITCOIN - BTCUSD Sell Setup!Hello everyone, if you like the idea, do not forget to support with a like and follow.
on DAILY: BITCOIN is sitting around a strong supply and round number 20k so we will be looking for sell setups on lower timeframes.
on H1: BITCOIN is forming a channel in red and green trendline, but it is not valid yet, so we will be waiting for a third swing to form around our lower red trendline to consider it valid and sell on its break downward.
Trigger: Waiting for a momentum candle close below the gray area to sell.
NB: Until the sell is activated, this one would be overall bullish.
Good luck!

DOW JONES - US30 Sell Setup!Hello everyone, if you like the idea, do not forget to support with a like and follow.
on DAILY: DOW JONES is sitting around a strong resistance and round number 3000 so we will be looking for sell setups on lower timeframes.
on H1: DOW JONES is forming a channel in red, but it is not valid yet, so we will be waiting for a third swing to form around our lower red trendline to consider it valid and sell on its break downward.
Trigger: Waiting for a momentum candle close below the gray area to sell.
NB: Until the sell is activated, this one would be overall bullish.
Good luck!
USDMXN video top-down AnalysisHello everyone, if you like the idea, do not forget to support with a like and follow.
Here is the top-down analysis for USDMXN, feel free to request any pair/instrument or ask any questions in the comment section below.
Best of luck!
