Rsi_divergence

BTC is oversold. We are going to see BOUNCE BACK soon!!!Hello Everyone,
I was trying to make an analysis for possible bounce from last 1 week but was not able to get any glimpse on it. But, Today, after 1D candle closing, i see something which is saying few things.
*We are experiencing strong drop over the last few weeks. We can clearly see Bitcoin is now oversold levels. Daily and as well as in Weekly. we are looking at such low value of RSI after very long time.
* RSI value in 1W chart is 12.56. (Just check the chart to see RSI value. When was this number last seen?)
*As we can see on the chart that Bitcoin is trying to make support by sideways consolidation pattern in 4H and 1H timeframe. In 1D and 1W, BTC is oversold. We may see a little pump soon. But, aware!!! we are not out of bear market. I am expecting more downwards trend in upcoming days and we may touch the level of 16K.
*This is a short analysis for BTC which is showing a smart bounce very soon. Also, today is Saturday and we are closing 1W candle soon which is testing 250MA support . so bounce is expected.
Kindly manage your risk accordingly and never forget to put stop-loss while trading. Its really important in such bear market. HAPPY TRADING!!!
Please follow, like and share your ideas for improvement in our community.

Sell the HS for 500 pipsFirstly the market is super bearish.
We see a double top on M15 in HSI to sell at 21100.
Trend is down on H1 and H4.

BTC-USDT(W Pattern With bullish 4 hourly divergence)In my opinion 4 hourly divergence enough to push bitcion price to 23k area again,and complete this(W)..Risk reward ratio 1:2.5

The level to short AUDUSD is 0.7025The trend for AUDUSD is down on H4 and D1.
The price inside the moving average of H4.
M15, M30 and H1 is all overbought.
Waiting for a double top to sell.
There are also two harmonic patterns happening at this zone.

BTC-USDT(Falling wedge formation,with bullish rsi divergence)I think will see move to upside..Risk reward ratio 1:3

ETHUSDTHI Guys!
According to breaking 1418$ price the corrective scenario is canceled!
SO its not a correction but a descending trend!
it will form 5 descending waves and it has made 3 of them.
at the end of wave 3 we can trade on wave 4 :)

BTCUSDT 1HR WK # 24If 20500 gets broken(with conviction i.e red vector with high vol and large spread) expect lower prices post fomc


AVAXUSDTVery clean template being completed.
Should the vision go according to the scenario? If we go according to the scenario, we can have an interesting deal.
Must see ...


RUNEUSDTWe can expect the price to rise to the $ 2,758 range if the $ 2.364 price range is not eliminated and not engulfed.
If we have a good momentum, we can expect the price to reach the blue range ($ 3.157).
Most importantly, it is to be removed from the FTX exchange for June 13 !!!

BTC Swing analyzehello friends.
hope u are good.
you can see in my chart that maybe we are in 4th wave
and we can grow till 50% retracement level (or maybe 38.2 or 61.8)
and after that we can fall.
also we can see the RSI trendline breaked up and it can be the buy signal.
we see a divergence between RSI and price that i show it in my chart with
orange circles.
we see the stoch momentum in oversold area.
hope u enjoy my analyze.if you like it plz support me.thanks
(this is not trading advise and you must trade in your own starategy friends.)

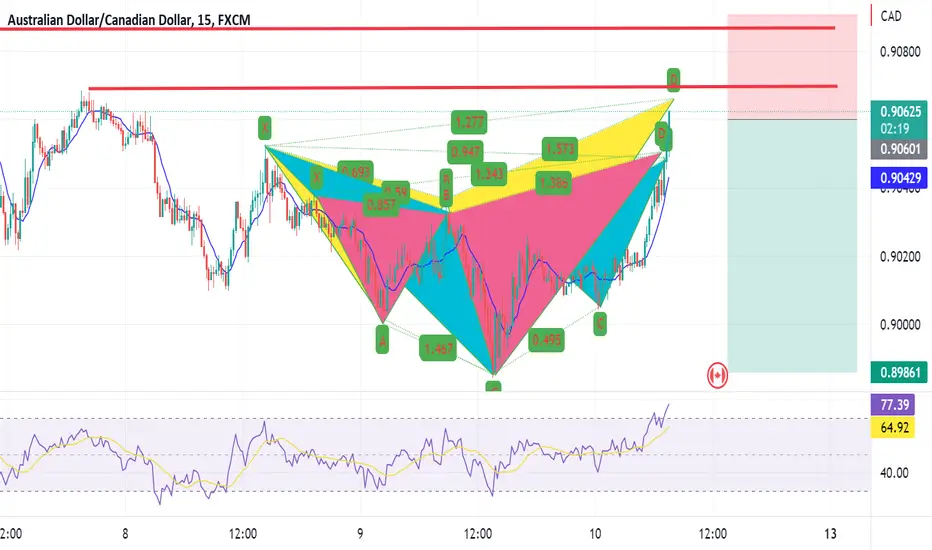
Why selling AUDCAD is almost a sure winIf you ever want the perfect trade, this could be it.
D1 trend is down
H4 is down
Touching the H4 MA now
There are 3 harmonic patterns.
Despite all of this, we will wait for a M15 reversal to get in. Likely in 2-3 hours from time of posting.
USD/CADWhat will you do? Buy or Sell?8 Jun 2022
What will you do?
Buy or Sell?
Pair: USDCAD
Indicators: RSI is divergences for bullish and Stochastic oscillator oversold.
#usdcad #long

Selling EURGBP after the longWe got 50 pips on EURGBP long this morning.
Now it is time to sell and aim for a lower level around 0.8440.
The reason is there is a pattern completing here.
There are multiple tops on EURGBP and it is likely to fall now.

Weak NZDCAD LONG H1 ReversalPrice was rejected on the same level before, trying to catch a small pullback.
Confirmation: RSI and MACD Divergence
To watch: Might move TP to a lower level, possible on the previous high. As this set up might only be a pullback and might not be a reversal

Taking a long position on EURGBP It is time to go long on EURGBP.
The pair has reversed downwards. However there is an opportunity to capture about 30+ pips by going long.
There is a butterfly pattern and M15 divergence.

MU at support but showing signs of falling throughMU has a strong support / resistance line at the $65 mark. On the weekly chart we can see an RSI divergence. The daily chart shows it has a strong possibility of rebounding off support once again.
Traders should watch the ticker at the current price levels and channels. If it pops out of the current channel on the daily chart, traders should take an aggressive long position as a swing trade. If it falls through the support level of $65 then traders should take a short position, and could honestly trade at multiple time and price targets as it will likely fall first fast (as it has cracked support) but then continue to fall for a while longer.

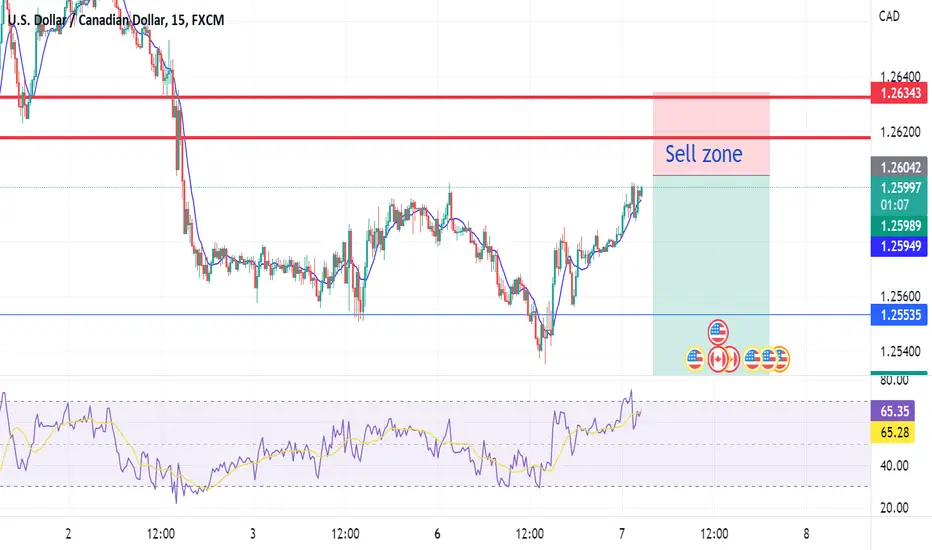
Here is the sell zone for USDCADDaily is down
H4 is down.
Pair is hitting the H4 MA
M15 OB but there isn't enough divergence.
Awaiting a sell at 1.2615 - 1.2630
Stop loss around 30 pips.
ETHUSD - RSI AnalysisAn idea for ETHUSD
I expect the next bottom to form along the 200MA, which correlates well with the 200MA (green)
Areas in yellow are strong bullish entry points
The bottom point falls along these diagonal downtrend lines as does the top point
There seems also with the current top formation to be a large divergence on the RSI

USD/JPY What will you do? Buy or Sell?
FX:USDJPY
Pair : USDJPY
Indicators: RSI is Bearish Divergence
Indicators: Stochastic oscillator overbought.
Short / USDJPY

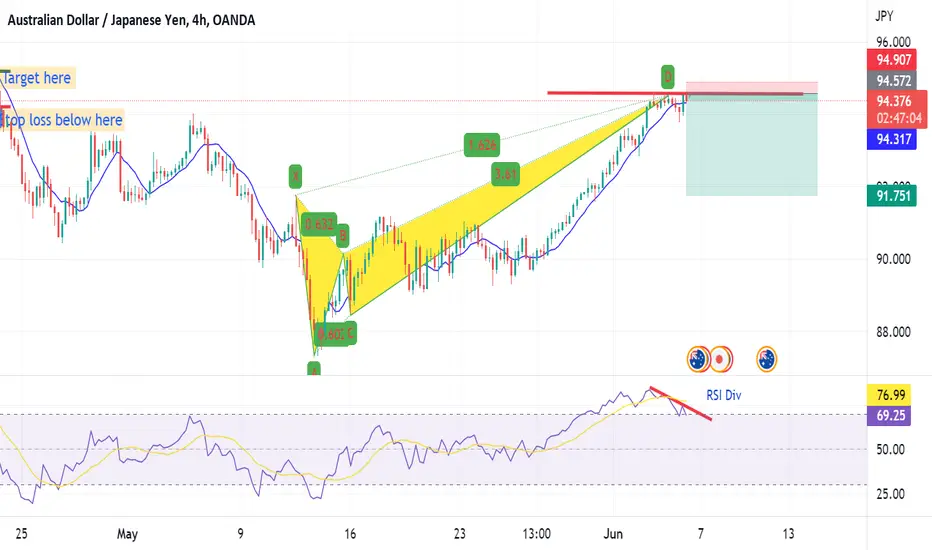
Selling AUDJPY at the high of last weekHere is why:
1) Harmonic Pattern
2) H4 divergence
3) Weekly high
4) m15 Divergence to execute the trade
Target is 91.5 which is a big drop. Waiting for trigger to enter.