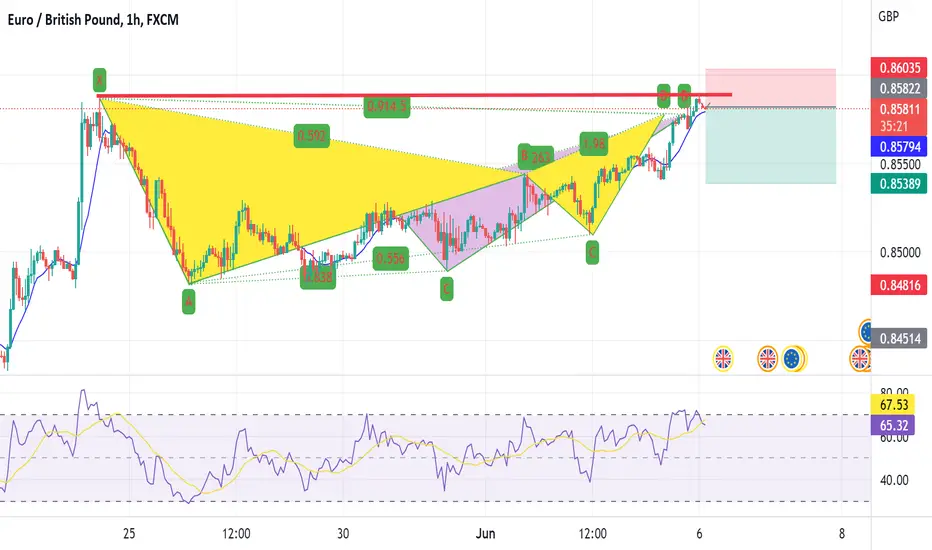
2 reasons to sell EURGBP nowEURGBP is on the uptrend so this is a countertrend trade. There are some good reasons for taking this.
1) There are 2 harmonic patterns to sell.
2) There is a weekly high from last week at 0.8588
3) H4, H1, M30, M15 is all overbought
4) RSI divergence in M30 and M15.
Stop loss is just 30 pips. Let's go!
Rsi_divergence
AUDNZD Quick Sell TradeThis is a counter trend trade.
H1 has shown a high yesterday at 1.1075
There is a M15 Double top.
Harmonic pattern present.

Time for USD to strengthen?The markets have been recovering along with the AUD. However we see most of the USD pairs at a high (meaning USD is super weak) and there is a chance to go sell AUDUSD now.
H4, H1, M30 and M15 OB
Nice harmonic pattern
This is against the trend, so don't stay in it too long.

Selling USDJPY at 130130 is a round number that many traders would be watching.
We also see a harmonic pattern to sell.
The trigger is on H1, M30 and M15 with divergence.
It also relates to our big picture for USDJPY.
Stop Loss 50 pips only.

Muthoot FinanceHello and welcome to this analysis on MUTHOOT FINANCE cmp 1130
After peaking out in NOV 2021 it gave a Head & Shoulder breakdown in JAN 2022 which lead to a Bearish Alt ABCD 1.6x breakdown.
Now after completing its Bearish Alt ABCD it has reversed with a Bullish Harmonic Alt Shark with a Long Legged Doji candle and a Positive RSI Divergence.
It could bounce back to 1200 (initial target) to 1275 where it might retest the falling trend line.
The pattern would be considered invalid below 1070

HINDALCO 25% move upside EXPECTED
CONVICTIONS
1. Double bottom pattern
2. RSI divergence
3. Long support
NSE:HINDALCO


AUDCAD Long chance coming upAUDCAD is on the uptrend.
Both D1 and H4 is up.
There is a harmonic pattern to go long.
M15 is showing divergence.

BTC MacroRSI showing BTC is getting close to hitting the bottom soon, based on this it could happen some time this summer. Things are getting interesting in the market with DXY looking like it has already reached its top and tech stocks having some nice pumps recently after being down for some months.

ALTCOINS WILL BE DESTORYED EVEN MORE?This is another renko charts. This time it's btc.d (dominance of btc) with 0.5% block size on the 1d.
We can observe something similar to a falling wedge pattern with clear bullish divergence on RSI. Since start of 2022 we saw a decent correction in btc pairs but still a lot altcoins looks alive. ETH/BTC pair for exemlpe. For now the dominance is slowly rising and it needs to raise up to 45% just to test the upper line. Will there be a break out? We don't know yet, but bullish divergence is telling us, that it's getting ready for something.
So are we going to witness altcoins meltdown?

AltsCoins Pump SooonBTC.D 3hr Chart Analysis.
Fibonacci Retracement Showing Something .
BTC.D Also Showing RSI bearish divergence in 1d Chart.
I am Showing Question Mark In Chart Tell me Your Thought in Comments Box
Pump or Dump BTC.D
See Chart for More Details
This Time Wait & Watch
#BTC.D movement
Guy's Don't Forget to put SL in your Trade in this Market movement
I hope friends you understand my analysis.
Me & my Team trying to best analysis for you Friends.
~~Please Support Friends~~
(Not Financial Advice)
~~Best Of Luck~~
!! Thank You My Team !!

Long BTC - Regular Bullish DivMarket might consolidate a bit after the liquidity void has been filled. It is holding in Buyers Golden pocket for now and also playing in OB.
Wait for a break out and put your entry on retest.
It can hit TP 1 ( most probable) and TP 2 less likely.

JPM double bottomDouble bottom with divergence on MACD, RSI and Stochastic with 61.8% Fibonacci support from the bottom of the corona crash. Compared to the index finances are looking a lot better with JPMorgan Chase & Co. and Citigroup leading the way. Breakout of falling Wedge pattern shows a great opportunity for a Long position.

FTM AnalyzeHi friends.
AN ABC correction will compelete in 38.2% retracement.
divergence between Rsi and price is clear (like i show it).
also momentum is in oversold area.
we see an volume profit support in 0.37$
and a volume profit resistance in 0.7$.
Good luck Friends.
(this isnt trade advise)

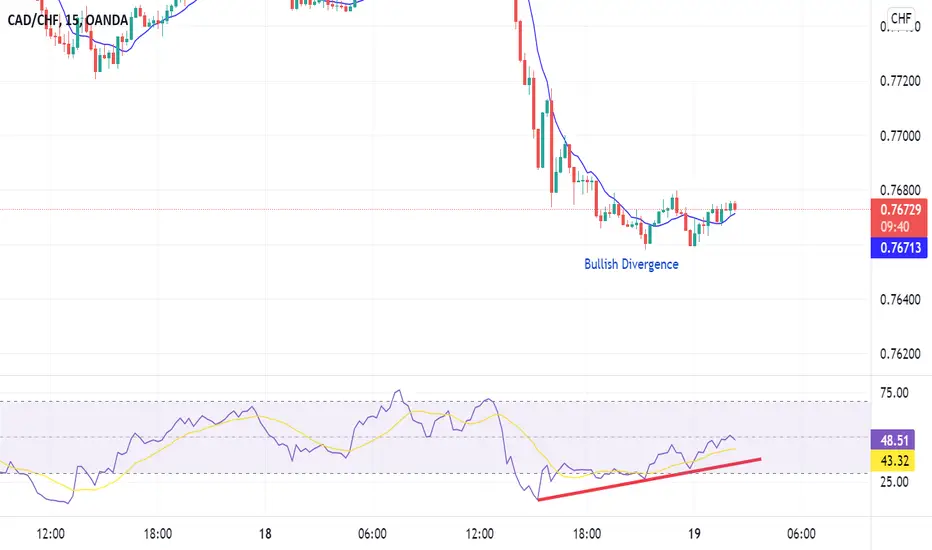
Markets to make some recovery - Buying CADCHF now Last night was a bloodbath for stock as predicted but there is an opportunity to buy CADCHF and other risk on currencies. The reason I chose this was:
1) Daily is UP
2) Oil is strong so therefore so is CAD
3) Strong divergence in M15, M30 and H1
Stop Loss is about 40 pips.
SPX temporary bottomThis could be a temporary bottom for the Market. First we have a divergence both on the Stochastic and the RSI. The price bounced of the trendline and the Fibonacci(Bottom of the Corona Crash and all time highs).And on the Weekly the price closed outside of Bollinger bands which could mean that the price is oversold in a way. But this is not the market bottom, far from it. The situation in the world is unpredictable and unstable. Another reason are the Elliot waves on the weekly chart that I posted showing where the price could go.

BTC on Track for its 8th Consecutive Weekly Loss Are We OversoldBitcoin (BTC) is on track to record losses for the eighth week in a row, the longest streak of losses in history. Before this streak, the previous biggest consecutive weekly losses were recorded in December 2014, when Bitcoin was worth just a few hundred USD and was down for five weeks in a row.
Is Bitcoin Oversold?
Despite the severe sell-off, Bitcoin is still not oversold, according to the most popular momentum oscillators. Bitcoin’s current weekly RSI reading of 33.67 shows that we aren’t oversold just yet. The RSI oscillator would need to fall below 30, or even 20, to be considered oversold.
Meanwhile, the stochastic oscillator has entered oversold readings, but unlike the RSI, it has the tendency to stay in oversold readings longer, as it is more volatile and quick to react.
By comparison, in 2014, after the record weekly losses streak, Bitcoin consolidated for 31 weeks before it resumed an upward trajectory.
Looking forward: The Bitcoin sell-off can slow down in the near future, and we might see a temporary bottom around the $30,000 considerable round number. However, in the long-term, the correction can extend all the way to $20,000, which is a massive support level since it is the all-time high reached in the 2017 bull run. A fall to $20,000 would also allow the RSI oscillator to reach oversold readings.

NZDUSD Sell opportunity to form the buying Harmonic PatternThis is a dicey trade but we are going for it.
NZDUSD is M15 double top.
There is no pattern to sell, but a pattern to buy at 0.6240.
Target 100 pips, risk is 40.

Bullish RSI Divergence - Short TermHello friends👋. Today I saw a slight divergence between the Bitcoin price chart and the RSI oscillator. I hope it is useful for some traders.

A long-overdue small-cap reboundThe small-cap Russell 2000 Index has been the underdog among the four major US indices since last year. Its post-pandemic rally halted in early 2021, and subsequently, it went sideways for more than a year without making new highs. Meanwhile, the tech darlings continued to go north all the way until the beginning of this year.
The first half of 2022 has been marked by widespread risk-off sentiment and a precipitous drop in the US equity market. After being down almost 30% from the high, we now find the Russell 2000 Index at significant technical support levels that we believe a meaningful rebound will likely ensue.
The Index has bounced right at the 50% Fibonacci retracement level near 1700. We also observed bullish RSI Divergence where price made lower lows, but RSI showed higher lows, suggesting the bearish momentum is waning and at the cusp of a reversal.
Entry at 1806, stop above 1680. Targets are 1880 and 2100.
Disclaimer:
The contents in this idea are intended for information purposes only and do not constitute investment recommendations or advice. Nor are they used to promote any specific products or services. They serve as an integral part of a case study to demonstrate fundamental concepts in risk management under given market scenarios.

Buying EURGBP on RSI Divergence (Stocks will go down)EURGBP usually moves up when stock indexes come down. (Don't ask me why, it is just an observation).
We are seeing the pair consolidating and oversold on H1, M30 and M15. Nice double bottom coming into play.
Stop loss will be tight at 30 pips. Looking for a 90 pip ride up.

BTCUSDT anatomy of a bulltrap / double top formation up-to-dateBTCUSDT anatomy of a bulltrap
* Heikin Ashi bearish;
* Show of weakness on volume / institutionals sell-off;
* RSI (overbought), Awesome, Chaikin Money Flow, all bearish triggering;
* Moonbois triggering;

Looking for EURCHF Long Opportunity EURCHF is still in the uptrend despite a sharp fall today.
There is a harmonic pattern shown in the diagram.
We are seeing strong reversal signs and looking to go long around 1.0380 and target 1.0430 for 50 pips.
