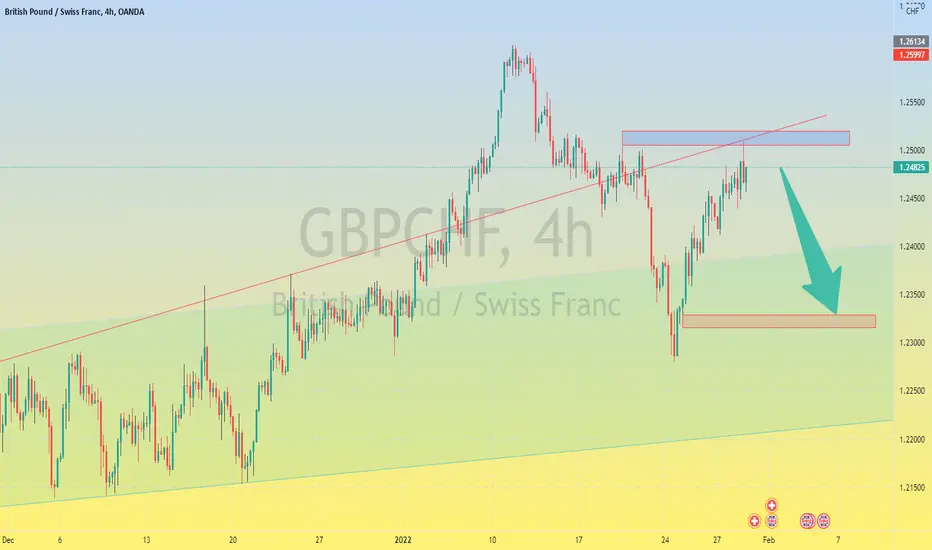
GBPCHF WAITING FOR DOWNTREND CONFIRMATION✅Price has bounced off 61.8 retracement level and ascending trendline. RSI & MACD bearish divergence suggests a bearish move towards the highlighted support.
Breaking the support and holding below it will shift the trend to bearish and the price could rally down to break the ascending lower trendline.
A break above the resistance will resume the uptrend towards 1.260 initially.
Rsi_divergence
BTCUSD - H1 - RSI bearih divergence !Bearish divergence on hourly chart !
Short term trend reversal in progress
Ironman8848 & Jean-Pierre Burki

Bitcoin breaking local resistanceAfter the recent dip down to 39650 USD, Bitcoin is now showing some signs of temporary reversal with expected targets in the range of 45500 to 46500 USD.
This is supported as well by the bullish divergence on the RSI from the low of Dec 21 during the crazy flash crash and the recent low.

DOTUSDT DAILY FIB + RSIOn the basis of fib channel magic, I've pointed the best entry points and tps. Also RSI is in a veryyyyyyy suitable area for long.

Have you noticed that bullish divergence on BTC?This morning I was doing my usual TA and I noticed that interesting bullish divergence..
What do you think?

LinkusdtBased on the downtrend as well as the selling pressure, the downside is more likely, if it loses the second red support, it means that the uptrend is over, so it will be in the range for a long time.

Aditya Birla Fashion Retail Limited ABFRL broke its all time high with good volumes. The stock is Rs55, Ars and Srs positive. Yet it shows a negative rsi divergence which is of concern. Instead of adding more position i have sold some. I feel a trend reversal is in coming.

RSI hidden divergence on WeeklyBitcoin weekly chart shape RSI hid divergence
Can going to the line on next week?

XAUUSD bullish shark pattern approved by RSIHi everyone, I'm happy to present you my first idea posted on this platform. It consist in a buy setup on gold based purely on advanced technical analysis
Considering the fact that this bullish harmonic(shark) was formed within the bullish trend: it is highly probable that price will form an other leg up straight away to ,at least, 1814 lvl which is 618 fibonacci.
Moreover after noticing that RSI confirm this pattern and looking at the bullish candlestick pattern (pinbar)
I guess second entry(when moving average cross bullish) is safer but the first entry can give a higher Risk:Reward ratio
It is wise to choose one of these opportunity, or even taking both after keeping in minds the elements enonced above

AWC is "On Time" for a move upThis one to me looks great on multiple timeframes with technical's and price indicating evidence of bottoming with another move higher.
Short term conditions -
Long term conditions -
My stop is 1 ATR below the .618 level and target is 2.20which represents a very good risk to reward ratio of 1:5 at current levels.

DOTUSDT great opportunity to buy!!!!!DOTUSDT is in a strong support range, which is in its long-term trendline position and strong support below it, and also in this
position, it has created a positive divergence in RSI.
Based on this and the resistance ahead and Fibonacci, the following targets can be considered
tp1:50
tp2: 75
tp3:105
sl: any daily candle close below trendline

Are WTI crude oil prices topping?WTI crude oil prices are showing negative RSI divergence on a test of resistance marked by an inflection area in play since July 2018. This hints that upside momentum may be fading, with a turn lower to follow.
A break below support anchored at 72.52 may expose the 70.00 figure. Alternatively, breaking resistance at the 77.00 mark might open the door for another challenge of 79.60.

IP | Falling Wedge Reversal| MFI Divergence | Elliott 4th Wave?IP | Thailand SET Market | Price Action Trading | Elliott Wave Tracing
Chart Pattern: entering Falling Wedge Reversal Pattern
Price Action: Downtrend area of consolidation
Entry Position: Buy on BREAKOUT of FALLING WEDGE
Indicator:
> MFI - Money Flow Divergence - Banker accumulation phase
> RSI - Sideway up below 50
> MACD - Golden cross below baseline 0
Trust SYSTEM & INDICATOR | Never panic trade
Trade affordable RISK | Ratio 3:1
Always respect STOP-LOSS
Good Luck

USDINR Bounce Incoming!USDINR has been bouncing off a long rising trendline since early 2021, and in fact has seen what you could reasonably call a clear uptrend on the larger timeframes since 2008.
On the 12H chart and virtually all lower timeframes we're seeing oversold RSI reading, either with strong divergence (higher RSI, lower price) or flattening RSI with lower price, pointing to the current corrective wave coming to an end shortly.
We've just seen price dipping in to enter the area of support representing our long trendline and seen an immediate bounce, and we have strong horizontal support just below current price.
I think price will find support from buyers in this area and a significant move to the upside is imminent.
This is not financial advice, you are responsible for your own trading decisions.
Drop and like and follow if you enjoy the idea!
Leave your thoughts in the comments below!


BD & support Hey guys hope you all well in the btc 4h chart we can see a bullish divergence in the rsi & support i opened long position a minute ago i think the btc will touch the 50200 today

LUNAUSDT shortLUNA is forming RSI divergence at 4H timeframe.
Fib Retracement levels:
0.236 - approx 88.917
0.382 - approx 81.961
0.500 - approx 76.447

Caution time or more steam left?Clear bearish divergence on daily charts. Will it respect it or continue towards 2400 levels?

Gbpjpy bearish wave upcoming -152.50 is very important price
-clear divergence (rsi)
Target: 151.00
•We not that the wave identity is corrective
•And the wave follows a wake trend
♡Have a safe trade...and nice day♡

EURCAD losing the momentum, positive CPI news might fuel bearsAfter the positive news on CPI, CAD might show some strength against the Euro. Technical analysis also support the bearish patent by forming a nice RSI divergence on H4 time frame. watch for the key levels
Enter after the breaking the level 1.4470 and targets around 1.4370 and 1.4290

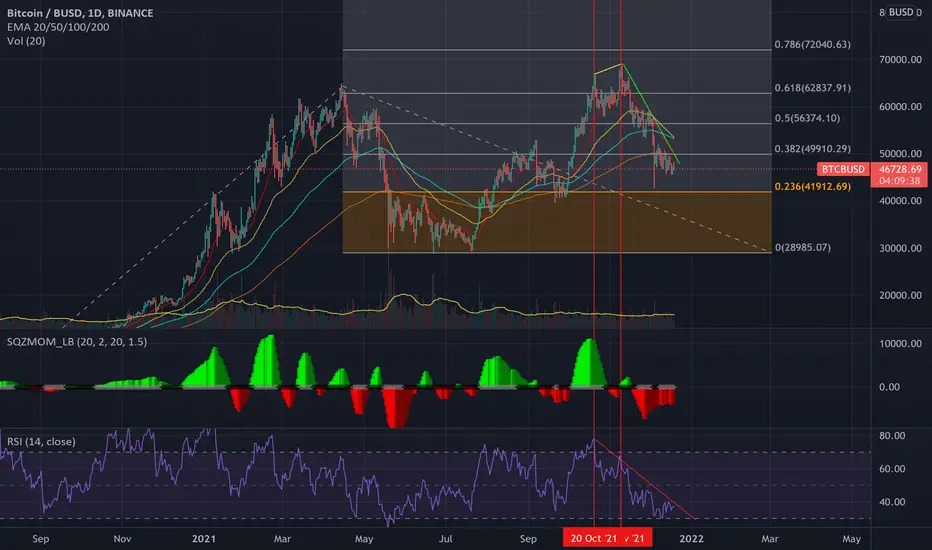
Where was I when this RSI divergence showed up?Sometimes doing backtesting resembles going over your errors in life:
once you look from afar all things make sense, all pieces fit, and it is crystal clear when and how you messed up.
It would have been so simple to just follow the signs!
Bitcoin, major Price-RSI divergence was telling us about current downtrend.
Now, where was I back then on November 9th?
Grrrr!
Still LONG BTC.
Best of trades!
Daily Update - Bullish Divergence Spotted! Jasmy Shiba ADA OXTIn this video:
* I review the indexes and corresponding price action
* For the first time in weeks, I have gone from neutral to slightly bearish to bullish in the crypto space
* For cryptos, our time living down in this bearish space is drawing quickly to an end
* I have spotted major bullish divergence on many of our charts
* We will pop soon, possibly this weekend, but I anticipate no longer than 10 days
* The next bull cycle in the altcoin space will be huge. Most will not have ever seen it coming.
* Get ready!

NZDCHF H4 Long- trendline is broken
- RSI divergence
- big volume rejection the bottom
- market risk on
Happy trading
