Risky Bearish Divergence - small scalp potential.
As you can see by the dark red snake trend and price action this symbol made a small correction during a very strong downtrend. Price just crossed the tenkan-sen and could bounce back down.
At such moments I go to a lower timeframe to look at the fractals to see if we see confirmation of price returning to downtrend. There is not yet confirmation of a downtrend and likely the price will keep going up as it made a double bottom on the daily timeframe which can result in sideways behaviour or a strong uptrend. In the case of sideways action we can be at the top of the range at the moment if we see confirmation of a forming downtrend.
However we see a very clear bearish RSI divergence on the 15 minute charts, I am hoping for the price to go down that is wy I set and alert line to notify me when it is going down. In the scenario of it starting to breaking bottom fractals in the lower timeframe after the divergence it is a good moment to make a quick scalp with a small stop loss (previous upper fractal or kijun sen) I do not expect the price to break previous bottom fractal of daily chart but it might as well do. I would be happy with a profit of 1-2%
Rsi_divergence

Is the Japanese Yen Hitting a Turning Point?A look at a majors-based Japanese Yen Index (which averages JPY against USD, AUD, GBP and EUR) shows that prices are facing key support, lows from late 2017 and early 2018.
Meanwhile, the index appears to be trading within the confines of a Falling Wedge. The latest test of the wedge floor could open the door to a near-term bounce to resistance, not necessarily overturning the dominant downtrend in the Japanese Yen.
Positive RSI divergence also shows fading downside momentum, which can at times precede a turn higher.
Keep a close eye on incoming price action for signs of a turn higher, or downtrend resumption.
1/((FX_IDC:USDJPY+FX_IDC:AUDJPY+FX_IDC:GBPJPY+FX_IDC:EURJPY)/4)

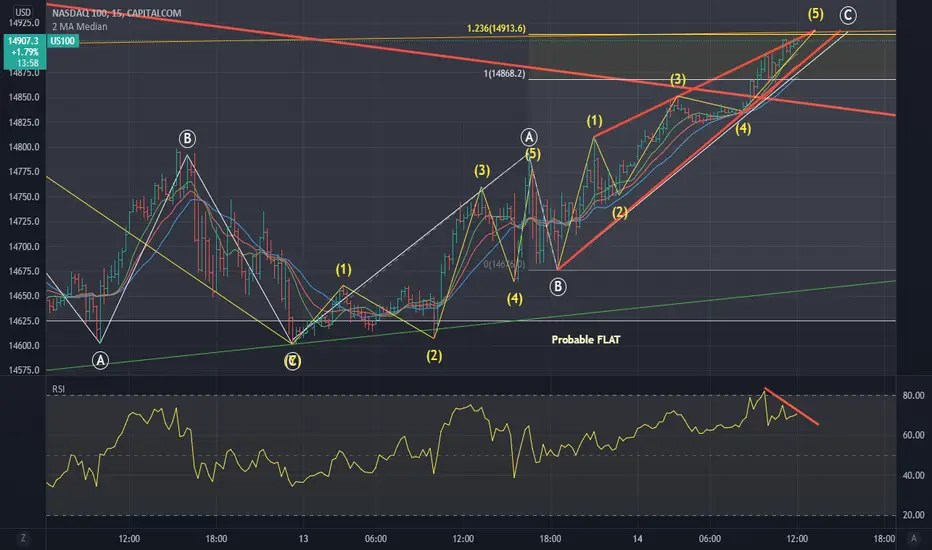
Nasdaq 15 min.Nasdaq approaching what appears to be the end of a minute C wave. Coincides with a 1.236 extension of A wave. RSI behavior seems to confirm it is in a 5 of C. An upward acceleration from these levels may signal an intermediate pause in the bear market and turn this C wave into a wave 3.
Dowejones testing last highits very clear that dowjones is going to test last high
but be carefull there rsi divergence on daily

ETH Prime and Ready: Major Nov GainZMy Fellow Crypto Traders,
Appreciate you taking the time to view my analysis which I hope you may find beneficial. Please be sure to “LIKE” if you indeed find my analysis useful and/or find my analysis intriguing.
Cheers & Happy Trading!
--------------------------------------------------------------------------------------------------------------------------------------------------------------------------------------------------------------------------------------------------
Analysis:
RSI double top, w/ negative trend, which reflects on price action as well. Possible repeat of double bottom formation @ $2800 region for support confirmation. Whales could step in @ the 200EMA (white line) level for support. As Eth respects the green upward trend line, retest of trend could be great buying opportunities. Also BB are over expanded, which is a signal for the market is over saturated. Good opportunity would be once BB flattens out and contracts at a region of support, which could be around the $2800 to $3000 region.
Good Speed, and this is not trading advice, but my opinion on market projection.

Achain in a parallel channel and future
you can see the channel that have strong R and S in up and down.
The three points on the chart are marked with squares which are the best shopping points .
That is, after the price returns and at the time of failure of resistance and support.
The target is the canal roof, which is marked with a green rectangle.
Enter as a step, observing the Stop limit of the canal floor.
Given the possibility that Bitcoin needs a correction before its historical ceiling breaks, we have a negative divergence in the indicator that eliminates the possibility of a one-time ceiling break. ( means Green way is very weak )
150 - 350 % are min and Max profit in this setup if you follow me ....

Is Bitcoin facing a potential correction in the short term?NOT FINANCIAL ADVICE
Keeping things simple, studying $BTC vs MACD vs RSI, a divergence pops out clearly on the shortterm 4H charts.
While these do not always indicate a top or a dip, it is a signal that it is usually potentially accompanies one.
Also charted are the various levels of potentiall strong resistances that may deflate bitcoin’s current rally. These are based off the previous peaks preceeding selloffs, with the Major Resistance being bitcoin’s ATH.
If we are to analyse the volume trend, we can see that there’s a slight upslope of interest in trading which may be indicate that this rally may not yet be over — that the Minor and Primary resistances may be just a breather for the Bulls to regain their strength back.
In summary, I’d surmise that it’s still not too late to get on the $BTC train. Wait for the dip, accumulate, and prepare to take profits as and when signs of weakness are showing during rallies.
I do feel that retesting of ATH is incoming, but I won’t be surprised if the corrections are coming sooner than later, in this journey.
Again, not financial advice — just an educational tool.

NIFTY 50 SHOWING A NEGATIVE RSI DIVERGANCE. On a daily chart, Nifty 50 has shown a negative RSI divergence which can indicate towards a trend reversal. Maybe the markets are looking for a small correction after a stellar up move.
Please trade carefully.

BEST INDICATORS SETTING ..
this is the best indicators setting for all time frame that I found to get the best results and profits :
1- EMA ( 7 open, 8 close, 100 close0
2- RSI Columns 8
3- MACD crossing background 13,26,5
4- colored candles signals
WITH DAILY TIME FRAME
WITH 2 H

Wait a second before making any dealhello traders ,
I was looking at the dominances and I just saw an interesting thing ,
look at the BTC.D , yeah it's true that the price bearish trendline in broken , but RSI trendline shows another thing , it has been rejected hardly .
Also , as you see in TOTAL , , price is exactly under a strong bearish trendline , and the same in RSI , and there is a very long and strong bearish trendline in RSI .
and just look at the USDT.D , , it is just above a strong and very long bullish trendline in price chart , and also there is a bullish trendline in RSI .
And if we look at the TOTAL2.D , , It's so close to the bearish trendline .
Personally, I think BTC will go a little higher from this and it will be rejected from the purple resistance, meanwhile , I think ETH and TOTAL2 will grow until they hit the trendline and they will be rejected .
Tell me about your opinion in comments .
Thanks for like and follow

Hasani Homework - Hidden Divergence GBPAUD on 4hr TFFinding hidden divergence (backtest 10/2016) on GBPAUD on 4HR Time Frame.

Hasani Homework - Hidden Divergence GJ Daily TFFinding hidden divergences on GBPJPY on the Daily Timeframe

EM possible switch from bearish to bullish from MACD and RSI?EM possible switch from bearish to bullish from MACD and RSI upticks.
Red verticle lines placed on 1D lower lows.
Green verticle lines placed on 1D lower highs.
MACD is possible to cross over into positive territory.
PT from multiple groups of ~$13USD.
NASDAQ:EM

Bearish Divergence 4H When looking at the 4H timeframe we can see quite strong bearish divergence. I have included prior instances of both bearish and bullish divergences. With this bearish divergence I would expect BTC to revisit the .786-.618 fib levels between 42.4K-44K. Divergences almost always hold true even if they take a little longer to play out. I would certainly not FOMO into a long position here with such strong bearish divergence evident on the chart.
Thank you for viewing my post!

Divergence on GBPUSDGU has been in a downtrend for almost a month now. I see it going back to the 1.34 (major psychological level) zone. The hourly timeframe shows an RSI Diverge that can be used as an entry point.
Hope you can catch some good pips in this operation

XRPUSD- Understanding how stochastic is formed is one thing, but knowing how it will react in different situations is more important. For instance:
Common triggers occur when the %K line drops below 20—the stock is considered oversold, and it is a buying signal.
If the %K peaks just below 100 and heads downward, the stock should be sold before that value drops below 80.
Generally, if the %K value rises above the %D, then a buy signal is indicated by this crossover, provided the values are under 80. If they are above this value, the security is considered overbought.
- It's helpful to note there are a few well-known ways to use the MACD:
Foremost is the watching for divergences or a crossover of the centerline of the histogram; the MACD illustrates buy opportunities above zero and sell opportunities below.
Another is noting the moving average line crossovers and their relationship to the centerline.
Integrating Bullish Crossovers
To be able to establish how to integrate a bullish MACD crossover and a bullish stochastic crossover into a trend-confirmation strategy, the word "bullish" needs to be explained. In the simplest of terms, bullish refers to a strong signal for continuously rising prices. A bullish signal is what happens when a faster-moving average crosses up over a slower moving average, creating market momentum and suggesting further price increases.
In the case of a bullish MACD, this will occur when the histogram value is above the equilibrium line, and also when the MACD line is of greater value than the nine-day EMA, also called the "MACD signal line."
The stochastic's bullish divergence occurs when the %K value passes the %D, confirming a likely price turnaround.
ATH IS YOUR 1ST TARGET/HURDLE, TARGETS ARE THERE IF YOU LOSE SUPPORT AS WELL.
source*
www.investopedia.com

BTC is trying to get DIVERGENCE for BULLISH on 4H TimeFrameAs I said at 1D Timeframe, 4H TF is forming a growth divergence in RSI and LOW PRICE ( on chart )
PS: I am big fan of divergence

RSI Divergence SMALL SPIKE example
Hey, i found this SMALL Divergence then a breakout. When happens right after a key level on the Fib Lines of the GANN. I wish I spotted this trade when it happen. Wanted to post it what happens when the 14 and 30 periods of the RSI -mtf happens.

C98 RSI Bullish DivergenceC98 has been in a downward trajectory lately. The bear's momentum has been diminishing as price goes down and this calls for a trend change.
The RSI is forming higher lows while price forms lower lows. This is a clear Bullish Divergence which signify trend reversal at some point in time.
C98 is currently at demand area. If the demand area is broken and a 4HR candle closes below, we may head lower before potentially going bullish towards ATH. This gives us enough room to buy at lower price levels.
This is a 1:7 Risk/Reward trade.
Goodluck guys!!!

CADJPY As you know cad has high correlation with oil and right now oil are indecisive (short in my opinion)
-CADJPY Higher timeframe shows us downward move.
-Divergence+
-short senario : it moves inside triangle
-long senario : it moves inside parallel channel
in any direction it moves we can open multiple positions (pivot touches rule)

$REAL Nice Put positionPUT REAL OCT 15th 0.55 71.99% -31.73 0.14
Gamma and Delta look good for this at 55 cents. Implied volatility is 72% . The signals are set up well and the sloan ratio is -37 indicating consistent negative reporting cycles in financials.

Tezos looking goodBullish on XTZUSDT?
1) Triangle formation on resistance
2) Flag on RSI, no divergence yet
3) Bitcoin warming building up at resistance
Today or tomorrow is gona be an interesting day for crypto market
Have a good trading day and Let me know your thoughts below.
Cheers

SOFI - Long Period of Consolidation - Breakout Imminent sofi
SOFI - a lot of momentum in the business with a bank charter around the corner, new president, football stadium, and more. This stock looks ready for a significant move to the upside. I could potentially see one wave lower to the green demand box, but with the 4hr divergence, decided to go ahead and jump in. Long shares of SOFI.
Target $40+
