Rsi_divergence


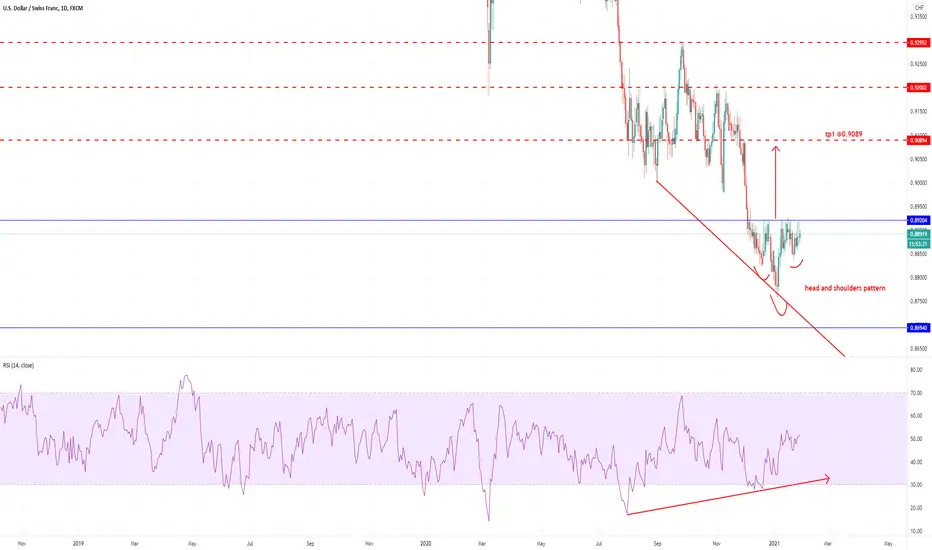
usdchf swing longdaily analysis rsi divengence with head and shoulders pattern on daily time frame wait neck line to be broken then buy
you may also buy from current price
HEROMOTOCORP possible upside movedo follow the trend
this is not a call
market is supreme
if it breaks the trendline then wait for it to retest and then short it
happy trading


PTON ShortRSI divergence
Might form double top
Short 160
stop 175
Target1 140
Target2 120
I am not a PRO trader. I trade option to test my trading plan with small cost.
The max Risk of each plan is less than 1% of my account.
If you like this idea, please use SIM/Demo account to try it.

BIDU NeutralWeekly resistance at 270
RSI divergence
EMA20 Bollinger Band Upper band
There might be a consolidation
between 210 and 110.
Sell Iron Condor -- limit 6.3 (Credit)
SellToOpen Mar Call Spread C260/270
SellToOpen Mar Put Spread C200/210
Get Theta 2.04 per day
$10 range,
max profit 6.3,
max risk 3.7,
Reward:risk= 1.7:1
I am not a PRO trader. I trade option to test my trading plan with small cost.
The max Risk of each plan is less than 1% of my account.
If you like this idea, please use SIM/Demo account to try it.

BULLFLAG! ATH NEARINGAnother Bullflag just appeared. if this breaks out. I'll see the ATH very close.

ROKU ShortRSI divergence
Short 420
stop 430
Target1 360
Target2 320
I am not a PRO trader. I trade option to test my trading plan with small cost.
The max Risk of each plan is less than 1% of my account.
If you like this idea, please use SIM/Demo account to try it.

PENN NeutralRSI divergence
EMA20 Bollinger Band Upper band
There might be a consolidation between 90 and 110.
Sell Iron Condor -- limit 6.2 (Credit)
SellToOpen Mar Call Spread C110/120
SellToOpen Mar Put Spread C80/90
Get Theta 2.34 per day
$10 range,
max profit 6.2,
max risk 3.8,
Reward:risk= 1.63:1

Strong Bearish Divergence
Strong bearish RSI divergence on 4hr
If candle closes in a shooting star I expect mega correction
Remember however BTC is the boss and does what it wants to, this bull run IS NOT over whether it corrects now or not. BTC has easily been breaking RSI patterns and it may do it now. just be prepared for either way it goes, but if shooting star closes, I'm shorting in the short term
Let me know what you guys think!

What does $LTC.X have in store for us?Hi Community,
After a dramatic drop, Litecoin rebounded at the 112$ price level. Since then, it failed twice to break through the 150$ level twice. We have already seen that pattern before, and the RSI bullish divergence is a positive sign.
Where do you think LTC will go next?
Still learning here, so any constructive feedback and positive vibes are welcome.
Thank you and Happy trading!
------------------------------------------------------
Needless to say, this is not financial advice!

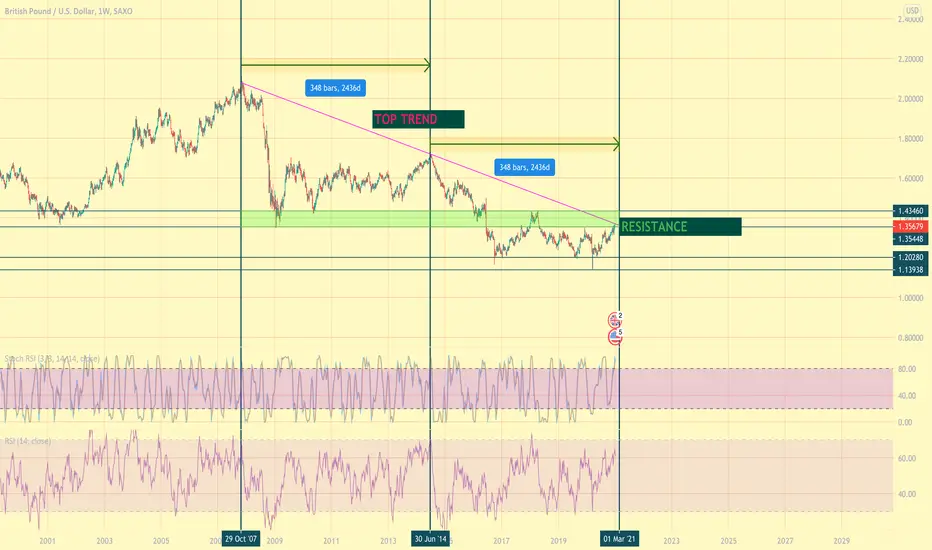
GBP/USD History Repetition? An interesting situation. It took 2436 days for the 2017 highs in October to find a bottom and then reach a new high. If history is to repeat itself, we are on a cusp of another breakdown here.
In support of this idea:
-The price has reached the resistance/prev support levels
- Has reached and began to pull away from the 'Top Trend' (as show in the snapshot provided)
- Weekly Stoch RSI looks ready to tumble down
-DXY looks to have reached its bottom and can see growth for the next few weeks
SPX's RSI structure & divergences are to watch very v.v. closelyBelow 60 reading HIGH ALRET.
wish u alll the best.

ETHUSD correction imminent? Bearish RSI divergenceETHUSD is showing a clear RSI divergence which usually indicates a price correction is imminent. I would welcome if the ETH price gets a healthy correction since current increase is not sustainable in my opinion.

CRM Long Bullish Divergence & 200 EMA SupportI think the title explains it well enough. Seems like reasonable support with some bullish divergence on the RSI.
Happy trading!

BTCUSD and RSI In an Uptrend* In an uptrend BTCUSD finds support between approximately 40 - 50 RSI level
* Might see RSI bullish divergence that would signal a continuation of the larger trend

AUDUSD DAY price reversal pinbar sellHello Traders. AUDUSD DAY price reversal pinbar and rsi divergence.
Opportunity comes down to the important support zone.
If you find this analysis useful, please support me with your likes and comments.
If you have another analysis at this pair, please share in comments.
Good luck.

IOST/BTC bullish divergenceThis pair has known a significant correction during the past two years.
On the weekly and daily timeframes, RSI clearly shows the pair is oversold. On the daily timeframe we observe a bullish divergence between the signal and RSI.
The price could reach the previous resistance level at 34/36 sats.

SXP can bulls win this time?Hello
I have spotted bullish divergence on SXP, bears made a lower low with less strength.
With current market conditiosn I think price should recover a bit (1-1.5 X).
IN such dynamic market I reccomend to not use leverage just spot.
Good LUCK
This is not financial advice. It is only for fun.
