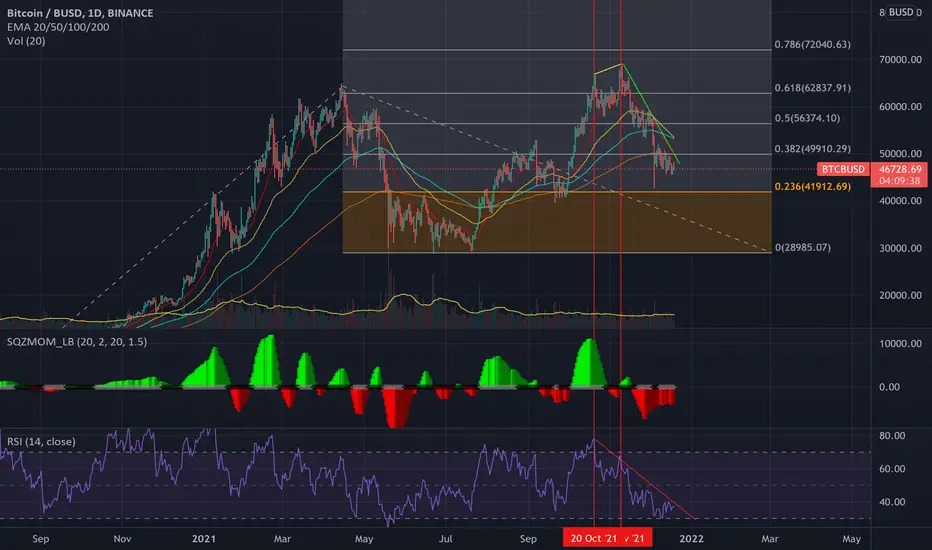
Descending Triangle BTCDescending Triangle BTC 1D:
Chart pattern forming Descending Triangle
- Volume Weakening
- MACD trend downwards
- RSI descending trend line, yet to retest support at 30
Breakout bearish will result in a retest major support at 4200
Breakout bullish could retest major resistance at 5200
Note: BTC.D is also at a major support at 40% which could trigger a sell off and gain more market dominance (see link for related idea)
Rsidivergence

$KEEPUSDT - RSI divergence, correction aheadHello everyone,
There is a strong RSI divergence for KEEPUSDT hence waiting for a slight correction here and an uptrend to 0.7450 and 0.7870
Best of luck with your trades!

How to send Divergence signals to your Discord server- Do you have a Discord server set up for your own trading community?
- Do you use divergences as part of your trading strategy?
- Would you like to send automated notifications to your Discord server whenever a divergence appears on any chart?
If you have answered yes to all 3 questions above, please keep on reading.
The easiest way to receive automated Divergence alerts to your Discord server, is to combine the alert messages from "The Divergent" divergence indicator on TradingView with a Webhook endpoint on your Discord server.
Step 1: Open Discord, and go to Server Settings
Step 2: Go to Integrations and create a new Webhook
Step 3 (optional): Rename your Webhook to "The Divergent (Divergence indicator)"
Step 4: Select the channel you wish to receive the divergence signals to (i.e. #divergence-signals)
Step 5: Save your Webhook
Step 6: Copy your Webhook URL to your clipboard and head over to TradingView
Step 7: Apply "The Divergent" or "The Divergent (Pro)" indicator to your chart and configure it as you prefer (The free version of The Divergent can signal Regular Divergences only, while the Pro version can signal both Regular and Hidden Divergences)
Step 8: Create a new alert, select "The Divergent" from the top drop down and select one of the Divergence signals (i.e. Regular Bullish)
Step 9: Use the Webhook URL from your clipboard as the Webhook URL of the alert
Step 10: Use the following alert message:
{"content": "The Divergent detected a Regular Bearish Divergence (RSI) on {{exchange}}:{{ticker}} ({{interval}}) @TradingView #divergence $BTC "}
Sample message delivered on Discord:
"The Divergent detected a Regular Bearish Divergence (RSI) on BINANCE:BTCUSDT (60) @TradingView #divergence $BTC"
Feel free to change the content to match your chart / type of divergence you are signalling in the alert.
Note : It is important that you format your alert message as a JSON string, and that you key the message with "content". If you have never used JSON before, it is a good idea to validate your message via jsonlint.com to make sure it is a valid JSON string.
Repeat the same steps for other charts / divergences. Create as many alerts, as many markets / divergences you want to signal to your Discord server.
If you have any questions, please feel free to post it in the comments section below.
If this tutorial was helpful to you, please consider giving it a thumbs up!
Thank you!

LUNAUSDT bearish divergence/ W pattern-bearish divergence: There is a bearish divergence on the chart of LUNA. There is a higher high on the price chart and a lower high on the RSI, wich means ther is a bearish divergance. The resistance is on 95.8 and is currently being tested. If the resistance breaks, the price will probably going down and retest the 50 EMA (red line) or thetrend will change from upp trend to a down trend.
-W pattern: there is a W forming on the 4 hourly chart. With the dubbel bottom at 95.8 and the top at 99,4.
So there are 2 options that coud play out.

LUNAUSDT shortLUNA is forming RSI divergence at 4H timeframe.
Fib Retracement levels:
0.236 - approx 88.917
0.382 - approx 81.961
0.500 - approx 76.447

BANK OF BARODAHello and a warm welcome to this analysis on Bank of Baroda
In daily time frame it has made a Bullish Harmonic Gartley and in hourly it has made a Bullish Regular RSI Divergence.
Both suggesting a pullback till 85-90 as long as it does not breach 78.25

Where was I when this RSI divergence showed up?Sometimes doing backtesting resembles going over your errors in life:
once you look from afar all things make sense, all pieces fit, and it is crystal clear when and how you messed up.
It would have been so simple to just follow the signs!
Bitcoin, major Price-RSI divergence was telling us about current downtrend.
Now, where was I back then on November 9th?
Grrrr!
Still LONG BTC.
Best of trades!
CRV Scalping 3Taking profits at the RSI divergence is always a good idea.
Long entry set-up still not in play

The easiest way to use divergences in your own Pine strategiesDetecting divergences in a Pine indicator / strategy is easy.
You simply have to compare the pivot lows and the pivot highs on the price and the oscillator, and if you can identify a difference between the last & previous pivots made on the price and the oscillator, you have likely found a divergence.
Using this theory, here is an example how you would detect a Regular Bearish divergence:
While the theory of divergence detection is simple, more often than not, things go wrong (the divergence indicator used in the example below is TradingView's built-in Divergence Indicator ):
Would you identify this as a divergence? If not, why not? Is it because the divergence line is slicing through the candles? Or because the line is slicing through the oscillator? Or something else?
Wouldn't it be great if somehow you could filter out invalid divergences from code, such as this one?
We at Whitebox Software were wondering about the same thing, and decided to find a solution to this problem. This is when we realised that while detecting divergences is easy, detecting valid divergences is hard...
After several months in development, we are proud to present to you our divergence indicator called The Divergent .
The Divergent is an advanced divergence indicator with over 2500 lines of Pine Script, exposing over 30 different configuration options, including 9 built-in oscillators, to allow you to tweak every aspect of divergence detection to perfection.
For example, the Line of Sight™ filter in The Divergent would have easily filtered out this invalid divergence above. The Line of Sight™ filter will notice any interruption to the divergence line connecting the price or the oscillator, and will treat the divergence as invalid.
This filter is one of many, which has been created to reduce the false positive detections to a minimum. (In later publications, we will discuss each and every filter in detail).
Alright, so The Divergent knows how to detect accurate divergences, but how is it going to help you detect divergences in your own Pine strategy?
The Divergent is not simply a divergence indicator - it can also emit divergence signals * which you can catch and process in your own strategy. You can think of The Divergent being a DaaS ( D ivergences a s a S ervice)!
* Please note, that divergence signals is a Pro only feature.
To use the signals, simply place The Divergent onto the same chart you have your strategy on, import "The Divergent Library" into your code, link your strategy to The Divergent using a "source" input, and act on the signals produced by The Divergent !
Here is a simple strategy which incorporates divergence signals produced by The Divergent in its entry condition. The strategy will only open a position, if the moving average cross is preceded by a regular bullish or bearish divergence (depending on the direction of the cross):
//@version=5
strategy("My Strategy with divergences", overlay=true, margin_long=100, margin_short=100)
import WhiteboxSoftware/TheDivergentLibrary/1 as tdl
float divSignal = input.source(title = "The Divergent Link", defval = close)
var bool tdlContext = tdl.init(divSignal, displayLinkStatus = true, debug = false)
// `divergence` can be one of the following values:
// na → No divergence was detected
// 1 → Regular Bull
// 2 → Regular Bull early
// 3 → Hidden Bull
// 4 → Hidden Bull early
// 5 → Regular Bear
// 6 → Regular Bear early
// 7 → Hidden Bear
// 8 → Hidden Bear early
//
// priceStart is the bar_index of the starting point of the divergence line drawn on price
// priceEnd is the bar_index of the ending point of the divergence line drawn on price
//
// oscStart is the bar_index of the starting point of the divergence line drawn on oscillator
// oscEnd is the bar_index of the ending point of the divergence line drawn on oscillator
= tdl.processSignal(divSignal)
bool regularBullSignalledRecently = ta.barssince(divergence == 1) < 10
bool regularBearSignalledRecently = ta.barssince(divergence == 5) < 10
float slowSma = ta_sma(close, 28)
float fastSma = ta_sma(close, 14)
longCondition = ta.crossover(fastSma, slowSma) and regularBullSignalledRecently
if (barstate.isconfirmed and longCondition and strategy.position_size == 0)
strategy.entry("Enter Long", strategy.long)
strategy.exit("Exit Long", "Enter Long", limit = close * 1.04, stop = close * 0.98)
shortCondition = ta.crossunder(fastSma, slowSma) and regularBearSignalledRecently
if (barstate.isconfirmed and shortCondition and strategy.position_size == 0)
strategy.entry("Enter Short", strategy.short)
strategy.exit("Exit Short", "Enter Short", limit = close * 0.96, stop = close * 1.02)
plot(slowSma, color = color.white)
plot(fastSma, color = color.orange)
One important thing to note, is that TradingView limits the number of "source" inputs you can use in an indicator / strategy to 1, so the source input linking your strategy and The Divergent is the only source input you can have in your strategy. There is a work around this limitation though. Simply convert the other source inputs to have a string type, and use a dropdown to provide the various sources:
string mySource = input.string("My source", defval = "close", options = )
float sourceValue = switch mySource
"close" => close
"open" => open
"high" => high
"low" => low
=> na
---
This is where we are going to wrap up this article.
We hope you will find the signals produced by The Divergent a useful addition in your own strategies!
For more info on the The Divergent (Free) and The Divergent (Pro) indicators please see the linked pages.
If you have any questions, don't hesitate to reach out to us either via our website or via the comment section below.
If you found value in this article please give it a thumbs up!
Thank you!

$BTC 12h RSI trendline retesting breakoutBollinger bands are retracting and the RSI on the 4h is diverging, potential breakout here to retest resistance around 52k trendline

NZDJPY - Head and ShouldersDepends on how you read your Head and Shoulders. I'm waiting for the right shoulder to form at 76.26, which is near the zone of a Bullish Shark Pattern in the 1-hourly chart.

Time to Buyshowing good rsi divergence in 1H and 4H time frame.
take profit along the way and move your SL accordingly

Potential BTC Bounce OpportunityAlthough things have not been looking great for bitcoin these past few days, it looks like there is a possibility for a reversal over the next few days based on the current trend.
For the past few months, a falling wedge has been forming (dashed green lines) for BTC inside of a larger wedge (dotted blue lines) which looks like it might be in the form of an ascending triangle pattern (both of which are bullish patterns) which may bounce around the 61.8% Fibonacci retracement level from the latest high.
The bullish pattern looks further confirmed by three touches on RSI (dotted yellow line) indicating hidden, bullish, continuation divergence. If there is indeed a reversal, there is a possibility for a bounce out of the inner wedge toward the top of the outer triangle which would potentially form a cup and handle pattern if it continues to play out upward.
However, I should note that if the outer triangle breaks downward (which is quite possible based on other trends such as the S&P or QQQ), then I would imagine further downtrend is in the realm of possibilities.
It should be interesting to see how it plays out over the next few days and indeed feels like a somewhat trepidatious trade, however, I always feel like those moments are often the best times to make a move. But please take caution is all I can say.
That being said, as always, this is not meant in any way as financial advice and is only my opinion, but please like or comment if you agree or have any further thoughts.

ONTUSDT (Future) (Short)in 1 Hour time Frame
-All points are marked in the chart
-The bearish is clear
-Determining the entry point based on the break of the trend line in the RSI indicatore.
-There is a Hidden Divergence Bearish ( RSI Indicator).
-A support area is also seen in the RSI Indicator.
*Targets:
Due to the market turmoil, several targets have been indentified and saving must be required.
-profit: 10%
+Disclaimer
This is not financial advice.
The content of this analysis is subject to change at any time without notice.

$CRO Divergence on D timeframe.✅COINBASE:CROUSD
Before we start to discuss, I would be glad if you share your opinion on this post's comment section and hit the like button if you enjoyed it.
Thank you.
Possible Targets
➡️ Test support line
➡️ Forming divergence on RSI - D timeframe
➡️ Last impulsive move up to 1.20$ by end of Bull cycle
Hope you enjoyed the content I created, You can support with your likes and comments this idea so more people can watch!
Disclaimer: Please be aware of the risks involved in trading. This idea was made for educational purposes only not for financial Investment Purposes.
Don't forget sub and join my channels under this idea!


EURUSD-Weekly Market Analysis-Dec21,Wk1On the Daily and 4-Hourly Chart, the EURUSD has displayed a Bearish Trend and on the 1-Hourly, an Uptrend. This is my prefered setup as I could potentially sell at the High and exit when the price went lower.
I'm waiting for a retest at 1.1322 or preferably a Double Top with an RSI Divergence to engage the trade.

update idea !!!we can update last analysis by this analyse.
support line extended and in this analysis use normal chart (non logarithmic).
2 rule can set. if break resistance line and pullback we can long on it and if resistance line worked the 5 wave confirmed and after break support line we can use short.
see macd and rsi resistance line !!!!!! can create a new bearish divergence.
%%%%%In the previous analysis you could get at least 7% in short.%%%%%%
wait for chart .

Is it time to invest in China?KWEB is a China technology based ETF.
Top 10 holdings by weight:
Tencent Holdings ~ 10.62%
Alibaba Group Holding ~ 10.32%
JD.com ~ 7.21%
Meituan ~ 6.99%
Pinduoduo Inc ~ 6.97%
NetEase Inc ~ 4.71%
Baidu Inc ~ 4.27%
Bilibili Inc ~ 3.83%
Trip.com Group ~ 3.82%
JD Health International ~ 3.32%
Fundamental Analysis
China’s stock market pullback this year has been in line with the average annual drawdown (approximately 30%); historically, this volatility has tended to produce double-digit annualized gains.
In terms of seasonality, over the past 20 years, October has been amongst the strongest months for the Chinese stock market.
Technical Analysis
The 50sma has been tested as resistance 3 times before. A breakout above the 50sma could signal a significant change in trend.
The RSI has shown a positive divergence, as the last three times, we tested the horizontal line (blue arrow), in each case RSI is showing higher lows.

USDJPY Bearish DivergenceOANDA:USDJPY
Bearish divergence is apparent at RSI on increase in price which shows weak momentum.
If price is unable to make higher high, then trend reversal is confirmed. In that case, my first target will be between 0.5 and 0.618 Fib level on 1H timeframe.
Please support the idea and comment below.
Thanks and Good luck.


USDJPY - Head and Shoulders PatternUSDJPY is one of the rare charts that has all three Major timeframes, namely the Daily, the 4-hourly and the 1-hourly chart in Bullish Trend.
While the 4-hourly chart has a Bearish Head and Shoulders setup, at this moment the structure holds.
Trend Traders or traders who are looking for a buying opportunity can wait for a Double Bottom with RSI Divergence forms at the projected completion of Head and Shoulders to engage the trade.

Double Top Retracement ZoneIf you are a Double Top trader, you would know that it is not about the strategy but where it was formed.
One of the struggles that traders have is, "Where is the end of the Double Top Pattern?"
There are ways you can learn to identify the potential completing zone or you can wait for the Double Top to complete.
Yeap, "Wait for it!!"
You can then look for a shorting opportunity when the market passes 61.8% retracement and does not close above the 100% mark, in short, previous high/ violating the previous high.
In this case, the first target would be the immediate low. I will exit the trade on the candle body and not at the lowest wick.
Leave some tips for the waiter right?
Another important filter I will need to have is an RSI Divergence.
This will be something I will be creating, 1) A Weekly Education Content and at the end of the trading Week, a meet the trader session and LIVE discussion on the topic of the week.
What do you think?
