Deep Dive Into Relative Strength Index (RSI)The Relative Strength Index (RSI) is a momentum oscillator developed by J. Welles Wilder Jr. that measures the speed and magnitude of price changes.
Introduction
In the world of trading, timing is everything — and few indicators have stood the test of time like the Relative Strength Index (RSI). Introduced by J. Welles Wilder in 1978, the RSI is a momentum oscillator that helps traders evaluate the strength and speed of price movements. Whether you're trading stocks, forex, or crypto, understanding how RSI is calculated and how to interpret its signals can give you a critical edge.
In this article, we’ll break down exactly how the RSI works, explore its formula, and dive into practical ways you can incorporate it into your trading strategies. From spotting potential reversals to identifying overbought and oversold conditions, the RSI remains a cornerstone of technical analysis — but only if you know how to use it properly.
Let’s explore the mechanics and the mindset behind this powerful indicator.
What Is RSI and How Is It Calculated?
The Relative Strength Index (RSI) is a momentum oscillator that measures the speed and change of price movements over a defined period. It outputs a value between 0 and 100, which helps traders determine whether an asset is overbought or oversold.
The default RSI setting uses a 14-period lookback window and is calculated with the following steps:
🔷Calculate the average gain and loss over the last 14 periods:
Average Gain = Sum of all gains over the past 14 periods / 14
Average Loss = Sum of all losses over the past 14 periods / 14
🔷Compute the Relative Strength (RS):
RS = Average Gain / Average Loss
🔷Apply the RSI formula:
RSI=100−(100/(1+RS))
The result is a single number between 0 and 100 that indicates the asset's momentum.
How to Use RSI in Trading Strategies
⚡️Overbought and Oversold Conditions Strategy
RSI > 70 typically signals that an asset may be overbought and due for a pullback.
RSI < 30 suggests the asset might be oversold, potentially primed for a bounce.
However, these levels aren’t absolute sell or buy signals. In strong trends, RSI can stay overbought or oversold for extended periods.
📈Long Trading Strategy Example:
1. Identify the major trend, to find the long trades it shall be uptrend. On the screen below you can see 1D time frame for BITMART:BTCUSDT.P .
2. Move to lower time frame (in our case 4h) and find the moment when RSI falls below 30. This is our oversold condition and we are going to look for long trade.
3. Find the local support zone and open long trade.
4. Take profit when price reaches resistance level next to the previous swing high
5. Don’t forget to put initial stop loss when enter position. The best stop loss which will give you 3:1 risk to reward ratio.
📉Short Trading Strategy Example
1. Identify the major trend, to find the short trades it shall be downtrend. On the screen below you can see 1D time frame for BITMART:ETHUSDT.P .
2. Move to lower time frame (in our case 4h) and find the moment when RSI grows above 70. This is our overbought condition and we are going to look for short trade.
3. Find the local resistance zone and open short trade.
4. Take profit when price reaches support level next to the previous swing low
5. Don’t forget to put initial stop loss when enter position. The best stop loss which will give you 3:1 risk to reward ratio.
⚡️RSI Breakout Strategy
RSI is breaking through 60 indicating bullish momentum shift if the long-term trend is bullish can be the potential long signal
RSI is breaking down 40 indicating bearish momentum shift if the long-term trend is bearish can be the potential short signal
This strategy works great only on the trending market, don’t use it on the range bounded market to avoid whiplashes.
📈Long trading strategy example:
1. Make sure that long-term trend is bullish. Use 200 period EMA as its approximation. If price remains above it we can look for potential long trade setup.
2. If RSI crossed above the level 60 open long trade.
3. Put the initial stop-loss under the signal candle’s low.
4. Take profit when price reached 3:1 risk-to-reward ratio.
📉Short trading strategy example
1. Make sure that long-term trend is bearish. Use 200 period EMA as it’s approximation. If price remains below it we can look for potential short trade setup.
2. If RSI crossed below the level 40 open short trade.
3. Put the initial stop-loss above the signal candle’s high.
4. Take profit when price reached 3:1 risk-to-reward ratio. In our case we received very fast and profitable trade
⚡️RSI Divergence Strategy
RSI can be used also as a trend reversal indicator if we are looking for divergences. This is very reliable sign of current trend weakness and great opportunity open trade against the trend. Usually it’s not recommended, but in case if divergence can be applicable.
Bullish divergence is the situation when price created the lower low, while RSI made the lower low. Usually, it indicates that current downtrend is weakening and we can look for long trades
Bearish divergence is the situation when price created the higher high, while RSI made the lower high. Usually, it indicates that current uptrend is weakening and we can look for short trades
😎Important hint: it’s rarely covered in textbooks about technical analysis, but in our opinion it’s better to used divergences when RSI was able to cross level 50 between two lows/highs.
📈Long trading strategy example
1. Find at the chart situation, when the price made the lower low
2. At the same time RSI shall set the higher low
3. RSI shall break level 50 between these lows indicating shift to the bullish momentum
4. If price failed to set the clean breakdown open long trade on the candle which set the lower low. Put stop loss under it’s low
5. Take profit at 3:1 RR. When you master this concept, you will be able to have much more RR trades, even 10:1. This is possible because when trend finish you have the highest potential upside
📉Short trading strategy example
1. Find at the chart situation, when the price made the higher high
2. At the same time RSI shall set the lower high
3. RSI shall break level 50 between these highs indicating shift to the bearish momentum
4. If price failed to set the clean breakout open short trade on the candle which set the higher high. Put stop loss above it’s high
5. Take profit at 3:1 RR. When you master this concept, you will be able to have much more RR trades, even 10:1. This is possible because when trend finish you have the highest potential upside
Conclusion
The Relative Strength Index (RSI) remains one of the most powerful and flexible tools in a trader’s technical arsenal — but its real value lies in how you use it.
We’ve explored three key RSI strategies:
✅ Overbought/Oversold setups offer simple entry signals in ranging markets, where price tends to revert to the mean.
✅ Breakout strategies unlock RSI’s momentum-tracking potential, helping you ride strong directional moves with confidence.
✅ Divergence detection reveals hidden shifts in market sentiment, giving you an early warning of possible reversals or trend continuations.
Each approach has its strengths — and its risks — but together, they offer a complete framework for using RSI across different market conditions
🔑 Key Takeaways:
RSI is not just a “buy low, sell high” tool — it’s a multi-dimensional indicator that adapts to trends, momentum, and market structure.
The best RSI signals come from confluence: combining RSI with price action, support/resistance, volume, or trend filters like moving averages.
Patience and discipline are essential — RSI signals are only effective when paired with proper risk management and confirmation.
By mastering RSI beyond the basics, you'll be better equipped to make timely, confident, and informed trading decisions — whether you're entering a pullback, chasing a breakout, or spotting the early signs of reversal.
Rsioversold
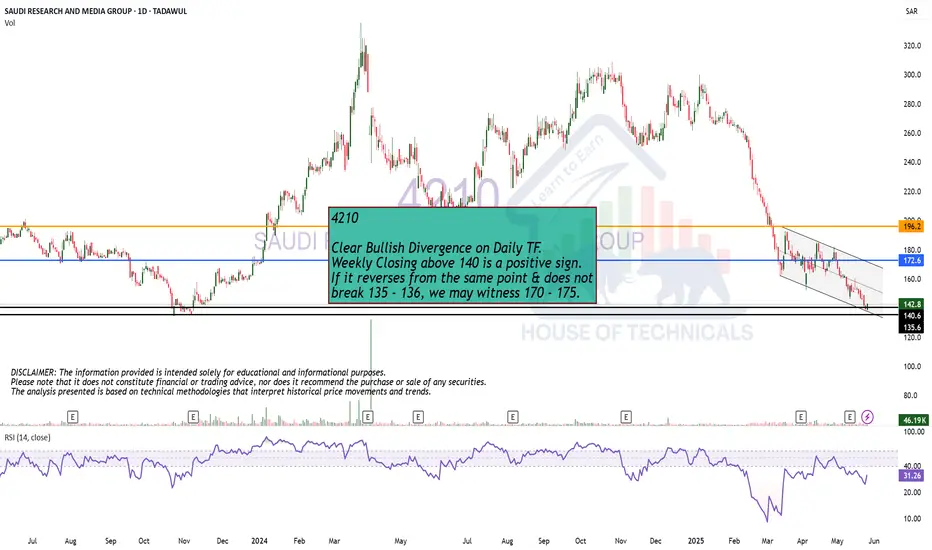
Clear Bullish Divergence on Daily TF.
Clear Bullish Divergence on Daily TF.
Weekly Closing above 140 is a positive sign.
If it reverses from the same point & does not
break 135 - 136, we may witness 170 - 175.
Multiple Signals Shows BTC Might Touched Short-Term BottomLast time BINANCE:BTCUSDT had all 3 of these signals was in August 2024:
1️⃣ RSI <30 in oversold territory
2️⃣ MACD < 0
3️⃣ Fear & Greed Index at "Extreme Fear"
Also, since 2024 began, every time CRYPTOCAP:BTC had a wick + volume spike, it marked a "short-term" bottom.
What do you think? Is this the bottom for BITSTAMP:BTCUSD ?
Leave a comment!
🔴 Read my signature & publications for more info you don’t want to miss.
🔥 for more future "guesses" like this!

Bitcoin's Next Move will Reach $104,500Looking at the CRYPTOCAP:BTC 4-hour time frame, if the RSI bounces from the oversold region and forms a bullish divergence, there’s a higher likelihood of a retest of the $104,500 area before price revisits the major support zone between $90,000 and $85,000.
In the second scenario, if a new all-time high (ATH) is broken, the trend will likely continue upward. However, it's unlikely that this will occur without first testing the $90,000 to $85,000 support zone.

Exxon is oversold (the most since 2020)NYSE:XOM is inside it's sideways channel since March 2024 and trades within a price range of $108 - $123 with one failed breakout to the upper side in October.
The recent pulldown came from commodity prices (oil) and political drama about how much oil will be offered in Trump's term. Of course, it would be best if supply will not outpace demand too much since this would let oil prices drop. Trump will learn this soon enough. Because of that it's mostly noise what we have seen in this chart.
The level at $108 offered strong support twice and the sector (XLE) is also offering support itself. Also, the last time we've seen this stock so oversold was during the Covid crash in 2020.
From a fundamental perspective, Exxon Mobil's recent performance highlights its strong investment potential. The company's total shareholder yield, combining dividends and buybacks, now exceeds 7%, offering substantial returns to investors. In Q3 2024, Exxon reported $8.6 billion in net profit, with a 25% production increase, partly due to the acquisition of Pioneer Natural Resources. Despite a 5% earnings decline from lower commodity prices, Exxon's diversified operations and strategic investments in alternative energy position it well for long-term growth. The recent stock price dip presents an attractive entry point for investors seeking robust returns in the energy sector.
Target Zones
$114.00
$123.00
Support Zones
$108.00

MDLZ $72.00 - Don't Miss Out on This 18%NASDAQ:MDLZ announced it would like to buy NYSE:HSY which led to a drop to $60. The sell-off came with a high volume and an oversold RSI. The buyers were able to buy the stop up to $61.44 getting it into the support zone. The sell-off did also respect the current bearish channel we're in. From this point on we could see a little bounce or the start of a new bullish phase inside this huge sideways channel.
Our first target would be the resistance at $64.22. If we bounce from this we could see another leg down which is why we should take profit here and move the stop-loss to break-even. If the stock decides to use its momentum for more we could target the area at $73.00. We exit this trade if the stock closes on the daily chart with a candle below the support zone of $60.67.
Resistance / Target Zones:
$64.22
$73.00
Support Zone:
$60.67
Let me know what you think!

SBI Life Insurance Co. Ltd. - Technical Analysis UpdateSupport and Resistance Zones:
1.Key Support Zone: ₹1,385-₹1,463
This zone aligns with the Fibonacci 0.236 retracement level and the recent reversal point, making it a strong support.
2.Immediate Resistance Levels:
₹1,555 (Fibonacci 0.382 retracement).
₹1,630 (Fibonacci 0.5 retracement).
₹1,705 (Fibonacci 0.618 retracement), a crucial level to watch.
3.Fibonacci Retracement Levels:
The stock has retraced sharply from its high of ₹1,943 and is showing signs of reversal near the 0.236 Fibonacci level. A breakout above ₹1,500 could confirm bullish momentum toward higher Fibonacci levels.
4.Volume Analysis:
Volume appears to be increasing near the support zone, indicating buying interest from market participants.
The Volume Profile indicates strong accumulation between ₹1,400-₹1,500.
5.Moving Averages:
The stock is attempting to reclaim the 20-day EMA as a dynamic support.
A crossover above the 50-day EMA could signal further bullish strength.
6.RSI (Relative Strength Index):
RSI is recovering from oversold levels, indicating a possible trend reversal. A move above 50 would strengthen the bullish case.
7.Projection:
If the stock sustains above ₹1,463, it could aim for ₹1,555 in the short term and ₹1,705 in the medium term.
A break below ₹1,385 would invalidate this view and could lead to further downside.
Conclusion:
SBI Life Insurance is poised for a potential bounce-back. Traders can consider entries near the ₹1,450-₹1,470 range, targeting ₹1,555 and ₹1,705 with appropriate stop losses below ₹1,385.

Why I am getting very Cautious trading Long - Gold / Precious M
USDX has really fallen off a cliff this week & this lowering of the USD has been supportive of Gold & all at a time when Gold has been bided up a bit too much & making the Gold price overbought on the Stochastic's higher-time-frames.
With USDX and the Gold-price having an inverse relationship, my chart shows just how much the USD has been oversold this week on the important 4HR, Daily & Weekly Stochastics.
A strong cross-up on the 20 level could signal a rally in USDX soon, I tip it will rally next week if not before finding strength during late Thursday and Friday trading.
There is a tonne of economic news coming out today Thursday morning, will it be a mixed bag and what impact will have on the Gold price and USDX... We will know later.

Bitcoin in megaphone pattern on its way upwards to $68kBTCUSDT has remarkably been respecting a slight megaphone chart pattern for nearly 6 months now since mid March 2024. It has respected the upper and lower trend lines of the pattern approximately 4 times each. Additionally, the rsi is also at the oversold bottom level.
Technical chartists usually say that price action is most important of all the indicators, and with such 4 time upper and lower pattern boundary respecting price moves the price action confirmation is strong. This coupled with the rsi, means there is opportunity for a swing trade with approx 25% upside.
Entry: $55k
Exit: $68k
Trade exit: $47.5k (to avoid major market event caused spikes downwards)
Note: The expected future fed rate cut should cause further buoyancy to price action. Furthermore, market events may cause spikes downwards, thus setting an automatic trade exit at $47.5 would avoid the previous downward spike level of $48 and leave a 1:2 P/L ratio. Therefore, allocating more than a max of 2-4% of a portfolio to this swing trade would not be advisable.

BTC Cup & Handle Potential Paths (1W)Forecasting some potential cup and handle formations for BTC using trend based fib extensions and trend based fib time. Assuming a .382 fib retracement, each handle assumes a local bottom at around a fib time line. Overheated oscillators provide some evidence that a short term pullback is in order before continuing BTC's bull run post-halving.
If we get a retracement lower than .382, then there's a relative volume spike in the volume profile centered about the .5 fib line that could realistically act as support. Although my understanding is that cup and handles are more bullish when retracement handles are no deeper than ~1/3 down from recent swing high path.
Looking way ahead if this plays out, i'd be looking for rsi to show negative divergence paired with BTC making macro higher highs as chances to take profit down the road, as is what happened last bull run.

Nikkei Hits Bear Market after BoJ HikeAfter a cautious approach away from its ultra-easy monetary setting, the Bank of Japan bolstered its normalization efforts last week. Policymakers raised rates to around 0.25% after the March watershed exit from sub-zero levels, pointed to more moves ahead and also announced sizable reduction in bond purchases.
This action signaled tightening resolve and also accelerated the Yen rebound, threatening to unravel the two key pillars of the stock markets’ rally to record highs. Along with broader recession fears after the US jobs report, JPN225 slumps into a bear market as it loses more than 20% for July’s all-time high and could be in for further losses.
On the other hand, the BoJ is still in accommodative territory and warned that could increase its bond buying if needed, while the broader market rout could push it back into a more conservative approach. Furthermore the rate differential is still huge and the carry trade may persist. From a technical standpoint the RSI points to the most oversold conditions in years and that could help JPN225 rebound out of bear territory and towards a cluster of hurdles that starts with the 200Days EMA, but significant sentiment improvement needed.
Stratos Markets Limited (www.fxcm.com):
CFDs are complex instruments and come with a high risk of losing money rapidly due to leverage. 62% of retail investor accounts lose money when trading CFDs with this provider . You should consider whether you understand how CFDs work and whether you can afford to take the high risk of losing your money.
Stratos Europe Ltd (trading as “FXCM” or “FXCM EU”), previously FXCM EU Ltd (www.fxcm.com):
CFDs are complex instruments and come with a high risk of losing money rapidly due to leverage. 59% of retail investor accounts lose money when trading CFDs with this provider . You should consider whether you understand how CFDs work and whether you can afford to take the high risk of losing your money.
Stratos Trading Pty. Limited (www.fxcm.com):
Trading FX/CFDs carries significant risks. FXCM AU (AFSL 309763). Please read the Financial Services Guide, Product Disclosure Statement, Target Market Determination and Terms of Business at www.fxcm.com
Stratos Global LLC (www.fxcm.com):
Losses can exceed deposits.
Any opinions, news, research, analyses, prices, other information, or links to third-party sites contained on this video are provided on an "as-is" basis, as general market commentary and do not constitute investment advice. The market commentary has not been prepared in accordance with legal requirements designed to promote the independence of investment research, and it is therefore not subject to any prohibition on dealing ahead of dissemination. Although this commentary is not produced by an independent source, FXCM takes all sufficient steps to eliminate or prevent any conflicts of interests arising out of the production and dissemination of this communication. The employees of FXCM commit to acting in the clients' best interests and represent their views without misleading, deceiving, or otherwise impairing the clients' ability to make informed investment decisions. For more information about the FXCM's internal organizational and administrative arrangements for the prevention of conflicts, please refer to the Firms' Managing Conflicts Policy. Please ensure that you read and understand our Full Disclaimer and Liability provision concerning the foregoing Information, which can be accessed via FXCM`s website:
Stratos Markets Limited clients please see: www.fxcm.com
Stratos Europe Ltd clients please see: www.fxcm.com
Stratos Trading Pty. Limited clients please see: www.fxcm.com
Stratos Global LLC clients please see: www.fxcm.com
Past Performance is not an indicator of future results.

USDJPY to Nearly 4-Month Lows on Shifting Policy DynamicsThe Bank of Japan followed a cautious and slow path away from the ultra-loose monetary setting after abandoning the negative rates regime and the yields curve control, in the historic decision of March. But price pressures persisted, wages increased substantially after the spring negotiation and the Yen was further devalued, forcing officials to step up their tightening efforts.
They hiked rates for the second time in this cycle, to around 0.25%, while pointing to more moves ahead if the economy evolves as anticipated. Furthermore, they announced a plan to slash their bond purchases, so that they will halve by Q1 2026.
After hitting 38-year highs at the start of the month, USD/JPY reversed course due to Japan’s FX interventions rising expectations for BoJ hikes and increased optimism around Fed cuts. The forceful action by the Bank of Japan along with the Fed opening the door to a September pivot this week, exacerbated the decline to the lowest levels since mid-March. The pair is now exposed to 146.47 and the shift in monetary policy dynamics can fuel further weakness.
On the other hand, BoJ warned it could increase bond purchases again if needed, while market pricing for three cuts by the Fed may be stretched. Furthermore, the rate differential remains wide and the favorable carry trade could persist. The Relative Strength Index is oversold and this can drive a rebound above the 200Days EMA (blue line), but 200H4 EMA (black line) looks much harder. Focus now shifts to Friday’s US NFPs which are becoming increasing important for the policy path, as disinflation is back on track.
Stratos Markets Limited (www.fxcm.com):
CFDs are complex instruments and come with a high risk of losing money rapidly due to leverage. 62% of retail investor accounts lose money when trading CFDs with this provider . You should consider whether you understand how CFDs work and whether you can afford to take the high risk of losing your money.
Stratos Europe Ltd (trading as “FXCM” or “FXCM EU”), previously FXCM EU Ltd (www.fxcm.com):
CFDs are complex instruments and come with a high risk of losing money rapidly due to leverage. 59% of retail investor accounts lose money when trading CFDs with this provider . You should consider whether you understand how CFDs work and whether you can afford to take the high risk of losing your money.
Stratos Trading Pty. Limited (www.fxcm.com):
Trading FX/CFDs carries significant risks. FXCM AU (AFSL 309763). Please read the Financial Services Guide, Product Disclosure Statement, Target Market Determination and Terms of Business at www.fxcm.com
Stratos Global LLC (www.fxcm.com):
Losses can exceed deposits.
Any opinions, news, research, analyses, prices, other information, or links to third-party sites contained on this video are provided on an "as-is" basis, as general market commentary and do not constitute investment advice. The market commentary has not been prepared in accordance with legal requirements designed to promote the independence of investment research, and it is therefore not subject to any prohibition on dealing ahead of dissemination. Although this commentary is not produced by an independent source, FXCM takes all sufficient steps to eliminate or prevent any conflicts of interests arising out of the production and dissemination of this communication. The employees of FXCM commit to acting in the clients' best interests and represent their views without misleading, deceiving, or otherwise impairing the clients' ability to make informed investment decisions. For more information about the FXCM's internal organizational and administrative arrangements for the prevention of conflicts, please refer to the Firms' Managing Conflicts Policy. Please ensure that you read and understand our Full Disclaimer and Liability provision concerning the foregoing Information, which can be accessed via FXCM`s website:
Stratos Markets Limited clients please see: www.fxcm.com
Stratos Europe Ltd clients please see: www.fxcm.com
Stratos Trading Pty. Limited clients please see: www.fxcm.com
Stratos Global LLC clients please see: www.fxcm.com
Past Performance is not an indicator of future results.

GALA — Oversold RSI, Local Bottom → 16% Upside PotentialGALA found a local bottom at $0.027 and printed a reversal candle on the daily chart. Additionally, the RSI and Stochastic Oscillator hit oversold levels.
Moreover, the crypto token performed well during Bitcoin's dip yesterday.
Therefore, it is likely that GALA will enter a bullish direction. The next resistance is $0.032, resulting in a 15%-16% profit potential.
Historically, the oversold RSI on the daily chart resulted in some pretty solid gains: Out of 62 signals, GALA pumped more than 10% in 82%.

Copper Breaches Key Support but Tech & Fundamentals FavorableThe commodity has registered a notable pullback from last month’s record highs and has now moved below the pivotal EMA200 (black line) and 38.2% Fibonacci of this year’s advance. This pauses the bullish momentum and exposes Copper to the ascending trend line from the 2024 low and the daily Ichimoku Cloud.
However, this region could contain the correction and multiple roadblocks follow, making the downside unfriendly, while the RSI points to oversold conditions. As such, we expect Copper to find renewed vigor and push towards 5.000 and eventually new all-time highs (5.200), with the fundamentals also being supportive.
The improved supply-demand dynamics have driven this year’s rally and can fuel further strength. There may be some risks in the consumption outlook, mostly form China’s property sector and the slowdown in the pace of EV adoption, but consumption for the metal is set to increase due to the AI revolution and the clean energy transition. At the same time, things don’t look good on the supply side, with major miners slashing their output targets for the year.
Stratos Markets Limited (www.fxcm.com):
CFDs are complex instruments and come with a high risk of losing money rapidly due to leverage. 68% of retail investor accounts lose money when trading CFDs with this provider . You should consider whether you understand how CFDs work and whether you can afford to take the high risk of losing your money.
Stratos Europe Ltd (trading as “FXCM” or “FXCM EU”), previously FXCM EU Ltd (www.fxcm.com):
CFDs are complex instruments and come with a high risk of losing money rapidly due to leverage. 73% of retail investor accounts lose money when trading CFDs with this provider . You should consider whether you understand how CFDs work and whether you can afford to take the high risk of losing your money.
Stratos Trading Pty. Limited (www.fxcm.com):
Trading FX/CFDs carries significant risks. FXCM AU (AFSL 309763). Please read the Financial Services Guide, Product Disclosure Statement, Target Market Determination and Terms of Business at www.fxcm.com
Stratos Global LLC (www.fxcm.com):
Losses can exceed deposits.
Any opinions, news, research, analyses, prices, other information, or links to third-party sites contained on this video are provided on an "as-is" basis, as general market commentary and do not constitute investment advice. The market commentary has not been prepared in accordance with legal requirements designed to promote the independence of investment research, and it is therefore not subject to any prohibition on dealing ahead of dissemination. Although this commentary is not produced by an independent source, FXCM takes all sufficient steps to eliminate or prevent any conflicts of interests arising out of the production and dissemination of this communication. The employees of FXCM commit to acting in the clients' best interests and represent their views without misleading, deceiving, or otherwise impairing the clients' ability to make informed investment decisions. For more information about the FXCM's internal organizational and administrative arrangements for the prevention of conflicts, please refer to the Firms' Managing Conflicts Policy. Please ensure that you read and understand our Full Disclaimer and Liability provision concerning the foregoing Information, which can be accessed via FXCM`s website:
Stratos Markets Limited clients please see: www.fxcm.com
Stratos Europe Ltd clients please see: www.fxcm.com
Stratos Trading Pty. Limited clients please see: www.fxcm.com
Stratos Global LLC clients please see: www.fxcm.com
Past Performance is not an indicator of future results.

Brent Oil Slides Despite OPEC+ CutsOPEC and allies including Russia, have been implementing a series of supply reductions since late-2022, which have helped support oil prices and on Sunday they agreed to prolong those curbs . Around 3.66 million barrels (mbpd) of cuts that were due to expire at the end of the year were rolled over into 2025. The most recent tranche of 2.2 mbpd that would expire at the end of the month was extended into Q3 and will be phased of gradually after that. The decision keeps current total reduction cuts at nearly 5.9 mbpd and almost 6% of global output.
On the other hand, members will start tapering some of those curbs over a 12-month period starting in the fourth quarter and the detailed plan could hinder their ability to keep output lower, if such need arises. Furthermore, the group sidestepped the contentious issue of capacity, while compliance has generally been loose in the past.
Brent oil slumps following the decision, as output will start to go up from October, just as non-OPEC countries like the US keep pumping oil. At the same time, demand growth is expected to decelerate sharply this year. Optimism for Middle East ceasefire, along with poor China PMIs, also contributed. UKOil is now exposed to this year’s lows (74.76), although breaching those of 2023 (70.09) is a much harder task.
However, the deep output cuts by OPEC+ will lead to tighter market at least in the near term and this can continue to support oil prices. Furthermore, central banks are moving towards less restrictive monetary policies, which can also help. On the technical side, the RSI points to extremely oversold conditions that can contain the fall and give UKOil the opportunity to rebound. A return above the EMA200 (blackline) that would pause the bearish bias would need strong catalyst though and the upside is unfriendly.
Stratos Markets Limited (www.fxcm.com):
CFDs are complex instruments and come with a high risk of losing money rapidly due to leverage. 68% of retail investor accounts lose money when trading CFDs with this provider . You should consider whether you understand how CFDs work and whether you can afford to take the high risk of losing your money.
Stratos Europe Ltd (trading as “FXCM” or “FXCM EU”), previously FXCM EU Ltd (www.fxcm.com):
CFDs are complex instruments and come with a high risk of losing money rapidly due to leverage. 73% of retail investor accounts lose money when trading CFDs with this provider . You should consider whether you understand how CFDs work and whether you can afford to take the high risk of losing your money.
Stratos Trading Pty. Limited (www.fxcm.com):
Trading FX/CFDs carries significant risks. FXCM AU (AFSL 309763). Please read the Financial Services Guide, Product Disclosure Statement, Target Market Determination and Terms of Business at www.fxcm.com
Stratos Global LLC (www.fxcm.com):
Losses can exceed deposits.
Any opinions, news, research, analyses, prices, other information, or links to third-party sites contained on this video are provided on an "as-is" basis, as general market commentary and do not constitute investment advice. The market commentary has not been prepared in accordance with legal requirements designed to promote the independence of investment research, and it is therefore not subject to any prohibition on dealing ahead of dissemination. Although this commentary is not produced by an independent source, FXCM takes all sufficient steps to eliminate or prevent any conflicts of interests arising out of the production and dissemination of this communication. The employees of FXCM commit to acting in the clients' best interests and represent their views without misleading, deceiving, or otherwise impairing the clients' ability to make informed investment decisions. For more information about the FXCM's internal organizational and administrative arrangements for the prevention of conflicts, please refer to the Firms' Managing Conflicts Policy. Please ensure that you read and understand our Full Disclaimer and Liability provision concerning the foregoing Information, which can be accessed via FXCM`s website:
Stratos Markets Limited clients please see: www.fxcm.com
Stratos Europe Ltd clients please see: www.fxcm.com
Stratos Trading Pty. Limited clients please see: www.fxcm.com
Stratos Global LLC clients please see: www.fxcm.com
Past Performance is not an indicator of future results.

DAX Tests Critical Support after Hotter German InflationConsumer price pressures in Germany accelerated in April to 2.4% y/y, which marked the first uptick since December. Eurozone inflation meanwhile persisted at the same level (May preliminary due on Friday), while wages in the region increased in the first quarter. This has created some worries around the disinflation process and the central bank’s prospects for less restrictive stance.
GER30 extends its slide from the recent all-time peak into the third week as a result and now tests a crucial support area. It breaches the EMA200 (H4) threatening the 38.2% Fibonacci of its last leg up. This would pause the bullish momentum and create risk for deeper pullback towards the daily Ichimoku Cloud, but we are cautious around sustained weakness.
Recent European inflation data may have showed some persistence and European officials may have warned against back-to-back rate cuts, but the ECB is expected to become the first major central bank to pivot and slash rates next week. This shift towards looser monetary setting, along with Germany’s exit for recession, are supportive for the stock market. Furthermore, the RSI is oversold and if GER30 manages to hold the pivotal EMA200 and 38.2% Fibo, its bullish bias would be reaffirmed and could lead to new record highs.
Stratos Markets Limited (www.fxcm.com):
CFDs are complex instruments and come with a high risk of losing money rapidly due to leverage. 68% of retail investor accounts lose money when trading CFDs with this provider. You should consider whether you understand how CFDs work and whether you can afford to take the high risk of losing your money.
Stratos Europe Ltd (trading as “FXCM” or “FXCM EU”), previously FXCM EU Ltd (www.fxcm.com):
CFDs are complex instruments and come with a high risk of losing money rapidly due to leverage. 73% of retail investor accounts lose money when trading CFDs with this provider. You should consider whether you understand how CFDs work and whether you can afford to take the high risk of losing your money.
Stratos Trading Pty. Limited (www.fxcm.com):
Trading FX/CFDs carries significant risks. FXCM AU (AFSL 309763). Please read the Financial Services Guide, Product Disclosure Statement, Target Market Determination and Terms of Business at www.fxcm.com
Stratos Global LLC (www.fxcm.com):
Losses can exceed deposits.
Any opinions, news, research, analyses, prices, other information, or links to third-party sites contained on this video are provided on an "as-is" basis, as general market commentary and do not constitute investment advice. The market commentary has not been prepared in accordance with legal requirements designed to promote the independence of investment research, and it is therefore not subject to any prohibition on dealing ahead of dissemination. Although this commentary is not produced by an independent source, FXCM takes all sufficient steps to eliminate or prevent any conflicts of interests arising out of the production and dissemination of this communication. The employees of FXCM commit to acting in the clients' best interests and represent their views without misleading, deceiving, or otherwise impairing the clients' ability to make informed investment decisions. For more information about the FXCM's internal organizational and administrative arrangements for the prevention of conflicts, please refer to the Firms' Managing Conflicts Policy. Please ensure that you read and understand our Full Disclaimer and Liability provision concerning the foregoing Information, which can be accessed via FXCM`s website:
Stratos Markets Limited clients please see: www.fxcm.com
Stratos Europe Ltd clients please see: www.fxcm.com
Stratos Trading Pty. Limited clients please see: www.fxcm.com
Stratos Global LLC clients please see: www.fxcm.com
Past Performance is not an indicator of future results.

CRYPTOHOPPER WEBHOOK PEPEUSDT 45MIN RSI WITH CONDITIONS STRATEGYRSI Strategy with EMA and VWMA Conditions
Objective
This trading strategy leverages the Relative Strength Index (RSI) in combination with the Exponential Moving Average (EMA) and the Volume Weighted Moving Average (VWMA) to identify potential buy and sell signals for trading cryptocurrencies on the Cryptohopper platform.
How it works:
Buy Signal: A buy signal is generated when the RSI crosses above the user-defined lower threshold and the EMA (9) is above the VWMA (20).
Sell Signal: A sell signal is generated when the RSI crosses below the user-defined upper threshold.
Indicators Used:
RSI: A momentum oscillator that measures the speed and change of price movements.
EMA (9 period): A moving average that places a greater weight and significance on the most recent data points.
VWMA (20 period): An average that also accounts for volume, giving more weight to periods with higher volume.
How to Set Up Alerts for Webhooks:
To create alerts that can be sent as webhooks to Cryptohopper, follow these steps:
Apply the script to your TradingView chart.
Click on the 'Alerts' icon on the right-hand side toolbar.
Choose the script from the dropdown in the 'Condition' field.
You will see two options: "Buy Alert for Webhooks" and "Sell Alert for Webhooks".
Select the desired alert condition.
In the 'Options' section, set the alert action to 'Webhook URL'.
Enter your Cryptohopper webhook URL into the 'Webhook URL' field.
Configure the alert message according to the format required by Cryptohopper.
Save the alert.
How Alerts Are Generated:
The script will continuously monitor the chart based on the conditions you've set.
When a condition for either a buy or sell signal is met, TradingView will trigger the alert.
If set up for a webhook, TradingView will send an HTTP request to the specified webhook URL with the message payload.
Disclaimer:
This script is for educational purposes and should not be taken as financial advice. Trading cryptocurrencies carries a high level of risk, and you should do your own research or consult a financial advisor before making any investment decisions.

Roku Test with Destiny A 2 year Support trendline A Buy?Hi Guys. So i am always on the lookout for Macro trend setups, signs and opportunities. I believe ROKU is potentially in a position to take a nice swing.
This analysis is on 1 day.
Notice we have reached a Sloping Support trendline from December 2022.
We've had 2 touches previous that resulted in bounces.
Trendline theory states trendlines can stay intact for atleast 3 touch points.
Owing to the idea that our recent touch point is a solid area to take positions. Has a decent probability of a bounce.
On top of that we have the Blue horizontal trendline, which acts as an added layer of Support.
Incase the black trendline does not hold, this would be next lvl.
Stop loss/limit should be placed below trendlines based on risk tolerance. Small positions can have a larger % loss, vise versa.
Now to Support my theory of this buying a solid area to take positions.
I have 3 indicators.
RSI which is in Oversold conditions after 3+ months.
On top of that the momentum indicators MACD and STOCH. Are also oversold.
MACD is signaling a waning bearish momentum. As seen by the light red histobar prints.
We are looking for and eventually should see Green bars and a bullish cross. Which can bring in necessary demand we need for bounce.
Also STOCH RSI is below the 20 lvl, but crossing Bullish as we speak.
This must continue and a bullish cross ABOVE 20 lvl, will also bring in demand and help with bounce.
If we see bullish changes in the momentum indicaotrs, i believe there would be a even higher probability of prices bouncing.
So pay attention, be diligent and manage risk accordingly.
__________________________________________________________________________________
Thank you for taking the time to read my analysis. Hope it helped keep you informed. Please do support my ideas by boosting, following me and commenting. Thanks again.
Stay tuned for more updates on ROKU in the near future.
If you have any questions, do reach out. Thank you again.
DISCLAIMER: This is not financial advice, i am not a financial advisor. The thoughts expressed in the posts are my opinion and for educational purposes. Do not use my ideas for the basis of your trading strategy, make sure to work out your own strategy and when trading always spend majority of your time on risk management strategy.

USD/JPY ⬆️ Long Trade Setup ⬆️Hello Everyone 🙋🏽♂️
Triangle pattern + RSI Signal
💲 Entry Point : 143.571
🟢 TP 151.922 🔴 SL 139.473
We are not responsible of any losses for anyone, our trades are profitable more for long terms and we take losses as everyone,
manage your lot size as well and your SL and TP and my opinion is 0.01 lot for each 500 $.
Don't forget to hit the like bottom and write a comment to support us.
Follow us for more 🙋🏻♂️
Best Regard / EMA Trading .
Disclaimer:
----------------
It's not a financial advise, As everyone we take losses sometime but for long term trading we are profitable traders, so manage your account well with SL and TP and your lot size to keep your account safe and stay in the market

Paramount (PARA) Flirting with Historical Support, Time to Buy?Hi Guys. As usual always on the lookout for Macro trend setups, signs and opportunities. PARA seems to be in a position of low risk trade setup.
We have made it to a Historical Support level, where interactions here normally leads to bounces upward.
Please note however that previous history does not mean it is 100% probable that it will repeat.
HOwever, being in a downtrend for some time now. It is likely that there maybe DEMAND in this area. Its important to watch for signs of confirmation of Support.
This weeks candle may show signs. It is a Hammer candle printing at the bottom of a downtrend since January. Lower wick indicates buy pressure or demand.
Notice ABOVE we have a resistance trendline. Note if we bounce from here, that will be our area to watch. This resistance trendline has been dragging us down since April 2022.
We could also be attempting to form a double bottom.
Recently there is also an uptick in VOLUME, which can indicate support of the demand currently seen at this support lvl.
Ive added 2 indicators.
MACD shows that we have not reached ABOVE the 0 lvl in quite sometime. Hinting to the idea that eventually we will.
Notice also the presence of Bullish Divergence with MACD and price action.
Watch for the change in color of the histobars to light red. This will suppport the idea of waning bearish momentum. The presence of a bullish cross is also vital to watch for.
Now notice RSI. Our current RSI as indicated by orange circle, shows flattening of the RSI. This shows buying is stalling the sell off.
However, notice the rectangles highlighting previous flattening of RSI. There is a possibility of RSI continuing downward. An important sign for the RSI in my opinion would be if RSI can move above the resistance trendline. This thinking ahead, can coincide with breaking the Major resistance in price action.
Regardless of what happens, right now we are in a critical area and pushes for observation.
__________________________________________________________________________________
Thank you for taking the time to read my analysis. Hope it helped keep you informed. Please do support my ideas by boosting, following me and commenting. Thanks again.
Stay tuned for more updates on PARA in the near future.
If you have any questions, do reach out. Thank you again.
DISCLAIMER: This is not financial advice, i am not a financial advisor. The thoughts expressed in the posts are my opinion and for educational purposes. Do not use my ideas for the basis of your trading strategy, make sure to work out your own strategy and when trading always spend majority of your time on risk management strategy.

SMH breaks above its updward, reversal likelySMH has gone on a wonderful tear the last year and has recently showing signs that it is way overbought and due for a correction.
From a 1W period we see that SMH has broken above year long upward trend.
This is a first for SMH to do over the last year
The ETF has gone through some notable contractions like from Aug - Oct of 2023. This occured without breaking above the trend.
RSI 20 is now also for the first time showing that it has reached above 70 in over a year.
We should expect a decent contraction or elongated pull back in time to correct fore this over purchasing it went through.
Tighten your stop losses to protect against downside risk.

ANKR ANKAR to 0.15$hellow fellows, ankr will go to 0.09$ very soon.
please understand Rsi: last time we saw big uprise, the Rsi was up, but still continue in that position for at least one month.
according to that, we are up now in the Rsi, but we will continue growing up until lets say 0.15$>
