RSR/USDT: BREAKOUT,RETEST DONE! READY FOR AN ATH!!Hey everyone!
If you're enjoying this analysis, a thumbs up and follow would be greatly appreciated!
RSR looks promising here. It breaks out from the falling wedge-like structure in the daily time frame and a perfect retest is also done. Now, it seems ready for a 100-150% move. Buy some here and add more in the dip.
Targets:- $0.0068/$0.0092/$0.0122/$0.014
SL:- $0.0048
What are your thoughts on RSR's current price action? Do you see a bullish pattern? Share your analysis in the comments below!
Rsr

RSRUSDT bouncing from monthly supportThe price shot up beyond monthly resistance MR1 only to come back down and retest it again where it was rejected and sent back down towards monthly resistance MS1. The price has bounced from MS1 after hitting it and weekly resistance is causing the price to pullback on this bounce. The price might still dip into MS1 before a stronger bounce in case this current pullback goes further deep. However, this monthly support is a strong one and will allow the price to bounce and continue its journey in upward direction, Therefore, I see the price moving beyond monthly resistance MR1 after having a brief pause and pullback there. Once it breaks MR1, it will target monthly resistance MR2 zone. Therefore, a long from MS1 is favorable for this asset at least for the coming months.

$RSR :: Everything is indicated in the diagramReserve Rights (RSR) is an ERC-20 token that will serve two main purposes for the Reserve Protocol: overcollateralization of Reserve stablecoins (RTokens) through staking and governing them through proposing & voting on changes to their configuration.
The Reserve Rights (RSR) token was launched in May 2019 following a successful initial exchange offering (IEO) on the Huobi Prime platform.

RSR buy setupThe structure of RSR is bearish, but we have a good demand at the bottom, which can be used to look for buy/long positions in the form of scalpy.
Liquidity pools are expected to be swept
Closing a daily candle below the invalidation level will violate the analysis
Note that the financial market is risky, so:
Do not enter any position without confirmation and trigger.
Do not enter a position without setting a stop.
Do not enter a position without capital management.
When we reach the first TP, save some profit and try to move the stop continuously in the direction of your profit.
If you have any comments please post them, comments will help us improve our performance
Thanks

$rsr HTF bottom | big volumethere are very few charts out there that look as clean as RSR does on the weekly. huge volume cluster at the lows. 30x back to the highs and this could easily run much higher.
ATH market cap was just over $5B.. $180MM market cap currently. Think at peak bull this could run to $+50B.

RSRUSDT.4HThe RSR/USDT 4-hour chart reveals a recent uptick after testing the S1 support level at $0.004704. This movement could indicate the beginning of a bullish reversal within the lower trading range established in recent weeks.
The MACD shows a slight bullish crossover, where the MACD line has crossed above the signal line, signaling increased buying momentum. However, the overall MACD trend remains in the negative zone, suggesting the need for caution as the market might still be prone to bearish pressures.
The Relative Strength Index (RSI) is hovering around 45, which is closer to the middle range. This indicates a somewhat neutral market sentiment, not particularly leaning towards overbought or oversold conditions, which provides a balanced view but suggests monitoring for a clearer direction.
Given these conditions, if the price can sustain above S1 and continue to move higher, the next target could be the R1 resistance level at $0.005624. Traders should look for a consolidation above this level to consider a more definitive bullish trend towards R2 at $0.007841. Conversely, a fall below S1 might lead to testing the lower support S2 at $0.004070, which could validate further bearish sentiment. The key in the upcoming sessions will be the price's ability to hold above S1, signaling possible strength for a continued recovery.

$RSR may explode#RSR chart seems bullish. Already triple bottomed in mid term and now have a bull flag and W bounce in STF. Not financial advice.

#RSR/USDT#RSR
The price is moving in a descending channel on the 12-hour frame, about to break upward
With a strong support area in green at 0.0045. The price has already rebounded from it
We have a tendency to stabilize above the Moving Average 100
We also have a downtrend on the RSI that has been breached upward
A moderate rise is expected over 3 levels
Entry price is 0.005800
The first target is 0.00645
The second goal is 0.007450
The third goal is 0.008790

RSR main price targetMain price target for BINANCE:RSRUSDT
Possible Targets and explanation idea
➡️Weekly fib. From 9 May 2022 we are around accumulation zone
➡️On money power indicator you can track blue column where mostly money inflow
➡️Lately we saw money outflow on W tf. Usually whales withdraw initial deposit
➡️Market Mood indicator all the time when you see grey zones its a capitulation
➡️First middle term target will be buy side liquidity level
➡️Next one is sweep EqHigh on W tf and zone of fixation % position
Hope you enjoyed the content I created, You can support with your likes and comments this idea so more people can watch!
✅Disclaimer: Please be aware of the risks involved in trading. This idea was made for educational purposes only not for financial Investment Purposes.
---
• Look at my ideas about interesting altcoins in the related section down below ↓
• For more ideas please hit "Like" and "Follow"!

RSRUSDT(Reserve Rights) Daily tf Range Updated till 18-05-24RSRUSDT(Reserve Rights) Daily timeframe range. broke out of 0.007727 it was in that range level for a while. now only way for a valid confirm breakout is a healthy close. if it gets that 0.010066 is open to visit. local support is at 0.005593.

RSR/USDT It shows bouncing this can be a good sign for upward!💎 Paradisers, #RSR is indeed a coin worth monitoring closely.
💎 With a bullish candle rejection observed on the LTF demand area at 0.00568, there's potential for a bullish reversal. If RSR successfully backtests the resistance at 0.077, it could indicate a strengthening bullish sentiment.
💎 Breaking above the key supply area at 0.00916 would further solidify this bullish momentum, potentially paving the way for RSR to reach our target strong resistance area.
💎 However, if RSR fails to bounce from the LTF demand area, there's a possibility of a retracement towards the Major demand area around 0.0052 - 0.0048. Historical data suggests that RSR has exhibited consistent bounces from this zone, often leading to significant upward movements.
💎 The bullish scenario would be invalidated if the daily candle closes below the Major demand area. Such a development would signal a bearish momentum, potentially leading to further downward movement for RSR.
MyCryptoParadise
iFeel the success🌴

RSR Long Trade Quiet Money PrinterThis has recently touched fresh liquidity and is about to retest that zone. I entered earlier and was hoping to get to add more to my position at or below my entry since I took some profits out at the last HH. This trade has many possibilities for different types of traders. My plan is simple and I will trade in and out at the resistance levels until there is a strong breakout to the upside. This is a long term play to hit the main target if possible and this was planned on a weekly chart. You can see the daily IPDA operating range marked on the daily chart which is the one I am posting here. The weekly makes it obvious why I feel this token is going to explode in the future. If you are using leverage you might want to trade it in smaller sections with tighter SL. Personally I am buying SPOT and just closed out my short as you can see from the other trade before this. I am also adding a grid bot to offset any losses. I will also be building a long position with 3-5 times leverage when I see a strong uptrend begin.
-NFA and this is a little known token, but it is more then meets the eye. #DYOR and always book profits cause most of the time there will always be a place to add back if you so chose to do so. Good luck this trade seems like a real profit generator. I almost hate to share it because for some reason all the trades I post privately are very successful and the ones I post public tend to have more problems.
May everyone earn some good profits on upcoming trades... I see a lot of possibilities just have to be patient.

RSR/USDT 4HOUR CHART UPDATE !!Welcome to this quick RSR/USDT analysis.
I have tried my best to bring the best possible outcome in this chart.
RSR has broken out of the symmetrical triangle pattern, indicating potential upside momentum. MA 50 confirms a bullish trend, which supports a buy setup.
the explanation:
RSR, in its recent price action, has broken out of a symmetrical triangle pattern. This breakout pattern often suggests a continuation of the previous trend, potentially leading to higher prices.
Furthermore, the Moving Average 50 (MA 50) is indicating a bullish trend. The MA 50 is a widely used technical indicator that tracks the average closing prices of an asset over the last 50 periods. When the current price is above MA 50, it indicates bullish sentiment in the market.
Taking these technical signals together, there is a setup for a potential buying opportunity in RSR/USDT. Traders and investors may consider entering long positions expecting further growth in the price of RSR.
However, like any trading setup, it is essential to conduct a thorough analysis, consider risk management strategies, and closely monitor market developments.
Remember:-This is not a piece of financial advice. All investment made by me is at my own risk and I am held responsible for my own profit and losses. So, do your own research before investing in this trade.
Do hit the like button if you like it and share your charts in the comments section.
Thank you...

RSR looks a rocketThe slightly lower RSR has formed a solid support zone. This coin is in a bullish wave C. In fact, we are now in the middle of a bullish wave C.
If a pullback is made to the green range, it is a buying opportunity.
The target is clear on the chart.
Closing a daily candle below the invalidation level will violate the analysis
For risk management, please don't forget stop loss and capital management
Comment if you have any questions
Thank You

Reserve Rights $RSR going parabolicRSR absolutely crushing it this past week and still not even at macro resistance yet.
Question is, do we see some consolidation first before another god-like candle?
I don't think this thing sees green again for a long time.
The train has left the station.
Vatsik

RSRUSDT(Reserve Rights) Daily tf Range Updated till 27-03-24RSRUSDT(Reserve Rights) Daily timeframe range. another beast of a performance from this one. the amount of profit provided from this one level by level is impressive. 0.012928 holding up for now, a retrace is make sense. local retrace point is at 0.009749.

Breakout from the support - RSR/USDTBINANCE:RSRUSDT (4H CHART) Technical Analysis Update
RSR is currently trading at $0.006682 and showing overall bearish sentiment
Price currently broke down from the resistance and showing continued downward momentum
Entry level: $0.006180
Stop Loss Level: $ 0.006682
TakeProfit 1: $ 0.005909
TakeProfit 2: $ 0.005715
TakeProfit 3: $ 0.005277
Max Leverage: 2x
Don't forget to keep stop loss.
Follow Our TradingView Account for More Technical Analysis Updates, | Like, Share and Comment Your thoughts.
Cheers
GreenCrypto

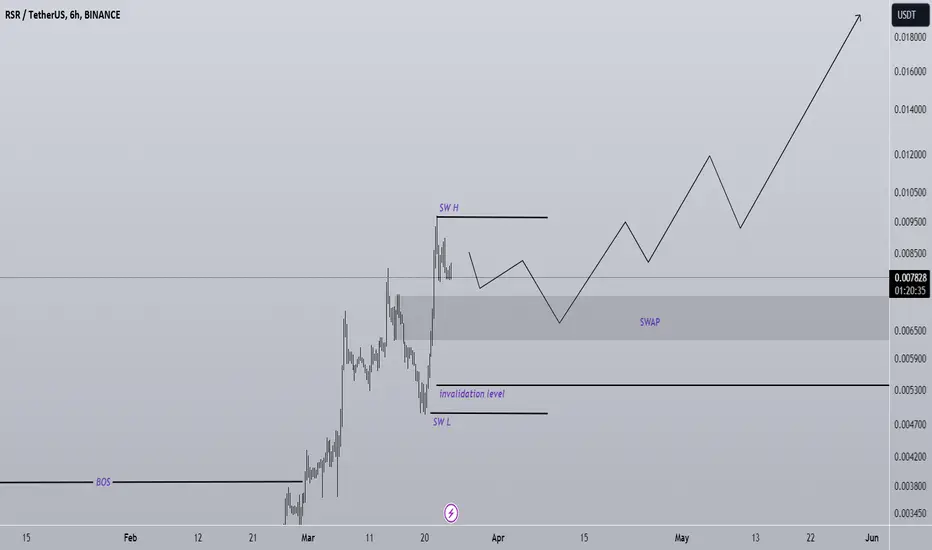
RSR buy setupAccording to the bullish structure of RSR, it seems that RSR intends to continue its upward path.
SWAP is a good place for buy/long positions
By maintaining the demand range, it can move towards the targets.
Closing a daily candle below the invalidation level will violate this analysis
Note that the financial market is risky, so:
Do not enter any position without confirmation and trigger.
Do not enter a position without setting a stop.
Do not enter a position without capital management.
When we reach the first TP, save some profit and try to move the stop continuously in the direction of your profit.
If you have any comments please post them, comments will help us improve our performance
Thanks
#RSR/USDT LONG#RSR
The price has been moving in a descending triangle since April 2022
We have a strong support area from which the price rebounded
The downtrend of the triangle has been broken and we are about to go up
This rise is supported by the moving average 100 break of 100.
The price is now 0.002941
First target 0.005484
Second goal 0.008678

#RSR QUICK SHORT chart ideaBINANCE:RSRUSDT.P #RSR/USDT SHORT ENTRY
Leverage: 1x
Entries: $0.007839
Take profit 1: $0.007407
Take profit 2: $0.006641
Take profit 3: $0.004958
Stop Loss: $0.009301
NOTE: This is just my prediction. Be sure to use STOPLOSS and remember that I am not a financial adviser. your money, your risk!
Thanks
The sroced.

Reserve Rights is leaving accumulation phaseRSR has shown strength as of late, but better late than never.
Currently it is attempting to depart from its macro accumulation phase (high volume area) and is pushing the first level of interest (dotted horizontal). Additionally, it is interacting now with the 100ema on the weekly time frame, meaning I think a shorter term correction is due.
Long term, this chart looks fantastic. I think despite potentially seeing consolidation in the short term, this thing should push up toward our high time frame resistance (macro resistance) in the large red zone.
This is the first higher high out of the bear cycle, so things are really just getting started imo.
Don't sleep on it.
Vatsik

RSR/USDT Bounce from the support, Indicating continue upward!💎 RSR has recently encountered significant developments in the market. Currently, RSR has successfully bounced from a support level that was previously a resistance, indicating potential for further upward movement towards testing our target Bearish OB area.
💎 However, if RSR revisits the support area around $0.0057, it needs to bounce again. Failure to bounce, and especially a breakdown below this support level, could lead to continued downward movement towards the demand area ranging from $0.0041 to $0.0037.
💎 When RSR reaches the demand area, a bounce is essential as it represents a crucial support level from previous bullish movements.
💎 Failure to bounce at this level and a subsequent breakdown below the demand area would signal a bearish trend, potentially leading to further downward movement.
