Reserve Rights - Bottom yet?Yes, I think so. Notice the 5-3-5 corrective wave structure is complete and a 5 wave impulse to the current high. Expect a correction to confirm support before surging ahead.
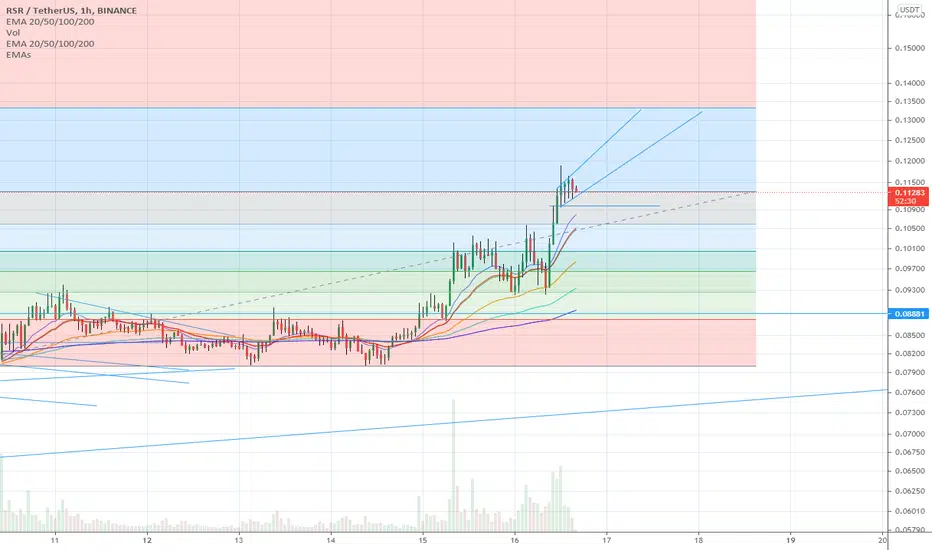
RSRUSDT

RSR is taking offStoch and MACD indicates us uptrend.
After bouncing from support levels drawn with red lines price eventually started taking off.
Growing price of bitcoin also help RSR to go up.


RSR Long - 50 Daily Moving AverageBINANCE:RSRUSDT
What do we see here?
First, we have RSR crossing 4 times the daily moving average on a timeframe of 237 day.
Each and every time we crossed the MA we got a HUGE rally right after followed by a phase of accumulation.
I think going long on RSR now is not a bad idea if it's used with a good risk management.
My first target is 0.15$ with an extended at 0.22$

RSR with bullish FlagRSR with bullish Flag , if weekly candle close above 0.55 its expected to have a bullish direction toward 0.12/0.13 in case 0.45 will hold carrying out the price up

RSRUSDT 💫 on the Daily BINANCE*NOT FINANCIAL ADVICE: DYOR - This idea is IMO for personal use only*
==========================
At time of charting this, we just broke the ascending pennant formation from mid March with decent volume. Am anticipating some healthy pullback and consolidation after this current breakout, due to BTC, before legging back up again.
The support and resistance lines are from the channel on monthly view going back to 2020.
This is a Trade only opp for me, not a HOLD strategy.
As always:
Do your own research. Always be watching BTC .
You do you, I'll do me & my own strategy.
Good chat.🤖

RSR: LONG! It took RSR long to break out, but eventually it is moving!
Wait for a pullback to enter.
Please hit LIKE if you find this useful!

CAN IT REACH NEW ATH???If it can break the downtrend line upwards and stabilize above the static resistance, we can see good movement...
The 0.08 support area is very important to us...

RSR is very promising in the long run, as it has been!Technical analysis regarding the price of RESERVE RIGHTS in relation of dollar Tether for the next scenarios, based on daily movement.
disclaimer
*** In accordance with CVM Instruction No. 598, of May 3, 2018, Art. 21, I declare that the recommendations of this analysis reflect solely and exclusively my personal opinions and perceptions and that they were prepared independently and autonomously. Not being considered a purchase and/or sale recommendation. ***
Any questions do not hesitate to contact me. I'm happy to be able to help you in the best way I can. 🙏

RSR ready for another leg up?! 🚀RSR 🚀
RSR triangle formation and consolidation for almost a month now. Ready to breakout anytime soon! Indicators have reset itself. Expect a breakout within a week!
If you're still not into RSR yet, trade the retest of the breakout!🚀🤑
not financial advice

RSR will make higher high!RSR looks bullish, Here are Reasons:
1. Price is at the Bottom of Strong Ascending converge channel
2. HD+ in daily Time frame(Trend continuation)
3. Strong support Zone Around 0.080$
Please press like button and comment your idea to support us.

$RSR doing a second attempt#RSR is on the 2nd chance now to break up this wedge with higher volume. Would it be successful this time? Mind the hight time frame triangle formation with this dip being the last E wave. plenty to move up from here.


RSR WILL COME BACK SWINGINGMA's positions are perfectly aligned for positive crosses and support.
A flag breakout is going on.
Those who seek great coins for long-term investment, this is your kinda thing! Go for it! A great project!

RSR predictionLooking at the 4h chart we see that the price is going down. And looking at the 1d chart there is a lot of prospects for the price to rise.

RSRUSDTRSRUSDT (1H Chart) Technical Analysis Update
Trendline Breakout
RSR/USDT currently trading at $245
Buy-level: $0.083 - $0.085
Stop loss: Below $0.076
Target 1: $0.090
Target 2: $0.096
Target 3: $0.10
Max Leverage: 3X
ALWAYS KEEP STOP LOSS...
Follow Our Tradingview Account for More Technical Analysis Updates, | Like, Share and Comment Your thoughts.

RSR/USDT is expected to gain 70% in next few weeksRSR is ready for the next wave and headed towards the next all-time high. It is following the chart patterns as we predicted in the last publication.
The next phase is to gain 70% from the current point but may face resistance around 0.98, this gain will be in the next 3-5 weeks. You will notice the sell zone around 1.2. The volume is stable and moving in the favour.
Buy in parts since the market correction is expected. Best of Luck.
Disclaimer:
The Content is for informational purposes only, you should not construe any such information or other material as legal, tax, investment, financial, or other advice. Nothing contained in the publication constitutes a solicitation, recommendation, endorsement, or offer to buy or sell any securities or other financial instruments in this or in any other jurisdiction in which such solicitation or offer would be unlawful under the securities laws of such jurisdiction.

RSRUSDTHello to you all. Mars Signals team wishes you high profits at all times.
The price has gone out of its support line and completed its pullback and experienced further decline. We are considering a shopping area that we have identified for you dear ones. If the price reaches that area, it is a good purchase offer that can see the specified targets.
Warning: This is just a suggestion to you and we do not guarantee profits.
Wish you luck!

RSRUSDT D1:300% gains THE BEST LEVEL TO BUY/HOLD(SL/TP)(NEW)Why get subbed to me on Tradingview?
-TOP author on TradingView
-15+ years experience in markets
-Professional chart break downs
-Supply/Demand Zones
-TD9 counts / combo review
-Key S/R levels
-No junk on my charts
-No MACD / RSI /MA/FIBONACCI
-Frequent updates
-Covering FX/crypto/US stocks
-24/7 uptime so constant updates
-no moonboy/crazy targets
-TA that makes sense and
-setups that payout
RSRUSDT D1:300% gains THE BEST LEVEL TO BUY/HOLD(SL/TP)(NEW)
IMPORTANT NOTE: speculative setup. do your own
due dill. use STOP LOSS. don't overleverage.
🔸 Summary and potential trade setup
::: RSRUSDT 1day/candle chart review
::: accumulation in progress now
::: bullish chart looks good
::: updated/revised outlook
::: setup still valid as of today
::: chart is LOG SCALE
::: get ready to BUY LOW later
::: currently PULLBACK MODE
::: BUY LOW near 0.047
::: entry - April/May 2021
::: for now PULLBACK/CORRECTION MODE
::: will last 2-5 weeks
::: up to 300% gains possible later
::: short-term pullback/correction
::: re-test of yellow TL required
::: before uptrend can resume later
::: SPECULATIVE SETUP
::: do your own due dill
::: and use proper risk management
::: TP bulls is +300% gains
::: details: see chart
::: FINAL TP is 0.18 USD
::: recommended strategy: BUY/HOLD after pullback
::: TP BULLS +300% gains
::: SWING TRADE: BUY/HOLD IT
::: bull run not over yet
::: good luck traders!
::: BUY/HOLD and get paid. period.
🔸 Supply/Demand Zones
::: N/A
::: N/A
🔸 Other noteworthy technicals/fundies
::: TD9 /Combo update: N/A
::: Sentiment mid-term: BULLS
::: Sentiment short-term: PULLBACK/MODE
RISK DISCLAIMER:
Trading Crypto, Futures , Forex, CFDs and Stocks involves a risk of loss.
Please consider carefully if such trading is appropriate for you.
Past performance is not indicative of future results.
Always limit your leverage and use tight stop loss.


