Bitcoin (BTC/USDT) – Bearish Scenario Remains in Focus4H Chart Analysis – Structural + Price Action Insight
Bitcoin is currently trading inside a descending minor channel (orange), which is part of a larger complex correction pattern, potentially a contracting running flat or diametric in NeoWave context. The sequence A to G may suggest that the market completed its G-leg after bouncing off the lower support.
Now, BTC has reached the upper boundary of the orange channel, which aligns with a strong resistance zone around 116.8K–117K.
⸻
✅ Primary Scenario (Bearish Bias):
As long as BTC fails to break and sustain above 116,800 – 117,000, the current move can be interpreted as a pullback within the correction, with high probability of price heading back toward the green liquidity/support zone near 110,800 – 111,400.
This could be a continuation of the broader corrective structure, or even the beginning of a new downward cycle.
⸻
❗ Alternative Scenario:
If bulls manage to break above 117,000 with strong momentum and confirmation (e.g., breakout + retest), the structure may shift bullish with short-term targets near 118,500 – 120,000.
⸻
🎯 Key Takeaways:
• Watch price action closely at the current resistance zone.
• Bearish confirmation (e.g., bearish engulfing, rejection wicks, or supply absorption signs) is required before considering short entries.
• High R:R setups emerge near channel extremes with clear invalidation levels.
RTM

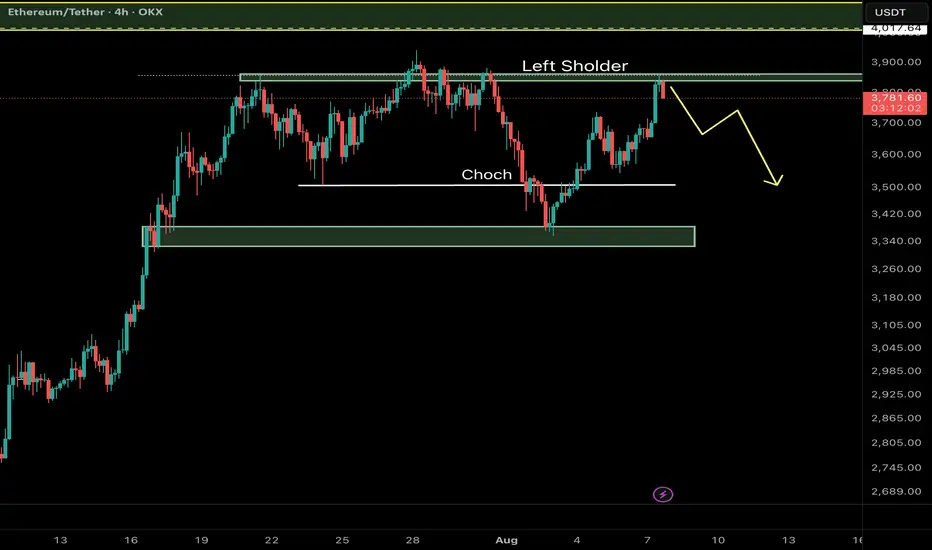
Ethereum (ETH/USDT) – Key Reversal Zone RetestAfter a major CHoCH (Change of Character) on the 4H timeframe, Ethereum has shown a strong bullish move from a high-probability demand zone and is now retesting a critical resistance area aligned with the Left Shoulder of a classic RTM pattern.
⸻
🔍 Key Technical Elements:
• CHoCH confirms the shift from a distribution phase to accumulation.
• Strong reaction from a demand zone near $3,340–$3,380.
• Price is now testing the Left Shoulder, which often acts as a reaction zone before continuation.
⸻
📌 Potential Scenarios:
🔼 Bullish Case (Primary):
If ETH breaks and closes above $3,870, a move toward the next liquidity pool around $4,010–$4,050 is likely.
🔽 Bearish Case (Alternative):
Failure to hold above the current resistance may lead to a pullback toward the $3,340–$3,380 demand zone for another accumulation attempt.
⸻
💡 Educational Note:
In RTM methodology, retests of the Left Shoulder after CHoCH are considered one of the most efficient entry zones — especially when confluence with liquidity voids or imbalance exists.
Follow for more Smart Money & RTM insights.
Bitcoin (BTC/USDT) – RTM Reversal Pattern in Action🔸 Market Structure:
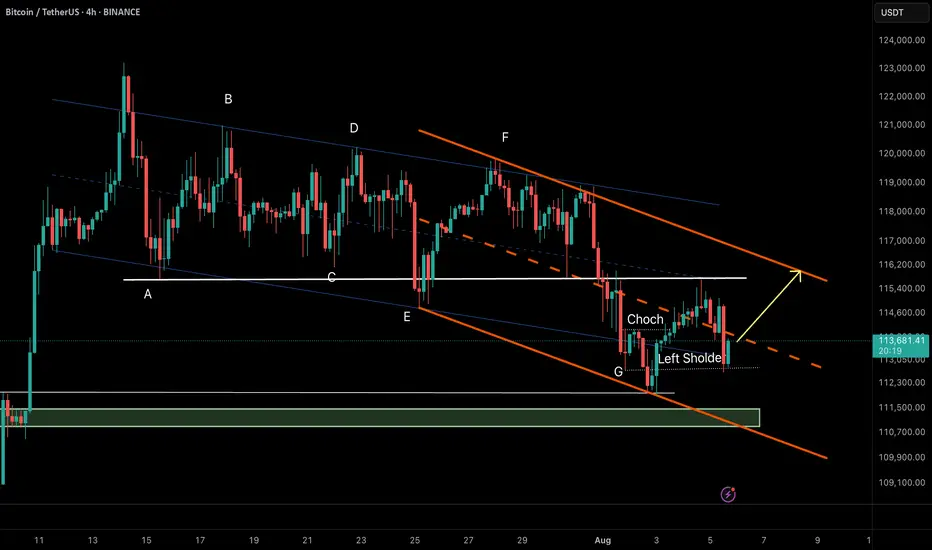
Bitcoin has formed a descending channel after a prolonged correction. Recently, price tapped the channel bottom and printed a CHoCH (Change of Character), indicating a potential reversal.
The price has now retraced to the left shoulder of a potential inverse head & shoulders pattern—an RTM classic structure—which held as support, suggesting bullish continuation.
⸻
🔸 Key Technical Signals:
• ✅ CHoCH confirmed at demand zone near $112,300
• ✅ Retest of the left shoulder validates bullish structure
• ✅ Holding above the internal bullish trendline
• ✅ Price aiming toward upper channel resistance
⸻
🎯 Target:
$116,200 – Top of the descending channel & next key resistance.
❌ Invalidation:
Break and close below $112,800 would invalidate the current RTM setup and open room for deeper correction.
⸻
📌 Summary:
This is a textbook RTM reversal:
CHoCH → Retracement → Left Shoulder Test → Continuation
As long as the structure holds, we remain bullish toward the channel top.
Ethereum - DAILYHi
Ethereum Daily on Sell position...
Be careful and take advantage of the opportunity.

TRBUSDT Setup – Staggered Exits, Smart Profits📌 Entry: 36.70
🎯 TP1: +10% → Secure 50% of position
🛡️ Move to risk-free after TP1 to protect capital
🎯 TP2: Take 50% of remaining volume
🎯 TP3: Close all remaining volume
Calculated exits. Risk-managed. Momentum-ready.

TRBUSDT Setup – Staggered Exits, Smart Profits📌 Entry: 36.70
🎯 TP1: +10% → Secure 50% of position
🛡️ Move to risk-free after TP1 to protect capital
🎯 TP2: Take 50% of remaining volume
🎯 TP3: Close all remaining volume
Calculated exits. Risk-managed. Momentum-ready.

My own setup for #THEHI Dears,
my own setup for buy opportunity #THEUSDT #theusdt
Entry 1 : 0.2182
Entry 2: 0.2114
you can see partial exit points if you will see pullback patterns with 5TPs.
stop loss: 0.2071 (3.49%)

EURUSDBuy Eurusd
Entry: 1.08032
SL: 1.08017 or 1.08016
TP; 1.08077
Your reward is 3 times greater than your risk.

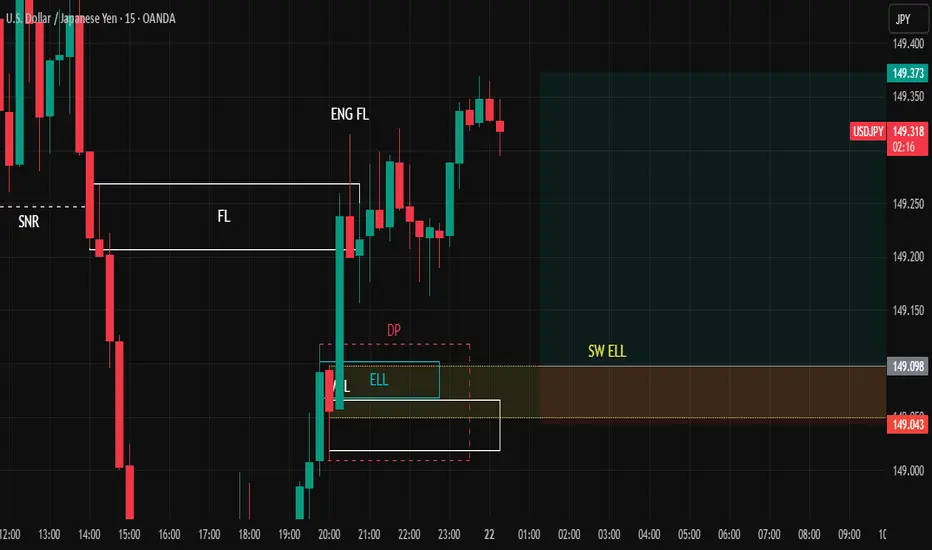
USDJPYAre you ready for scalp?
Buy USDJPY
Entry: 149.098
SL: 149.043
TP: 149.373
The reward is 4 times greater than your risk.
#XLM #XLMUSDT #Stellar #Analysis #Eddy#XLM #XLMUSDT #Stellar #Analysis #Eddy
Everything is clear on the chart, I didn't have enough time to explain further. From the supply area, with or without the area hunt, it can fall to the demand area. Then you can invest in your style by getting the necessary confirmations when the high-time divergence is completed, which is probably the third collision on the lines marked in the demand area.
This analysis is only to show important areas.
It is never too late to buy and invest. Do not rush and do not be fooled by the positive movements and reactions of the market. Wait for the price to reach its valuable areas. In the analysis of the Atom currency, as you can see, there is a strong demand area that is intact. Be patient until the price falls from the decision or extreme flips to the green area of the important demand area. Be sure to check this currency in your monthly time frame and draw the areas. Then refer to the weekly, daily and four-hour time frames and draw the lower time areas and look for confirmation for volatility.
Do not rush to invest and buy spot and let the price reach the support area.
Important areas are drawn and labeled so you can make informed decisions.
Good luck.

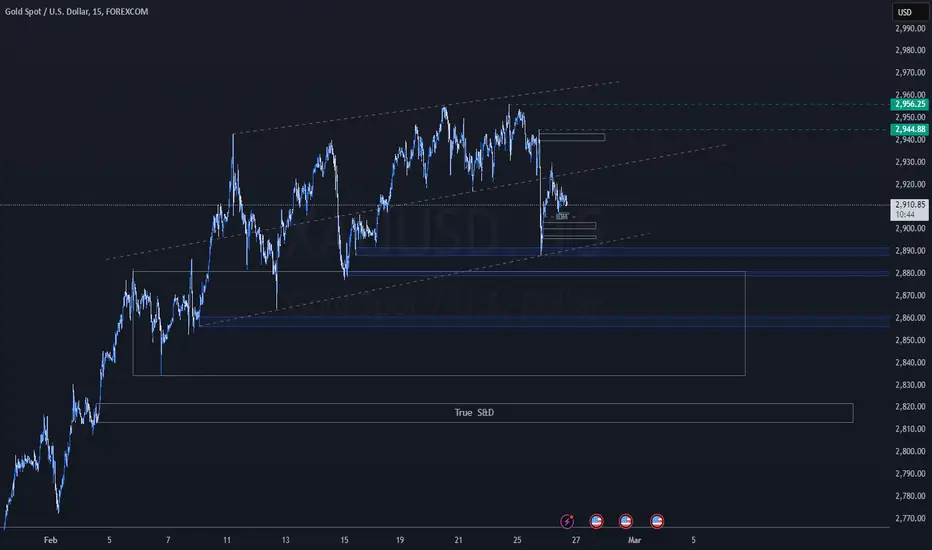
Gold’s Path to a New All-Time HighGold is gearing up for its next big move, but it might need a bit more fuel ⛽ to hit that shiny new all-time high of $3,000! With the current price sitting at $2,912, there’s some interesting action to watch above and below.
Before heading lower, Gold might first hunt some higher levels like $2,944 and $2,952—think of these as potential stop-hunting zones that could set the stage for a drop toward the key demand areas. On the downside, I’m eyeing $2,890 and $2,879 (marked as blue boxes on the chart) as solid demand zones. If the price dips into these, we could see a retracement—Gold taking a quick breather. To really build momentum for that push to $3,000, I’d expect it to test $2,859 or even $2,821 first. These could be the launchpads for its next attack on that ATH milestone.
Here are the key levels I’m tracking:
$2,944: Higher zone to watch
$2,952: Potential stop-hunting peak
$2,890: Demand zone #1
$2,879: Demand zone #2
$2,859: Potential fuel-up level
$2,821: Deeper support for momentum
$3,000: The big ATH target
What do you think—ready for the ride?
EURUSDHello, Traders,
----------------------------------
EURUSD :
TimeFrame: 1W:
Possible price path
personal opinion!
----------------------------------
comment your opinions.
Wishing you profitable trading endeavors!
If this post was useful to you, do not forget to like and comment.❤️
----------------------------------

Next Week’s Market Forecast: Potential Price Correction:Next Week’s Market Forecast:
Potential Price Correction:
Since the price is near the Premium Zone and a resistance level, a short-term correction towards support levels may occur.
Key Support Levels to Watch:
Equilibrium Zone: A strong support zone around $2720 - $2730.
Discount Zone: Lower support at $2617 - $2630, where buyers may step in.
Continuation of the Uptrend:
If the price breaks above the current resistance (Weak High at $2778 - $2780) and consolidates, it may continue its bullish momentum.
Critical Levels for Traders:
Monitor price action at resistance zones to confirm rejection or breakout.
Use BOS and CHoCH signals to align trades with the trend.
Key Support and Resistance Levels:
Resistance Levels:
$2780 - $2800:
A major resistance zone (Premium Zone), likely to cause selling pressure.
$2775 - $2778 (Weak High):
Another strong resistance, which could lead to price rejection.
Support Levels:
$2720 - $2730 (Equilibrium Zone):
An initial support zone for potential price rebounds.
$2700 - $2710 (PDL):
Another strong support level from previous daily lows.
$2617 - $2630 (Discount Zone):
A major demand zone for potential bullish reactions.
Suggested Trading Strategy:
Resistance Reaction:
If the price reaches $2778 - $2780 and shows weakness, consider short-term selling opportunities targeting lower support levels.
Support Reaction:
If the price drops to $2720 - $2730 or $2700 - $2710 and reversal patterns emerge, look for buying opportunities.

XAUUSD DailyIt is expected that after hitting the desired level, we will see a reversal trend. My personal view is that it will break through the previous low and reach the range of 2530 or at least retrace 50%, but this analysis could take time on a daily timeframe.

US30 4HIt is expected that the price will move towards the middle range after hitting the upper resistance and then again move towards the lower target.
I also expect that after hitting the lower range, the price will change direction upwards; however, I will wait to see if an engulfing pattern occurs or not.

XAUUSD 4h AnalysisI expect that after hitting the specified box, the price will move upwards to reach 2632 or even higher.

NEAR touch 99$ ?"Whether the cryptocurrency NEAR can reach $99 and the Fibonacci 1.618 level, my answer is yes, and it definitely will, especially considering the pattern it has formed, which you can see in the image. However, I’m not sure whether it can penetrate the Fibonacci 2 level, which would be $265. All of this depends on whether this cryptocurrency is adopted by users of other cryptocurrencies in its ecosystem or not. In my opinion, it should definitely be in your portfolio."

Scalp position on the euro in 15 minutesIf the node is completed, I will enter the position on the lower RS
Be sure to send me your opinion

XAUUSD Short Opportunity: Bearish Momentum AheadGold (XAUUSD) has recently shown signs of a potential downturn. After reaching a significant resistance level, we are seeing bearish patterns indicating a possible shorting opportunity.
With the current market setup, a short position on XAUUSD appears promising. However, it's crucial to stay updated with market news and economic indicators that could affect gold prices.

SO CLOSE!Bitcoin has reached the green support zone, and buyers are pushing the price upward. If BTC is to grow, it should follow the green path shown in the chart, allowing traders to enter with more confidence. The analysis sets a rejection boundary at 56,500 USDT on the daily timeframe; falling below this level invalidates the bullish scenario.
#BTC #Bitcoin #CryptoAnalysis #Trading #TechnicalAnalysis

Close to target!Bitcoin is now at $63,000, and as we discussed earlier, the $61,000 to $63,000 range is a standard supply zone. Therefore, we can consider buying BTC within this range. However, we must remain cautious about Bitcoin and its liquidity shadows, as there is a possibility of a dip to the purple area at $59,000.

BTCthis is my idea
chart is clearly no need to explain
be carful guys, crypto is high risk
nothing any more

A high potential altcoin ready to go up!simply we have a price in a good support . first price is 0.3777 and the second one will be 0.25 .good for DCA.
