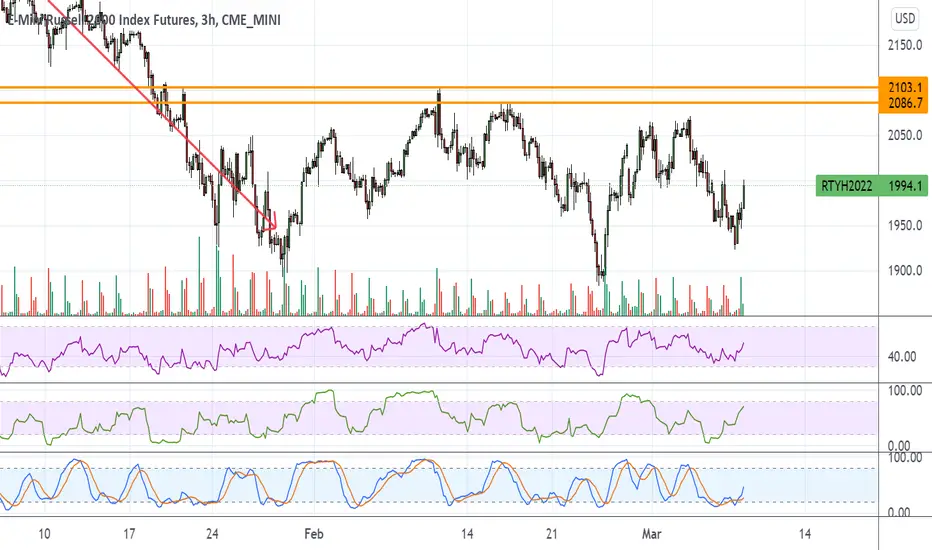
RTY UpdateRTY MFI almost overbought
My general rule is 3 days for a short squeeze, but I may be looking at puts if RTY MFI gets overbought tomorrow. Might do next week's puts to be safe, Fed meeting and what not. Not to mention I doubt anyone wants a long position over the weekend.
RTY1!
RTY MFI OversoldRTY MFI went oversold and now bouncing up. Indication of a melt up when RSI doesn't go oversold.
Odd thing is about half my board is red even though small caps are up 1.5%. That's really unusual, but looks like the garbage stock dump is done for the day.
Gotta headache so heading back to sleep, good luck
Think the Market is going to puke - RTY Down Down DownStocks are not looking good, getting warning signs like March 2020, think it's about to rug pull.

RTY OverboughtRTY now overbought on RSI and MFI as I predicted earlier this week. Looks like a melt up though, and I hate trading melt ups, no idea when it will end. Tomorrow? next week? who knows...

02-09-2022 Daily levels for Emini's Today pivot points in play for SPY are 453.73 ,444.69 and to an extent 459.77 as absolute resistance . SPY is handling the 444.69 level since past 4 days
one complex trendline is also coming into play as support . Daily MA 200D and 20D are acting as support .SPY gapped up nicely at 453.73. next stop is 459.77 . if on any negative note , it will turn offers down to 444.69 or below that . But absolutely not an inside day which is a good note for traders
Looking to see the market at open
YM Daily broke support 35293 and going up towards resistance @ 35896 AMEX:SPY
Can go LONG today , target resistance @YM
NQ has allsorts of resistance above this level. But its NQ it has the potential to travel places far out of reach 15037.25 is its immediate resistance for today which is 200 ma Daily. But actual resistance waiting at 15128 ,also make a note of 15335 level as next resistance .NQ support @14838.50
RTY , resistance at 2083.04 for today , support is far now . This is tricky. 1932 is RTY's support.
I prefer watching RTY in first place to understand the markets direction
AMEX:SPY
CBOT_MINI:YM1!

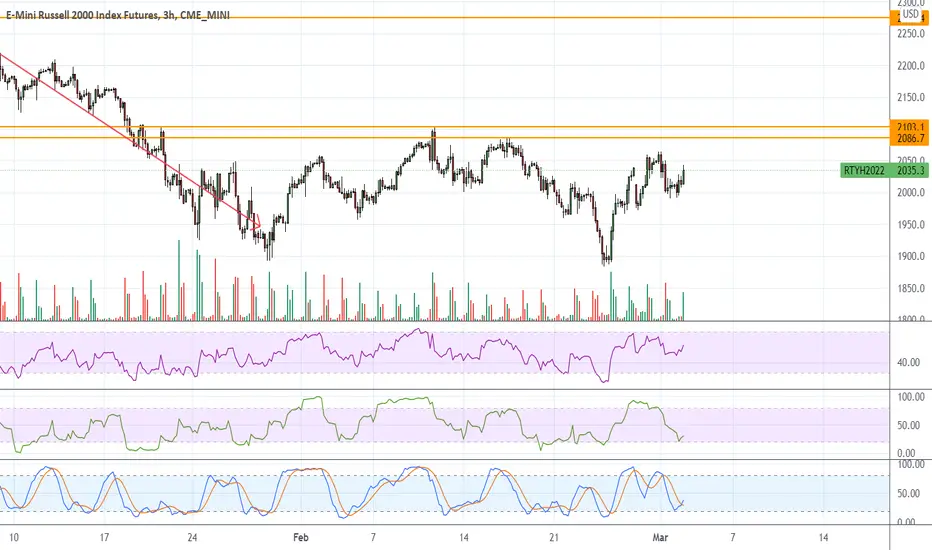
RTY Still OverboughtMFI overbought but it's still moving up. Maybe RSI needs to go overbought?
Market is just doing some weird stuff this week
RTY MFI also overboughtMuch more apparent on this chart, MFI is def overbought short term.
Not chasing anything today

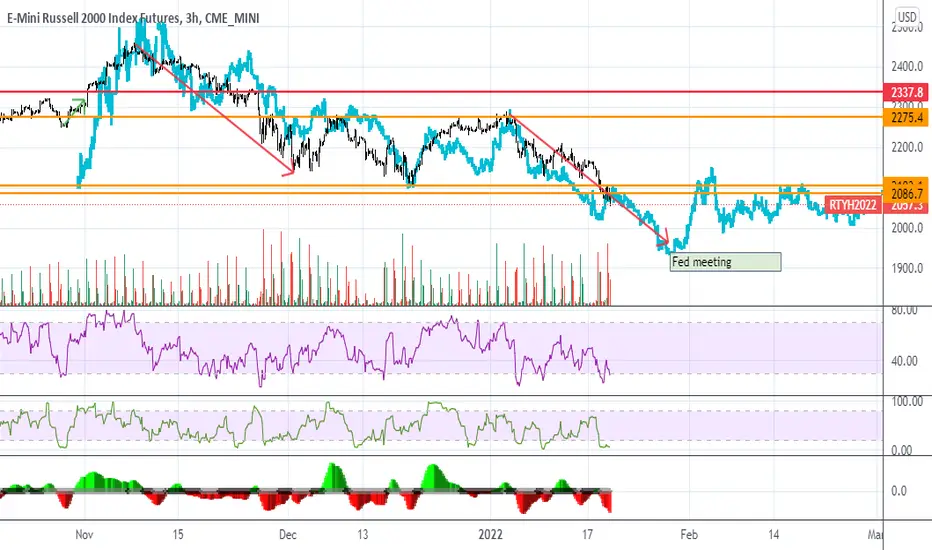
Russell 2000 Index - Canary in the Coal MineCurrently down nearly 20% from November 2021 ATH, $RTY1! has lost key support levels and is now below the entirety of ranges from 2021.
This futures index is signaling an increased potential for a broader market correction.

RTY MFI oversoldThe other indices are not there yet but RTY MFI is oversold.
Could be the first index to reverse, we'll see. ES and NQ charts imply a reversal either this afternoon or tomorrow but everything depends on AMZN earnings so no prdictions

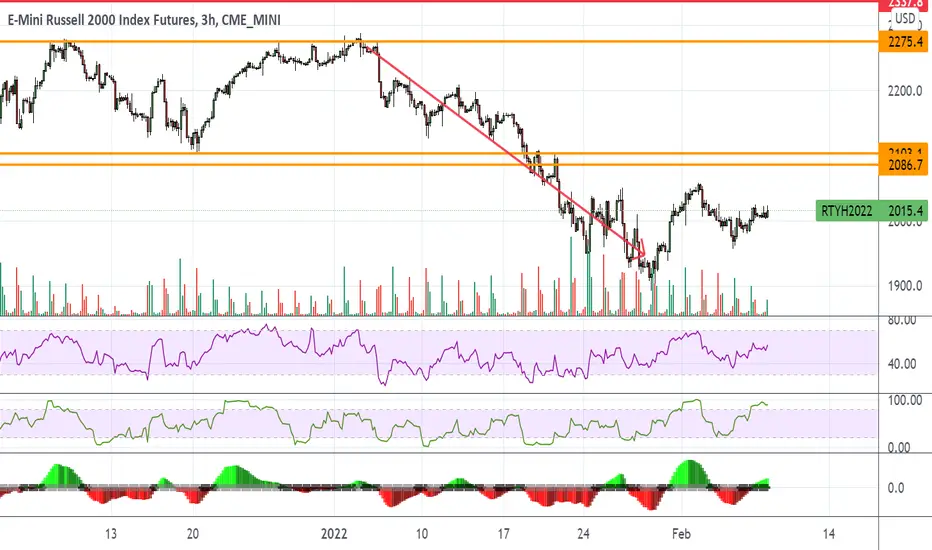
RTY UpdateIt's a long ways down before RTY MFI hits oversold and there appears to be no buyers for small cap stocks.
As has been the case the past year, small caps will be the weakest index. I'm predicting more flight to safety


Rvx undecided still holding bearishMy guess is the market is waiting for a fed meeting to decide the direction for me Rty looks ready to die a horrible death but we will see.
I'm bearish bias right now until we see some goo price movement in either direction, maybe a lower high on price movement or break down lower on the RVX. sending rty to retestance

RTY Neckline Test - FOMC EveRTY set the Higher Low after a break and cross of the 15 min8 EMA and MBB.

Russell Targeting Equality Objective at 1937In this update we review the price action in the Russell 2000 and identify the next high probability trading opportunities and price objectives.


RTY1!1.21.22 RTY1! : I think the Russell is trading lower to a level to be a buyer. (I also include a sermon about how markets move...free of charge).

𝗦𝗺𝗮𝗹𝗹-𝗰𝗮𝗽 𝗨𝗽𝗱𝗮𝘁𝗲: $IWM Daily. WARNINGConcerning chart. Looks like a backtest today ... as long as below 209 there's substantial risk to the downside
$RTY_F $AMC $CROX $SPY $ES_F $QQQ $NQ_F $VIX $TLT $TNX $DXY #Stocks #Trading 📉

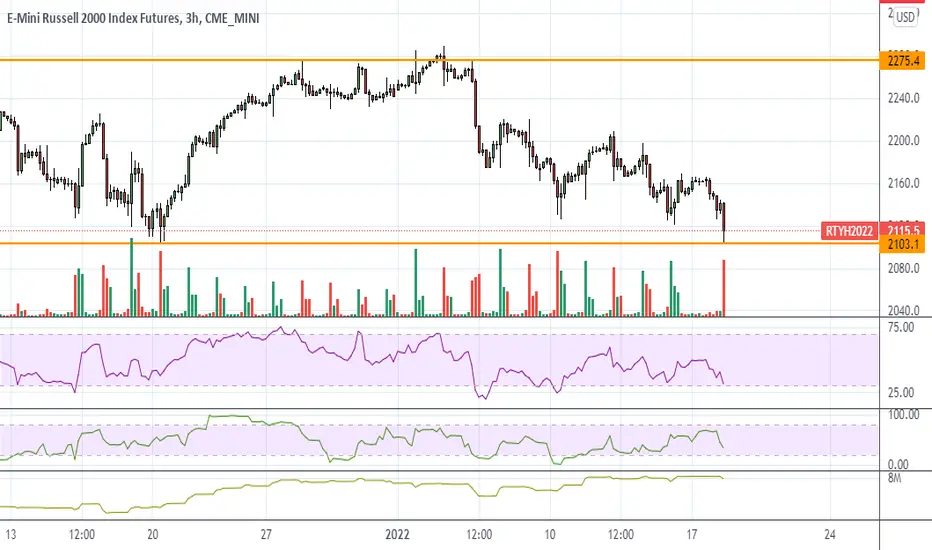
RTY UpdateOversold but that doesn't seem to matter anymore. Broke the support line today
If this is a bear flag or any other 2 step move then it appears small caps could tank until the Fed meeting. Then a Fed meeting pump.
Anyone wanna guess what the overlay is? Note, I did not change the time scale at all.
RTY UpdateMFI and RSI now oversold. Same with ES and YM. NQ RSI is not oversold yet.
I'd wait until teh market gains a little traction before going long though. I think the market gaps up and closes the gap tomorrow, so I might wait until tomorrow morning.

RTY One Hour Long IdeaThe RTY one hour time frame is still in a down
trend. The market is making lower lows and
lower highs. According to the daily time frame.
The market is expected to push bullish towards
2314.5 about +1,412 ticks above the market. It
will be a good idea to wait for the one hour time
frame to break the short term down trend line
and enter into the buy zone. Before looking for
long ideas.
Entry: Counter trend line break bullish in the
buy zone.
STOP: In the sell zone.
LIMIT: 2314.5
Once or if the market enters into the buy zone.
As long as the market stays in the buy zone. It
will be a good idea to turn to the five minute
time frame and to look for tunnel trader long /
Destination trader long opportunities.

ES1! - Opex Week Preview in 3DYhe 10Y Note Yield Gained 4.8% on Friday, topping out at 1.79%. The echoes from the pundits are calling for a return to value as high beta-growth has seen continued pressure, with ARKK leading the declines. NQ1! defended it's 4h Higher low on Friday with a hammer but remains in a 4h Real-Body Bear-Flag. In contrast RTY1! (Russell 2000) and YM1! (Dow Jones Industrial Average), set lower lows before their bounces. RTY1! is in a 4h bear channel, approaching the upper-bound. Vix lost steam at 22 finding support at 19. For consolidation to continue the path is a Daily H&S neckline break, in the most recent test of the largest expansion in the History of the Federal Reverse's Balance Sheet. This looks like a middle, with major markets offering divergent clues. Opex weeks have a way of offering abrupt clarity.

RTY UpdateFunny, NQ was the only index to go overbought but small caps look weak AF. Garbage stocks dropping again if you're a bearish trader.
