o' man o' man.if i'm right about this, so many people are going to so devastated.
most market participants are already completely and utterly distraught,
this rally could just simply set them over the edge.
---
i'm theorizing a full blown rally in the months ahead, right into april \ may.
---
russel200 expanded flat target sits right a the 1.75 algo, which is roughly at $2392
---
please don't treat this as financial advice.
consult your financial advisor before making any decisions in this market.
Rty1

RTY UpdateRSI hit oversold on RTY, ES, and NQ. MFI hasn't yet, so gonna wait to see what happens tomorrow.
My guess is still gap down and reversal tomorrow, but the gap down might not happen since RSI is already oversold. My favorite plays still look like crap and AAPL is falling off the tree, so no long positions until tomorrow and even that is a maybe.
RTY UpdateNQ filled the open gap but ES and RTY did not. I think RTY needs to go oversold before it bounces and fills.
Looks to me like the market is gonna whipsaw sideways this week. No melt up or tank. Powell speaks on Wed, CPE on Thu. Expect whipsaw.

Russel2000 Bear Case.Good evening,
This post is part of a series of requests i recently received.
The request was: "What is your bearish projection on the US stonk market".
---
The russel2000, if I'm not mistaken -
has thousands of small-cap stocks within it,
here's my bearish projection for it.
---
My estimated top for the russel2000 = $1876 ~ $2392
High probability target = $2036
---
My estimated bottom on this one is roughly between $1527 ~ $1163
High probability target = $1324
🔺

NYSE Index Bear Case.Good evening,
This post is part of a series of requests i recently received.
The request was: "What is your bearish projection on the US stonk market".
---
Some may ask,
what is the NYSE Index?
👇
The NYSE Composite is a stock market index covering all common stock listed on the New York Stock Exchange,
including American depositary receipts, real estate investment trusts, tracking stocks, and foreign listings.
---
My estimated top for the New York Stock Exchange Index sits at $15,546 ~ $18,545
High probability target = $16,600
---
My estimated bottom on this one is roughly between $12,293 ~ $10,064
High probability target = $11,319
---
🔺

Nasdaq Bear Case.Good evening,
This post is part of a series of requests i recently received.
The request was: "What is your bearish projection on the US stonk market".
---
Well, this right here is my primary bear case for the Nasdaq. Keep in mind, this is just a single bear case from my perspective; there's always many different potential outcomes, and it's my duty to discover them, and share them with you - the trader.
>Just because you are seeing this picture here today, does not mean this is what will happen .
---
Tuesday November 29th 2022 ~ December 21st 2022 = my calculated top for the Nasdaq.
Estimated to sit between $13,016 ~ $15,308.
High probability target = $13,697.
ps. if money rotates, or a proper catalyst appears, nasdaq could squeeze up to some of the higher targets on my chart to create a regular or expanded flat.
---
Friday May 12th 2023 ~ Tuesday October 24th 2023 = my calculated bottom.
Estimated to sit between $9449 ~ $7361.
High probability target = $8085.
---
🔺

Let's learn about flats.good evening,
in preparation for my next few bear posts,
i'd like to talk about the three different types of flats in the markets.
the main reason why i'm bringing this up right now,
is because the USA Indexes are displaying all three of these patterns currently,
so it's important to familiarize yourself with these fractals, for future references.
feel free to share this with your peoples if you find it helpful.
---
regular flats :
• A corrective 3 waves move labelled as ABC
• Subdivision of wave A and B is in 3 waves
• Subdivision of wave C is in 5 waves impulse / diagonal
• Subdivision of wave A and B can be in any corrective 3 waves structure including zigzag, flat, double three, triple three
• Wave B terminates near the start of wave A
• Wave C generally terminates slightly beyond the end of wave A
• Wave C needs to have momentum divergence
Fibonacci Ratio Relationship
• Wave B = 90% of wave A
• Wave C = 61.8%, 100%, or 123.6% of wave AB
---
expanded flats
• A corrective 3 waves move labelled as ABC
• Subdivision of wave A and B is in 3 waves
• Subdivision of wave C is in 5 waves impulse / diagonal
• Subdivision of wave A and B can be in any corrective 3 waves structure including zigzag, flat, double three, triple three
• Wave B of the 3-3-5 pattern terminates beyond the starting level of wave A
• Wave C ends substantially beyond the ending level of wave A
• Wave C needs to have momentum divergence
Fibonacci Ratio Relationship
• Wave B = 123.6% of wave A
• Wave C = 123.6% – 161.8% of wave AB
---
running flats
• A corrective 3 waves move labelled as ABC
• Subdivision of wave A and B is in 3 waves
• Subdivision of wave C is in 5 waves impulse / diagonal
• Subdivision of wave A and B can be in any corrective 3 waves structure including zigzag, flat, double three, triple three
• Wave B of the 3-3-5 pattern terminates substantially beyond the starting level of wave A as in an expanded flat
• Wave C fails travel the full distance, falling short of the level where wave A ended
• Wave C needs to have momentum divergence
Fibonacci Ratio Relationship
• Wave B = 123.6% of wave A
• Wave C = 61.8% – 100% of wave AB
---
-- full credit to elliottwaveforecast for all of these guidelines

RTY is at 200MA max resitance level is from 1900-19005Should not get above 1905 on any test for much lower numbers to be seen next year.
If it holds, might get below 1500 early next year.
Will short 1900-02 zone with a 10-15 points stop.
ideally we see a good move down to at minimum revisit pre CPI day close

RTY Daily MFI overboughtSomething I noticed while flipping through some charts, RTY1! daily MFI is overbought along with GM, PCAR, YM1! (Dow futures), Dow components like WMT, CAT, YNH, etc along with XLF (financial ETF).
Definitely not chasing a Fed pump even if my 3 hr indicators show oversold. My favorite stocks are overbought, that's a signal to take a pause. Will be shorting when 3 hr indicators go overbought.
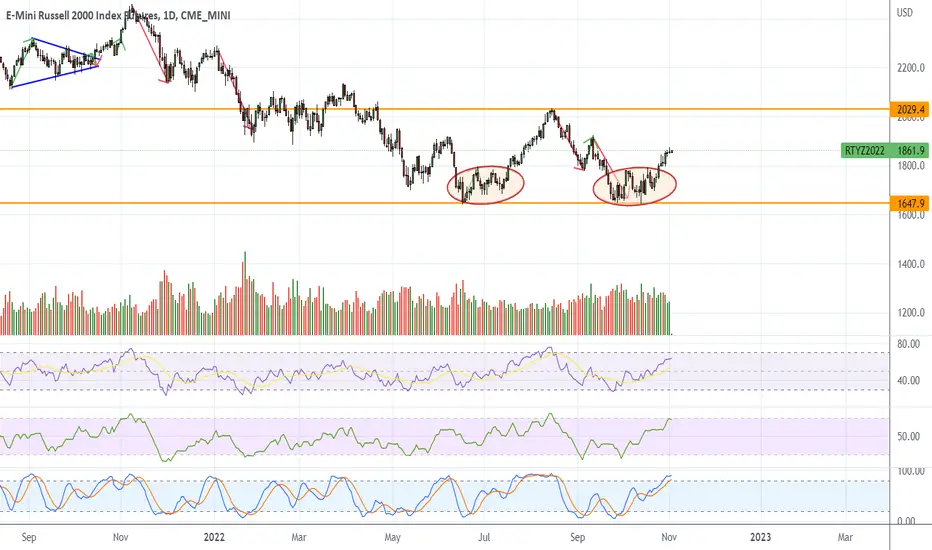
Market leadership firmly switched from nasdaq/s&p to Russel/Dow 2022 is story in change in market leadership.. Dow and Russel new leaders. Pairs trade lookback.

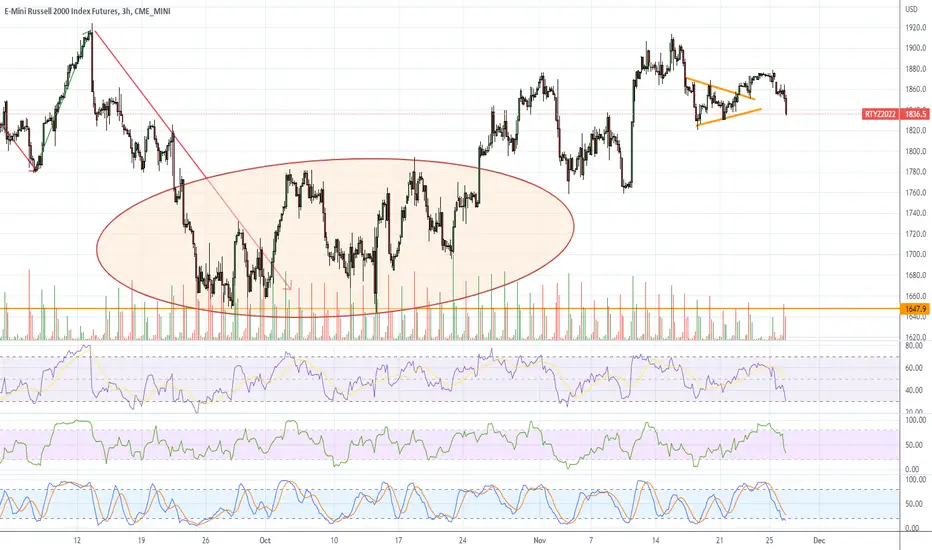
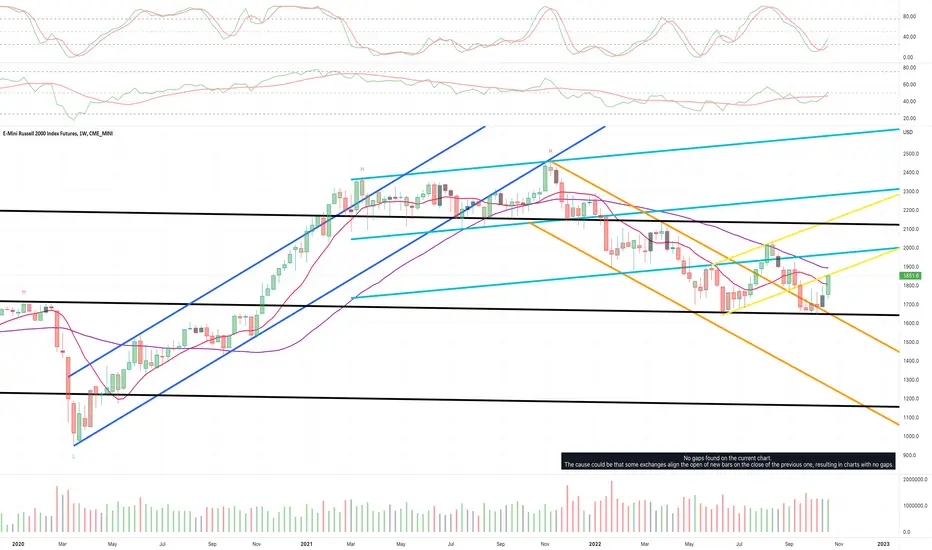
RTY1! - Weekly Market Update, 10/31Russell 2000 has overtaken its 50 day SMA and is now testing the YELLOW overhead resistance channel structure.
Russell1806 Target Achieved..New Pattern DevelopingTechnical & Trade View
Russell 2000 (e-mini futures contract)
Bias: Intraday Bullish Above Bearish below 1785
1806 Target Achieved..New Pattern Developing
Technicals
Intraday 1785 is primary support
Primary upside objective is 1882/92
Failure below 1780 opens a test of 1760 H4 Value Area High
20 Day VWAP bullish, 5 Day VWAP bullish

RTY UpdateWay overbought, but following my 4 day short squeeze rule as a lot of garbage stocks actually hit bottom Monday so that means short on Friday....
Just sitting around watching for now. Wouldn;t surprise me if we see a dip tomorrow though


RTY UpdateWound up being a 4 day short squeeze after all, like I said last week, I changed my focus to bankrupt companies and snagged W puts this morning. Closed out my winners and losers (from last week) and put the profits into W puts at a lower strike. Just some light trading in this weird market.
I think we could get a bounce here because ES and RTY MFI are oversold. Yields are exploding again and FDAX looks bearish so we may get a gap down tomorrow anyways.
TSLA earnings tonight. Focus should be on bankrupt companies, not gonna play the bigger companies.
RTY1! - Weekly Market Update, 10/17The indices had a rather wild week, the technicals are approaching being oversold. A bounce from here would not be unexpected as there is some consolidation occurring as price is currently hovering around the June low's area.
I'd like to see the market cycle back to an area of being overbought and finding a low risk confirmed area to short from. At this time I'm looking for thing's to setup again for a desirable entry.
I've adjusted support and resistance structures accordingly.

RTY LongsLooking to buy RTY for a run to the previous high. This is on the back of a bullish BoS on the 4H. Weekly bias is bearish and Daily is bullish to 1843.5.

RTY1! - Weekly Market Update, 10/10Russell futures have settled slightly above their June lows and are approaching BLACK channel support.
Support and resistance structures have been adjusted accordingly for your reference.

RTY UpdateThere's a good chance the market just whipsaws the next few days so watch out. See highlighted area

RTY UpdateOverbought on MFI and RSI on my short term chart, NQ and ES RSI are just barely touching overbought so gonna wait until tomorrow to short.
Slept in because I missed the long boat yesterday, lol. No positions. At this point it's a bit late to chase the pump.

RTY1!HELLO GUYS THIS MY IDEA 💡ABOUT RTY1! is nice to see strong volume area....
Where is lot of contract accumulated..
I thing that the Seller from this area will be defend this SHORT position..
and when the price come back to this area, strong SELLER will be push down the market again..
DOWNTREND + Support from the past + Strong volume area is my mainly reason for this short trade..
IF you like my work please like share and follow thanks
TURTLE TRADER 🐢

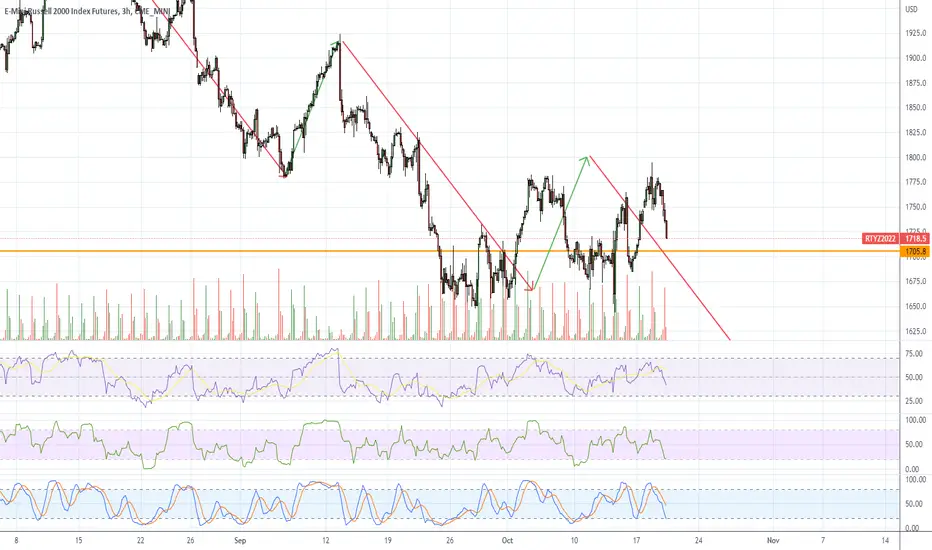
RTY - Reason Why I didn't short yesterdayFirst of all, I should've known EUro PMI was coming out, oops.
Anyways, I didn't short yesterday because RSI was touching oversold and this drop was already the same size as the previous drop. (Two red arrows) The fact that the drop is accelerating is bad news.

