RUNE at the Brink: Rebound Opportunity or Breakdown Incoming?🧩 Overview:
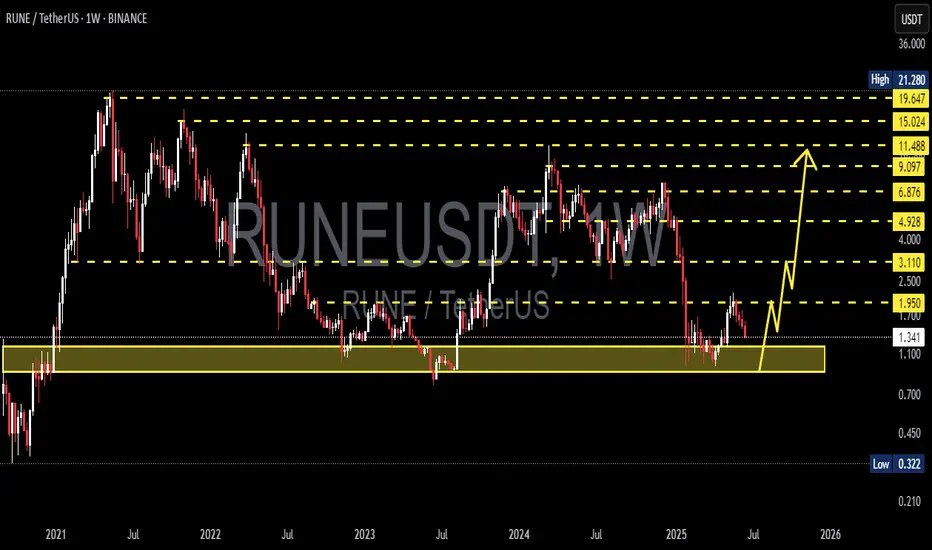
RUNE/USDT is currently hovering at a critical support zone — a historical demand area that has triggered strong bullish rallies in the past. Positioned between $1.00–$1.30, this level has been a battle ground between buyers and sellers. The big question now: Will RUNE bounce for a bullish reversal or break down into deeper lows?
---
🔍 Key Levels Identified:
Major Support Zone (Demand Area): $1.00 – $1.30 (yellow box)
Immediate Resistance: $1.95 → $3.11 → $4.92
Extended Bullish Targets: $6.87 → $9.09 → $11.48 → $15.02
Deeper Bearish Targets (if support fails): $0.80 → $0.55 → $0.32
---
🟢 Bullish Scenario (Recovery Rally):
📌 Key Signal: Strong hold and price reaction above the $1.00–$1.30 zone.
1. Reversal Patterns: Look for double bottom, bullish engulfing, or strong weekly pin bars to signal a potential reversal.
2. Momentum Confirmation: A breakout above $1.95 with high volume could trigger a strong continuation to $3.11 and $4.92.
3. Macro Tailwinds: A broader recovery in Bitcoin and the crypto market could enhance bullish pressure on altcoins like RUNE.
🎯 Mid to Long-Term Bullish Targets:
$3.11 → $4.92 → $6.87+
Potential upside of 200–400%+ from current levels if bullish structure confirms.
---
🔴 Bearish Scenario (Breakdown):
📌 Critical Risk: Weekly candle close below $1.00 with volume confirmation.
1. Support Breakdown: If $1.00 fails, price may revisit previous lows around $0.80 or even test historical demand levels at $0.32.
2. Bearish Continuation Pattern: Sustained lower highs and lower lows suggest downtrend continuation unless invalidated.
3. Volume Pressure: Heavy sell volume on breakdowns reinforces bearish bias.
⚠️ Bearish Targets: $0.80 → $0.55 → $0.322 (historical low)
---
🔄 Pattern & Structure:
Historical Accumulation Zone: The yellow box has been a long-term accumulation area since 2021.
Repeat Behavior: Previous touches to this zone sparked multi-week rallies.
Potential Wyckoff Accumulation: If price forms a sideways range with rising lows, this may be the early stage of a markup phase.
---
🧠 Strategic Outlook for Traders:
✅ Bullish Strategy:
Conservative entry: Wait for breakout + retest of $1.95
Aggressive entry: Accumulate within $1.00–$1.30 zone with tight stop below $0.98
❌ Bearish Strategy:
Short setup on confirmed breakdown below $0.98
Avoid trading without confirmation of direction (no FOMO)
---
🚀 Conclusion:
RUNE is standing at a make-or-break level — a tipping point between a bullish breakout or further bearish pressure. Smart traders don't just predict direction; they prepare for both outcomes. This is not just a technical zone — it's the market’s decision point.
#RUNE #RUNEUSDT #CryptoAnalysis #AltcoinWatch #BreakoutSetup #DemandZone #TechnicalAnalysis #CryptoOutlook #BullishScenario #BearishScenario #Wyckoff
Rune

RUNE : Ready to pump?Hello friends🙌
👀According to the price drop, you can see that the price has reached an important area, which, according to the pattern formed, if the specified resistance is broken, we can enter with risk and capital management and move to the specified targets.
🔥Follow us for more signals🔥
*Trade safely with us*

RUNE (Y25.P2.E1).Looking to short the macroHi Traders,
RUNE has some more highs to do, however based on the structure, I would not bet it will go much. My interests is finding that trade to short when it comes to Alt coins.
With my TA approach, Wave 5 might just equal Wave 1 length. Along with some confluences of FVP levels, we might just get this right. Time will time.
All the best,
Regards, S.SAri

THORChain 1,784% Profits Potential & Technical AnalysisHere we can see THORChain sandwiched in-between EMA89 and EMA55. The action is not happening above EMA89 but this shouldn't be considered bearish, more like "we are not there yet." Or, "still consolidating but with a bullish bias."
The bias is bullish because the low came in early February 2025. So that is more than 5 months ago. A bearish trend or bearish continuation would require lower lows in those 5 months. The fact that after the low in February there was a small recovery and this recovery ended as a higher low on the retrace, means the downtrend reached its end. Since the downtrend is over, we are seeing consolidation, accumulation before the market turns. The turning is the bullish cycle, the uptrend. And we are in the process of seeing this change materialize into the market, price and chart.
The minimum target is the "baseline level" between $7.44 and $6.20. The target to aim for should be $18 and if you are feeling optimistic then $28. I've seen this project grow incredibly strong in the past so I wouldn't be surprised if it ends up moving even higher.
This is a simple chart. What goes down, must come back up; specially when we are talking about Crypto. The best financial market in the whole world. Young, but highly profitable. Risky? I don't know... It is risky to be young. But the potential rewards make up for any risk the market carries. We can take risk when we are young. We should. You play it safe because you are old. No risk, no fun. Plan ahead, success is yours.
Namaste.

RUNEBTC Grew 51,782% in 2021 — Is 6,000% Possible in 2025?Would you like to know something crazy? Just say yes....
THORChain grew 51,782% vs Bitcoin in 665 days. RUNEBTC. Between July 2019 and May 2021.
Now, let me ask you another question. Do you still think that 1,000%, 2,000%, 3,000% is something crazy or out of this world? Looking at how Crypto behaved in the past, we know this is not only possible no, such numbers are not even normal, they might be too low. We might be underestimating the market when we saw 834% potential for growth for example.
Of course it will be go higher... All the top project are getting their own ETFs. The world is evolving towards Crypto.
Listen to me, pay attention. It is not that people are buying Crypto and will trade Crypto to make some money, etc. It is the entire financial system that is called 'Cryptocurrencies'. It is the end of the world basically. It is a new technology.
Just as WiFi took over landline and all that stuff;
Just as email took over mail;
Just as the Internet took over... Telepathy? I don't know.
What I am trying to say is that whatever system we had in the past, everything continues to evolve. It is not something incredible or extraordinary, we were due a monetary upgrade. It is here now. We are all Crypto because we know that paper money is just too old.
Let them close all of my bank accounts... Go ahead!
We have Cryptocurrency now. You can't block us anymore.
Money is free now. Money is freedom.
THORChain has huge potential for growth.
Thanks a lot for your support.
Namaste.

RUNEUSDT 1W AnalysisRUNE ~ 1W Analysis
#RUNE Buy back gradually from here with a short term target of at least 20%+ from this support block.
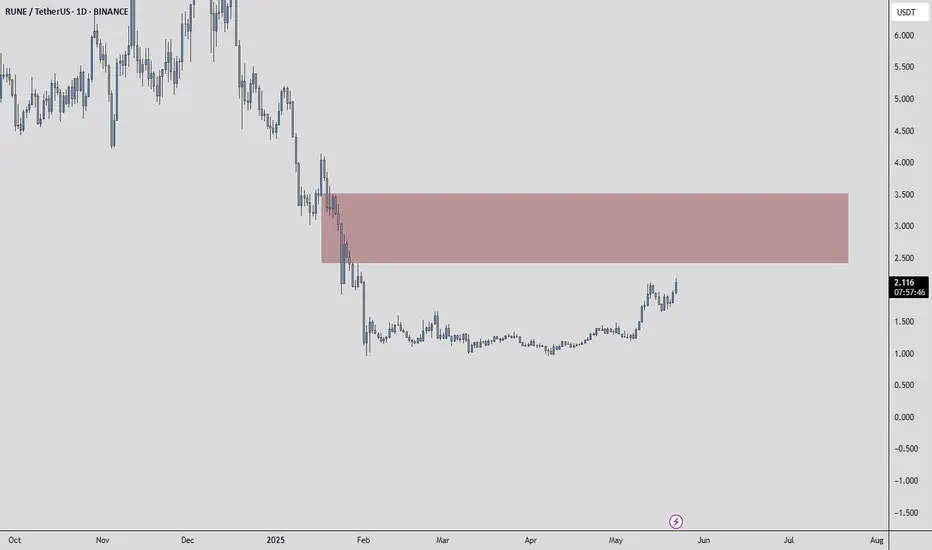
RUNEUSDT | Red Box Sell Wall Still HoldingRUNEUSDT is currently facing a strong resistance zone, clearly marked by a heavy sell wall inside the red box .
Until that level is broken with volume and confirmed as support, my bias remains negative and I stay short-focused .
“I will not insist on my short idea. If the levels suddenly break upwards and do not give a downward break in the low time frame, I will not evaluate it. If they break upwards with volume and give a retest, I will look long.”
No need to predict. Let the structure guide you.
📌I keep my charts clean and simple because I believe clarity leads to better decisions.
📌My approach is built on years of experience and a solid track record. I don’t claim to know it all but I’m confident in my ability to spot high-probability setups.
📌If you would like to learn how to use the heatmap, cumulative volume delta and volume footprint techniques that I use below to determine very accurate demand regions, you can send me a private message. I help anyone who wants it completely free of charge.
🔑I have a long list of my proven technique below:
🎯 ZENUSDT.P: Patience & Profitability | %230 Reaction from the Sniper Entry
🐶 DOGEUSDT.P: Next Move
🎨 RENDERUSDT.P: Opportunity of the Month
💎 ETHUSDT.P: Where to Retrace
🟢 BNBUSDT.P: Potential Surge
📊 BTC Dominance: Reaction Zone
🌊 WAVESUSDT.P: Demand Zone Potential
🟣 UNIUSDT.P: Long-Term Trade
🔵 XRPUSDT.P: Entry Zones
🔗 LINKUSDT.P: Follow The River
📈 BTCUSDT.P: Two Key Demand Zones
🟩 POLUSDT: Bullish Momentum
🌟 PENDLEUSDT.P: Where Opportunity Meets Precision
🔥 BTCUSDT.P: Liquidation of Highly Leveraged Longs
🌊 SOLUSDT.P: SOL's Dip - Your Opportunity
🐸 1000PEPEUSDT.P: Prime Bounce Zone Unlocked
🚀 ETHUSDT.P: Set to Explode - Don't Miss This Game Changer
🤖 IQUSDT: Smart Plan
⚡️ PONDUSDT: A Trade Not Taken Is Better Than a Losing One
💼 STMXUSDT: 2 Buying Areas
🐢 TURBOUSDT: Buy Zones and Buyer Presence
🌍 ICPUSDT.P: Massive Upside Potential | Check the Trade Update For Seeing Results
🟠 IDEXUSDT: Spot Buy Area | %26 Profit if You Trade with MSB
📌 USUALUSDT: Buyers Are Active + %70 Profit in Total
🌟 FORTHUSDT: Sniper Entry +%26 Reaction
🐳 QKCUSDT: Sniper Entry +%57 Reaction
📊 BTC.D: Retest of Key Area Highly Likely
📊 XNOUSDT %80 Reaction with a Simple Blue Box!
📊 BELUSDT Amazing %120 Reaction!
📊 Simple Red Box, Extraordinary Results
I stopped adding to the list because it's kinda tiring to add 5-10 charts in every move but you can check my profile and see that it goes on..
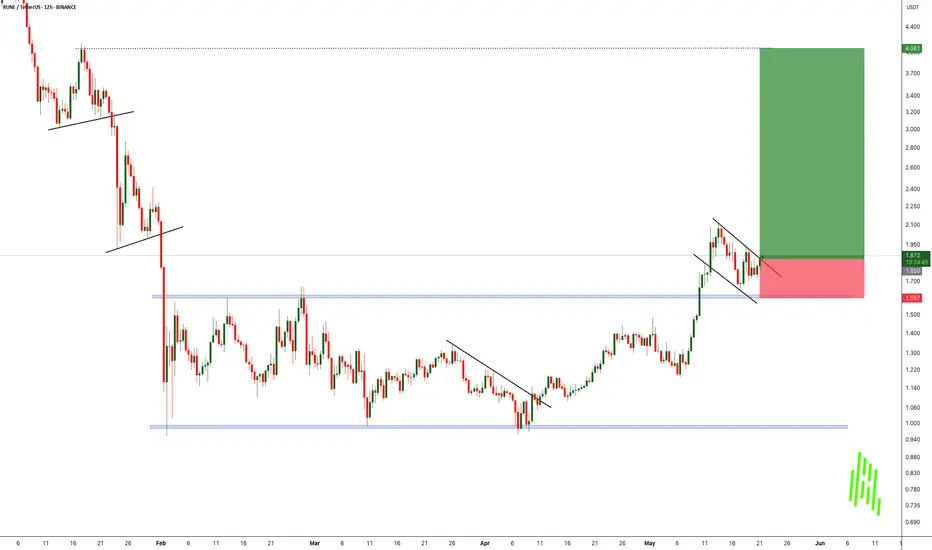
RUNEUSDT Breakout and Bull Flag Forming!!After nearly three months of tight consolidation, BINANCE:RUNEUSDT has finally broken out of its range-bound “box” structure. a powerful sign that the market is ready to move. This type of breakout often signals the end of indecision and the start of a strong directional trend.
What makes this setup even more exciting is the formation of a bull flag pattern right after the breakout. Known as a classic continuation pattern, the bull flag usually signals that the asset is simply pausing before its next leg up. The tight pullback within the flag is showing low-volume correction. A bullish sign that buyers are still in control.
With this confluence of a range breakout followed by a bull flag, BINANCE:RUNEUSDT is flashing all the signs of a potentially explosive move to the upside. However, it’s important to stay disciplined – always manage your risk and keep stop losses in place below the flag structure or previous support levels.
Next move could be strong. Stay sharp and ride the wave!
BINANCE:RUNEUSDT Currently trading at $1.87
Buy level : Above $1.86
Stop loss : Below $1.6
Target 1: $2.2
Target 2: $3
Target 3: $4
Max leverage 3x
Always keep stop loss
Follow Our Tradingview Account for More Technical Analysis Updates, | Like, Share and Comment Your thoughts
Thorchain "Back To Baseline" Easy 280% Profits TargetThorchain (RUNEUSDT) is no longer bearish, the bullish bias is now fully confirmed and this statement is supported by many chart signals. Let's look at those.
First, there is a strong and classic reversal bottom formation, the Adam & Eve pattern.
This pattern was completed when RUNEUSDT moved above its base (black line on the chart).
This pattern on its own is a strong reversal signal but that is not all, today RUNEUSDT is moving above EMA89 and recently conquered EMA55 daily for the first time as resistance. This is happening with three green daily candles and the strongest bullish momentum since March 2024.
Current action is indicative of so much more to come, but here we will focus on something basic and simple, the "baseline."
This is a very easy target, RUNEUSDT is set to test the December 2024 resistance zone, the price zone from where it took the plunge. Obviously, this resistance will break after some challenge easy, but this is the first and main level that will be tested on this bullish wave. That's a very easy 280% profits target in the coming months, very easy with a strategy based on buy and hold. You can't go wrong. You will be happy with the results.
Thorchain will grow, Bitcoin will grow, the Altcoins will continue growing and what you are witnessing now, is only the start.
Thanks a lot for your continued support.
Namaste.

RUNE/USDT : BUY LIMITHello friends
Given the growth in price and the entry of buyers, now that the price is in the ascending channel, we can buy in stages and with risk and capital management and move towards the specified goals.
*Trade safely with us*

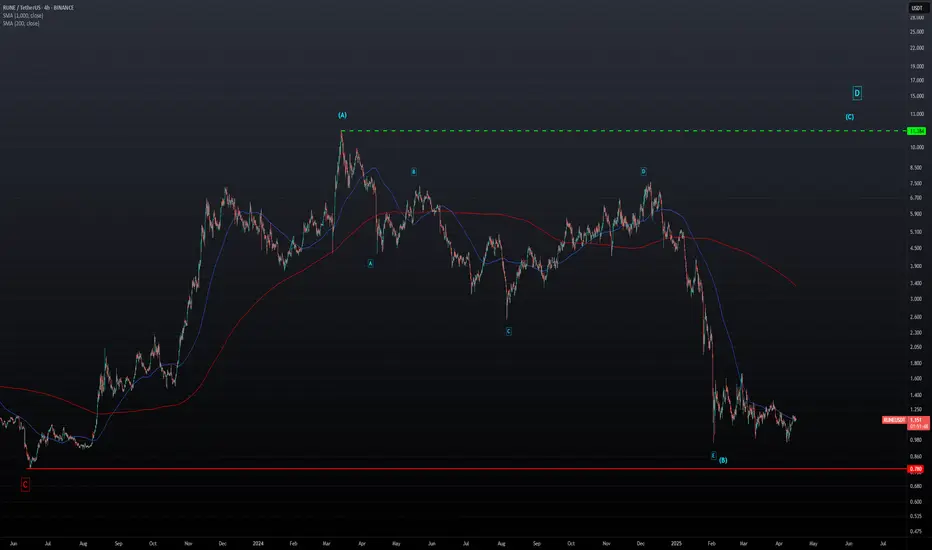
THORCHAIN - Do You Think It's Possible?Could this count actually be valid? It might seem like a stretch given the sharp drop we just saw—but what if Wave D still needs to play out? Is it possible we see the RUNE token hit $11 again in this cycle?
It doesn’t sound so far-fetched if you’ve been following the Bitcoin pattern I mentioned in my recent post about AVAX (linked below). At the end of the day, it all comes down to solid risk management to see how this plays out.
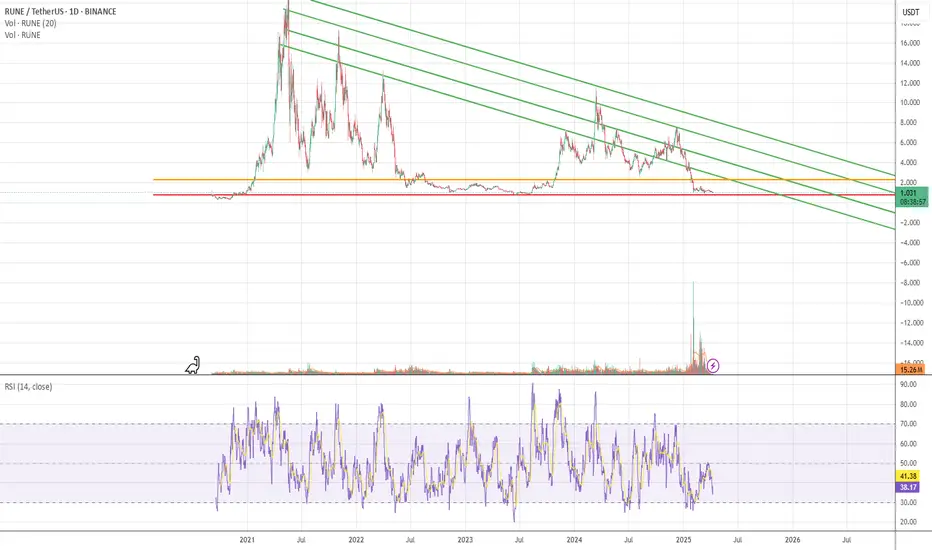
RUNE - Make or break ...RUNE is currently in a prolonged downtrend, respecting the descending resistance lines since its peak. Price is now approaching a critical horizontal support zone:
🔴 Key Support: $0.75
🟠 Minor Support Zone: $1.00 – $1.10
🟢 Major Resistance Levels:
$2.50 (First trendline test)
$4.00 (Second trendline)
$6.00+
The price action is compressing near the lower boundary of the descending channel, while RSI is drifting toward oversold levels (RSI ~37.85). Historically, RUNE has seen relief rallies from this region.
⚠️ Scenarios to Watch:
Bullish:
Price holds above $0.75 and RSI enters oversold territory.
Break and close above $1.10 could trigger a relief rally toward $2.50.
Confirmation would come with increasing volume and break of descending trendline.
Bearish:
Breakdown below $0.75 support could open doors for further downside.
Possible targets below $0.75: psychological levels at $0.50 or lower, especially if volume increases on the breakdown.
📈 RSI Indicator:
RSI nearing oversold, currently ~37.85.
No confirmed bullish divergence yet, but worth watching closely for potential reversal signals.
🧩 Strategy Notes:
Conservative traders: Wait for reclaim of trendline and a close above $1.10–1.20 for safer entry.
Aggressive traders: Look for bullish RSI divergence or price action confirmation around $0.75 for a potential bounce play.
Risk management is crucial — set tight stop losses below critical levels.
🎯 Summary:
RUNE is at a make-or-break zone. $0.75 is a crucial historical support. A bounce from here could send the price towards the first resistance at $2.50, while a breakdown may lead to further bearish momentum. Watch RSI and volume for clues!
THORChain: Your Altcoin ChoiceTHORChain (RUNE) looks great, for buyers. Right now the action is happening right above a major low, the November 2022 low.
RUNEUSDT hit a major low in November 2022 together with Bitcoin. It then went on to produce a lower low that was followed by a ~1,400% bullish wave. This is only the preview pre-bull market year. In this bull-market year, growth should be much stronger.
Much of this bullish wave has been erased, corrected and now RUNEUSDT stands above long-term support. This is the buy-zone, a long-term buy-zone. The accumulation zone.
This is a great place/price to buy-up, buy-in, rebuy and reload. Buy, buy, buy, buy focusing on the long-term. This is truly a great opportunity and entry price. We do not focus on the fact that prices are dropping nor the short-term. We focus on the future and the potential we have for growth.
Just as the 2022/2023 bearish cycle produced a major bullish phase; this strong correction we are seeing now in early 2025 will launch the next bull market, growth will be many times bigger compared to the last wave.
This is a good one. You are wise if you are looking at this pair.
Thanks a lot for your continued support.
RUNEUSDT (THORChain), Your TOP Altcoin Choice.
A strong and solid target for this cycle can be $30. It can go higher just as it can reach lower, but this is a good level to look for. A good price to use as a reference point.
Namaste.

TradeCityPro | RUNE: Decoding Its Descent in DeFi Markets👋 Welcome to TradeCity Pro!
In this analysis, I want to discuss the RUNE coin, which was requested in the comments of yesterday's analysis. This project is one of the DeFi projects, with a market cap of $383 million, ranking 118th.
📅 Weekly Timeframe
In the weekly timeframe, as you can see, it has started a downward leg from the peak of 6.894 and is moving downwards, reaching the area of 1.110.
✔️ Currently, it seems that the downward momentum has slightly decreased, and the price is moving downward more slowly. The RSI oscillator is also near the 30 area, ready to enter into Oversell and introduce a new downward momentum into the market.
💫 If this occurs and the price consolidates below 1.110, the next support will be 0.816, which is a very important floor, and if this area breaks, the last support the price will have is 0.386.
🔑 On the other hand, if the price is supported at 1.110 and breaks the trend line that the price has, we can confirm a trend change and the start of a new upward trend. The main trigger will still be 6.894.
📅 Daily Timeframe
In the daily timeframe, the price has a range box between 1.091 and 1.504, and after the downward leg following the break of 3.210, it has now entered a ranging phase and is ranging in this area.
🔽 For a short position, given that the price has hit a lower high compared to 1.504, the likelihood of breaking the floor of the box is high, and with the break of 1.091, we can enter a short position.
📊 An important point is that the market volume in this range box has decreased significantly and keeps decreasing. With the entry of volume in any direction, the market can start moving in that direction.
📈 If buying volume enters the market, the first long trigger is the break of the 1.504 area. This area overlaps with the 0.236 Fibonacci, and breaking this area, the next important levels are 0.382, 0.5, and 0.618 Fibonacci.
📝 Final Thoughts
This analysis reflects our opinions and is not financial advice.
Share your thoughts in the comments, and don’t forget to share this analysis with your friends! ❤️

RUNEUSDT 1WRUNE ~ 1W Analysis
#RUNE Buy gradually from here with a short -term target of at least 20%+.

Rune is going to bounce backRune is sitting in potential bouncing support BYBIT:RUNEUSDT
Entry 3.70
Target 5.00
Stop 2.49

RUNE Long OpportunityMarket Context:
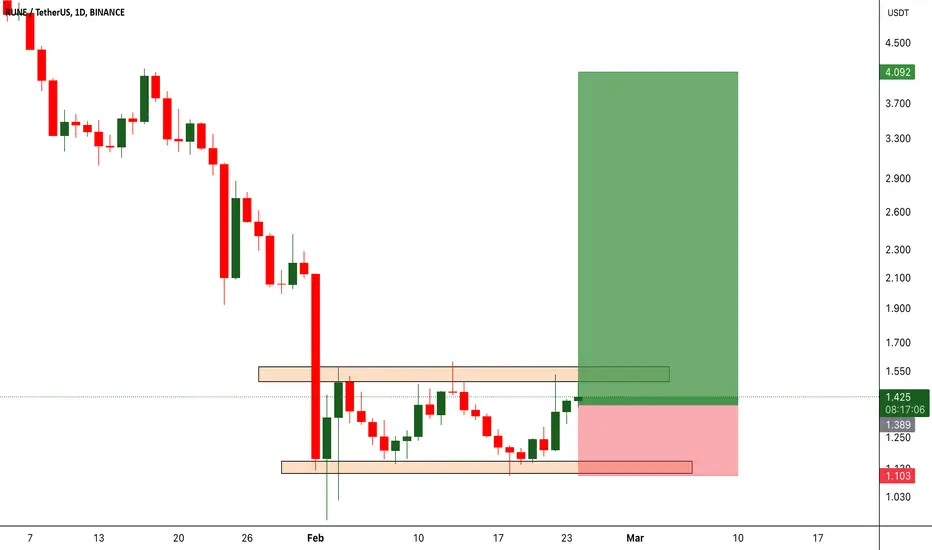
RUNE has been trading within a range for the past few weeks, and price has now retraced to the lower support level of this range. This presents a solid opportunity for a long entry targeting the next resistance levels.
Trade Details:
Entry Zone: $1.18
Take Profit Targets:
$1.30 - $1.35
$1.45 - $1.60
Stop Loss: Just below $1.10
This setup offers a strong risk-to-reward ratio, with potential for range-bound trading before a breakout. 🚀

Rune - Thorchain: A Mid-Term Opportunity Too Good to IgnoreThorchain (RUNE) presents a compelling short-to-midterm opportunity that’s hard to pass up. Despite reports suggesting that North Korean hackers have used it to launder stolen Ethereum, the technical indicators are extremely bullish.
Volume: One of the highest levels we've seen in a long time.
RSI: Oversold on the weekly chart, signaling a strong potential for a rebound.
Midterm Target: A 5x to 6x increase.
This looks like the best buying opportunity at the moment—unless I’m overlooking something fundamental. If I am, feel free to share your thoughts in the comments. Thanks!

RUNE sell/short setup (4H)The RUNE token, after experiencing heavy drops due to negative news, is now trading within a range.
A price top has been fake out, leading to a drop. On a retracement to higher levels, we can look for a sell/short setup.
We have identified two entry points for a short position.
Targets are marked on the chart.
A daily candle closing above the invalidation level will invalidate this view.
For risk management, please don't forget stop loss and capital management
Comment if you have any questions
Thank You

THORChain Bullish Confirmed: 361% Back To Baseline PotentialWhen a Cryptocurrency trading pair moves and closes daily above EMA13, this confirms a bullish bias. The longer the moving average the stronger the signal/confirmation.
Here we are looking at RUNEUSDT (THORChain) and we can see a move and close above EMA13 and EMA21. The move above EMA21 happened today and this one is confirmed only when the session (daily candle) closes above this level.
EMA13 is a short-term exponential moving average when it comes to Cryptocurrency trading charts. A move above this level signals the change of a bearish bias towards a bullish one.
The fact that RUNEUSDT is moving also above EMA21 fully confirms the short-term bullish signal given by the break above EMA13. In simple terms, we are going up —bullish confirmed.
When there is a strong drop, as shown in this chart, there is always a counter move "back to baseline." The baseline here is the last high because of a double-top between May and December 2024.
Back to baseline would give us a minimum of 361% potential for growth. This is short-term. There is sure to be more, much more because we are in a bull-market year. Prepare for massive growth. This is an easy chart, an easy trade.
Thank you for reading.
Your continued support is highly appreciated.
Namaste.

RUNEUSDT: The Unstoppable Breakout? Eyes on the Resistance!BINANCE:RUNEUSDT has been showing remarkable strength while the broader market struggles, repeatedly holding support and now pushing towards a key resistance level. This consolidation phase suggests a potential explosive move ahead. A breakout above this major resistance could trigger strong bullish momentum, making BINANCE:RUNEUSDT unstoppable in the short term. Volume confirmation will be crucial, as increasing buying pressure could validate the breakout and fuel further gains. However, risk management is essential false breakouts are always a possibility, so setting a stop loss just below recent support levels is key to protecting capital. All eyes are now on the breakout level. if BINANCE:RUNEUSDT clears it with conviction, it could be a high-potential trading opportunity. Trade smart, stay disciplined, and always keep your stop loss in place.
BINANCE:RUNEUSDT Currently trading at $1.41
Buy level: Above $1.4
Stop loss: Below $1.1
Target : $4
Max Leverage 3x
Always keep Stop loss
Follow Our Tradingview Account for More Technical Analysis Updates, | Like, Share and Comment Your thoughts
RUNEUSDT Strong Support Zone – 300%-400% Gains Potential!RUNEUSDT is currently trading at a strong support level, which presents a significant opportunity for potential upside. Support levels act as critical price points where demand is expected to be strong enough to prevent further declines. The fact that RUNEUSDT is holding well at this support level suggests that the price may reverse course and initiate a rally. With solid volume backing this level, there is a good chance that RUNEUSDT could see substantial gains in the coming weeks, with projections of 300% to 400%+ if the price rebounds and continues to surge from here.
The support level is crucial as it indicates that buyers are stepping in and absorbing the selling pressure, preventing the price from breaking lower. The good volume accompanying this consolidation adds to the strength of this support zone, making it more likely that RUNEUSDT will bounce higher once it consolidates further. The growing investor interest suggests that traders are starting to recognize the potential in this project, which could trigger a wave of buying pressure once the price moves past key resistance levels. With the projected gains of 300% to 400%+, this makes RUNEUSDT an asset to keep an eye on for those looking to capitalize on potential explosive moves.
RUNEUSDT's position at the strong support level also indicates that the current downtrend might be coming to an end. If the price successfully breaks above the resistance level that has formed after the support zone, it could signal the beginning of a significant upward trend. This is supported by the increasing investor interest in the project, which further suggests that market sentiment is turning positive. If the price rebounds and gains momentum, the target of 300% to 400%+ is within reach, making this an exciting setup for traders looking for high-reward opportunities.
Investors should keep a close watch on RUNEUSDT as it holds at this critical support level. A successful bounce off this level, combined with strong volume and buying interest, could signal the start of a major rally. With the potential for significant returns and an improving market sentiment around this crypto pair, RUNEUSDT presents a promising opportunity for those seeking high-potential trades in the market.
✅ Show your support by hitting the like button and
✅ Leaving a comment below!
Your feedback and engagement keep me inspired to share more insightful market analysis with you!

Very good chart RUNERune
It has a chart similar to Floki and can climb from that area to the specified gap area
You can use 5 to 7 leverage in this transaction
