running fibsin the last cycle it seems like it had a hard time passing around the .618 line too, small correction to get a steady rsi again and another leg up should be in action
Rune

RUNE at support, Good EntryRUNE is now at the support zone. This is a good opportunity for the short term. All DeFi coin is doing good and we see a good pump in RUNE also.
buy zone: around $4.20
Target: $4.65 - $5.1 - $5.65


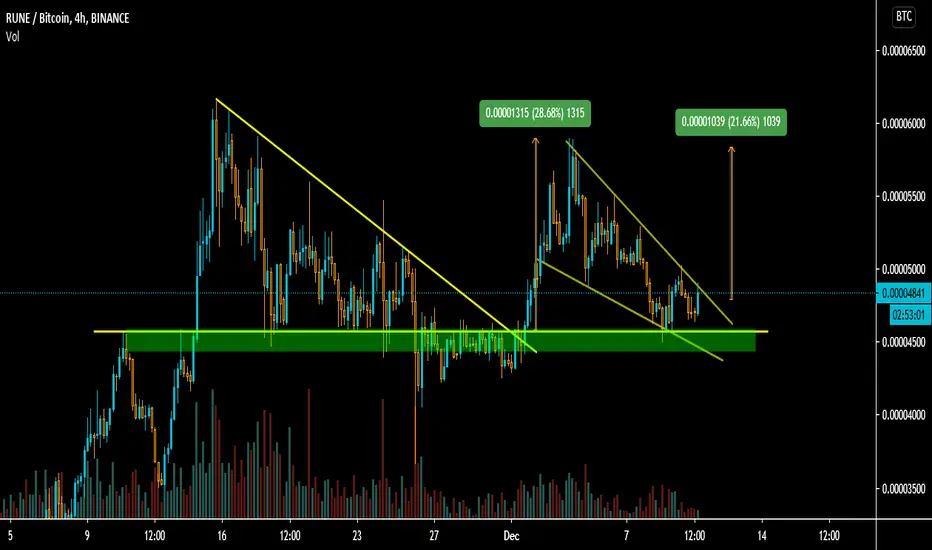
THORchain token RUNE might be ready for the next leg upTHORchain is ready to break above. If it will break the strong resistance and falling wedge it might experience a strong impulse up.
Good luck.


Analysis in an optimistic scenario for the next moments in RUNETechnical analysis regarding the price of THORCHAIN in relation of dollar Tether for the next scenarios, based on 4 hour movement.
disclaimer
*** In accordance with CVM Instruction No. 598, of May 3, 2018, Art. 21, I declare that the recommendations of this analysis reflect solely and exclusively my personal opinions and perceptions and that they were prepared independently and autonomously. Not being considered a purchase and/or sale recommendation. ***

Expect more sheddingAfter falling below support at two points below support you can log
If Bitcoin drops more, please be careful and open a small position


RUNEUSDT - Breakout potential on 4 hour chartRune is looking good for a breakout and continue the uptrend.
There is a bullish acending triangle with a flat top with the $3.60 line providing support and $4.20 resistance.
The 50MA has provided good support for Rune and is forming the acending line in our triangle. Look for the price to meet it and bounce to new highs.
The MACD histogram is beginning to flip and we have a bullish cross coming in play.
The Fib extension gives us a target of the $5.50+ range.
This has been a pretty common pattern recently, so hoping this plays out the same way as I have seen it play in other coins.

RUNEUSDT (Resistance line breakout in 1h chart)RUNEUSDT (1H CHART) Technical Analysis Update
Resistance line breakout
RUNE/USDT currently trading at $4,15
Buy-level: Above $4.00 - $4.20 (Wait for the small retracement)
Stop loss: Below $3.770
Target 1: $4.80
Target 2: $5.40
Max Leverage: 3X
ALWAYS KEEP STOP LOSS...
Follow our Tradingview Account for more Technical Analysis Update, | Like, Share and comment your thoughts.

RUNEBUSD respecting the bullish channel. Projections of bullishTechnical analysis regarding the price of THORCHAIN in relation of dollar Binance for the next scenarios, based on 4 hour movement.
Price forming rising funds / tops, with the Exponential Moving Averages of 34 and 89 periods driving the price and, it is walking respecting this upward channel.
By projecting a FIBONACCI in that leg that the price gave, I manage to obtain the levels where the price can reach!
disclaimer
*** This is not a recommendation to purchase and/or sale. It is for educational purposes only. ***


✳️THORChain/USDT Analysis (23/1) #RUNE $RUNEAfter the strong dump yesterday, RUNE has recovered very strongly with very good buying power. If RUNE closes 1Day candlestick above $2 zone, it will rise to $2.8 zone by the end of January.
📅NEWS
👉Jan 30 : Multichain Testnet
👉Jul 31, 2022 : Planned Obsolescence
📈BUY
-Buy: 1.9-2.0$ if A. SL if B
-Buy: 1.6-1.7$. SL if B
📉SELL
-Sell: 2.8-2.9$. SL if A
♻️BACK-UP
-Sell: 1.6-1.7$ if B. SL if A
-Buy: 1.2-1.3$. SL if B
❓Details
Condition A : "If 1D candle closes ABOVE this zone"
Condition B : "If 1D candle closes BELOW this zone"

Rune S/R Flip | Resistance BreakoutRune cryptocurrency token price is breaking above the important key level
breakout above the green zone will send price higher you can buy the retest of the the green zone for extra safety
if you are buying the breakout here it is good swing trade setup price can break the resistance soon within another lag

RUNEUSD LONG TRADE 20201218RUNEUSD LONG TRADE 20201218
RUNE,RUNEUSD,RUNEUSDT,RUNEUSDTP
Signal: Red-> Green
Context: Green
Trade close manually when: the above ribbons turns Yellow or better Red.
I appreciate your like or comment. Welcome to share your idea here.
DISCLAIMER
This is only a personal opinion and does NOT serve as investing NOR trading advice.
Please make your own decisions and be responsible for your own investing and trading Activities.


RUNE Falling wedge breakout Setupprice is breaking the falling wedge
buy when price close above 4900 sats. price at support sl below green zone
ready to move after breakout of falling wedge.


THORChain About to be On That Red Tag Clearance SpecialMy Fellow Crypto Comrades,
Appreciate you taking the time to view my analysis in which I hope you may find beneficial. Please be sure to “LIKE” if you indeed find my analysis useful and/or find my analysis intriguing.
Cheers & Happy Trading!

RUNE doing its magic. RUNEUSDDefinitely bullish, looking to gain some more ground. As always, target in green, invalidation in red. Let's roll. Don't be stupid, this is not financial advice.
