RUNE at the Brink: Rebound Opportunity or Breakdown Incoming?🧩 Overview:
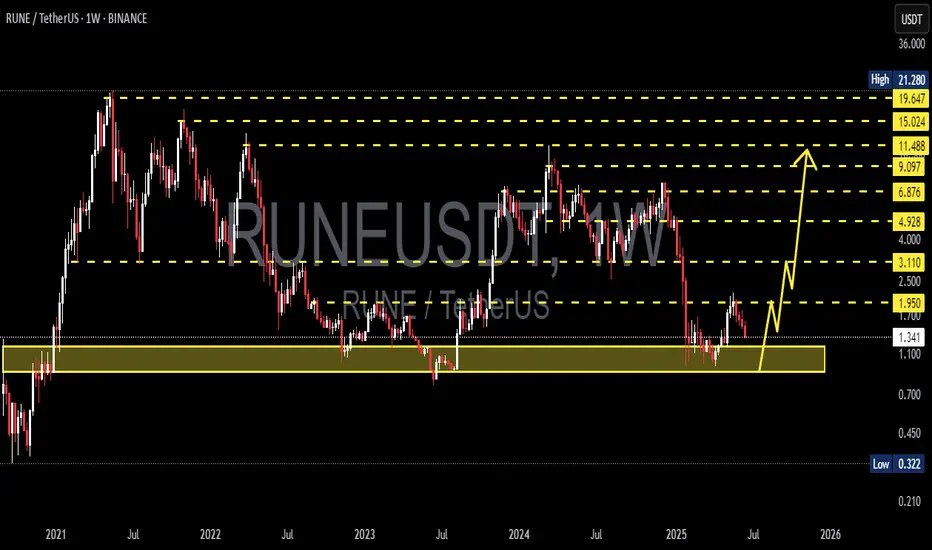
RUNE/USDT is currently hovering at a critical support zone — a historical demand area that has triggered strong bullish rallies in the past. Positioned between $1.00–$1.30, this level has been a battle ground between buyers and sellers. The big question now: Will RUNE bounce for a bullish reversal or break down into deeper lows?
---
🔍 Key Levels Identified:
Major Support Zone (Demand Area): $1.00 – $1.30 (yellow box)
Immediate Resistance: $1.95 → $3.11 → $4.92
Extended Bullish Targets: $6.87 → $9.09 → $11.48 → $15.02
Deeper Bearish Targets (if support fails): $0.80 → $0.55 → $0.32
---
🟢 Bullish Scenario (Recovery Rally):
📌 Key Signal: Strong hold and price reaction above the $1.00–$1.30 zone.
1. Reversal Patterns: Look for double bottom, bullish engulfing, or strong weekly pin bars to signal a potential reversal.
2. Momentum Confirmation: A breakout above $1.95 with high volume could trigger a strong continuation to $3.11 and $4.92.
3. Macro Tailwinds: A broader recovery in Bitcoin and the crypto market could enhance bullish pressure on altcoins like RUNE.
🎯 Mid to Long-Term Bullish Targets:
$3.11 → $4.92 → $6.87+
Potential upside of 200–400%+ from current levels if bullish structure confirms.
---
🔴 Bearish Scenario (Breakdown):
📌 Critical Risk: Weekly candle close below $1.00 with volume confirmation.
1. Support Breakdown: If $1.00 fails, price may revisit previous lows around $0.80 or even test historical demand levels at $0.32.
2. Bearish Continuation Pattern: Sustained lower highs and lower lows suggest downtrend continuation unless invalidated.
3. Volume Pressure: Heavy sell volume on breakdowns reinforces bearish bias.
⚠️ Bearish Targets: $0.80 → $0.55 → $0.322 (historical low)
---
🔄 Pattern & Structure:
Historical Accumulation Zone: The yellow box has been a long-term accumulation area since 2021.
Repeat Behavior: Previous touches to this zone sparked multi-week rallies.
Potential Wyckoff Accumulation: If price forms a sideways range with rising lows, this may be the early stage of a markup phase.
---
🧠 Strategic Outlook for Traders:
✅ Bullish Strategy:
Conservative entry: Wait for breakout + retest of $1.95
Aggressive entry: Accumulate within $1.00–$1.30 zone with tight stop below $0.98
❌ Bearish Strategy:
Short setup on confirmed breakdown below $0.98
Avoid trading without confirmation of direction (no FOMO)
---
🚀 Conclusion:
RUNE is standing at a make-or-break level — a tipping point between a bullish breakout or further bearish pressure. Smart traders don't just predict direction; they prepare for both outcomes. This is not just a technical zone — it's the market’s decision point.
#RUNE #RUNEUSDT #CryptoAnalysis #AltcoinWatch #BreakoutSetup #DemandZone #TechnicalAnalysis #CryptoOutlook #BullishScenario #BearishScenario #Wyckoff
RUNEUSD

RUNE : Ready to pump?Hello friends🙌
👀According to the price drop, you can see that the price has reached an important area, which, according to the pattern formed, if the specified resistance is broken, we can enter with risk and capital management and move to the specified targets.
🔥Follow us for more signals🔥
*Trade safely with us*

RUNEUSDT 1W AnalysisRUNE ~ 1W Analysis
#RUNE Buy back gradually from here with a short term target of at least 20%+ from this support block.
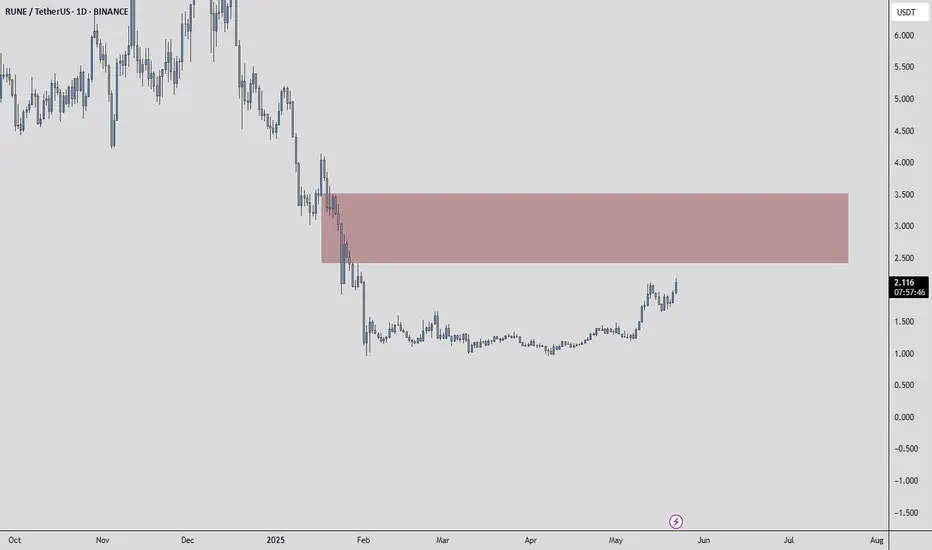
RUNEUSDT | Red Box Sell Wall Still HoldingRUNEUSDT is currently facing a strong resistance zone, clearly marked by a heavy sell wall inside the red box .
Until that level is broken with volume and confirmed as support, my bias remains negative and I stay short-focused .
“I will not insist on my short idea. If the levels suddenly break upwards and do not give a downward break in the low time frame, I will not evaluate it. If they break upwards with volume and give a retest, I will look long.”
No need to predict. Let the structure guide you.
📌I keep my charts clean and simple because I believe clarity leads to better decisions.
📌My approach is built on years of experience and a solid track record. I don’t claim to know it all but I’m confident in my ability to spot high-probability setups.
📌If you would like to learn how to use the heatmap, cumulative volume delta and volume footprint techniques that I use below to determine very accurate demand regions, you can send me a private message. I help anyone who wants it completely free of charge.
🔑I have a long list of my proven technique below:
🎯 ZENUSDT.P: Patience & Profitability | %230 Reaction from the Sniper Entry
🐶 DOGEUSDT.P: Next Move
🎨 RENDERUSDT.P: Opportunity of the Month
💎 ETHUSDT.P: Where to Retrace
🟢 BNBUSDT.P: Potential Surge
📊 BTC Dominance: Reaction Zone
🌊 WAVESUSDT.P: Demand Zone Potential
🟣 UNIUSDT.P: Long-Term Trade
🔵 XRPUSDT.P: Entry Zones
🔗 LINKUSDT.P: Follow The River
📈 BTCUSDT.P: Two Key Demand Zones
🟩 POLUSDT: Bullish Momentum
🌟 PENDLEUSDT.P: Where Opportunity Meets Precision
🔥 BTCUSDT.P: Liquidation of Highly Leveraged Longs
🌊 SOLUSDT.P: SOL's Dip - Your Opportunity
🐸 1000PEPEUSDT.P: Prime Bounce Zone Unlocked
🚀 ETHUSDT.P: Set to Explode - Don't Miss This Game Changer
🤖 IQUSDT: Smart Plan
⚡️ PONDUSDT: A Trade Not Taken Is Better Than a Losing One
💼 STMXUSDT: 2 Buying Areas
🐢 TURBOUSDT: Buy Zones and Buyer Presence
🌍 ICPUSDT.P: Massive Upside Potential | Check the Trade Update For Seeing Results
🟠 IDEXUSDT: Spot Buy Area | %26 Profit if You Trade with MSB
📌 USUALUSDT: Buyers Are Active + %70 Profit in Total
🌟 FORTHUSDT: Sniper Entry +%26 Reaction
🐳 QKCUSDT: Sniper Entry +%57 Reaction
📊 BTC.D: Retest of Key Area Highly Likely
📊 XNOUSDT %80 Reaction with a Simple Blue Box!
📊 BELUSDT Amazing %120 Reaction!
📊 Simple Red Box, Extraordinary Results
I stopped adding to the list because it's kinda tiring to add 5-10 charts in every move but you can check my profile and see that it goes on..
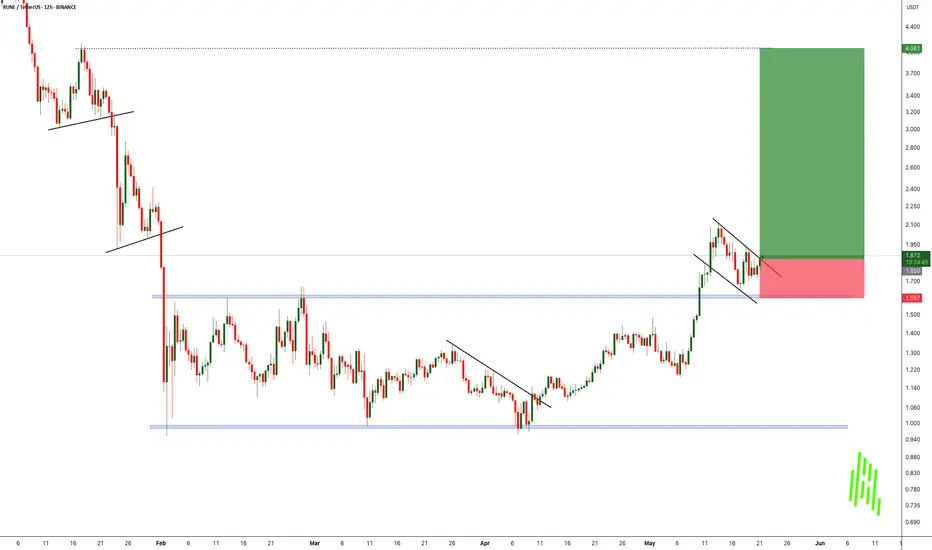
RUNEUSDT Breakout and Bull Flag Forming!!After nearly three months of tight consolidation, BINANCE:RUNEUSDT has finally broken out of its range-bound “box” structure. a powerful sign that the market is ready to move. This type of breakout often signals the end of indecision and the start of a strong directional trend.
What makes this setup even more exciting is the formation of a bull flag pattern right after the breakout. Known as a classic continuation pattern, the bull flag usually signals that the asset is simply pausing before its next leg up. The tight pullback within the flag is showing low-volume correction. A bullish sign that buyers are still in control.
With this confluence of a range breakout followed by a bull flag, BINANCE:RUNEUSDT is flashing all the signs of a potentially explosive move to the upside. However, it’s important to stay disciplined – always manage your risk and keep stop losses in place below the flag structure or previous support levels.
Next move could be strong. Stay sharp and ride the wave!
BINANCE:RUNEUSDT Currently trading at $1.87
Buy level : Above $1.86
Stop loss : Below $1.6
Target 1: $2.2
Target 2: $3
Target 3: $4
Max leverage 3x
Always keep stop loss
Follow Our Tradingview Account for More Technical Analysis Updates, | Like, Share and Comment Your thoughts
RUNE/USDT : BUY LIMITHello friends
Given the growth in price and the entry of buyers, now that the price is in the ascending channel, we can buy in stages and with risk and capital management and move towards the specified goals.
*Trade safely with us*

RUNE sell/short setup (4H)The RUNE token, after experiencing heavy drops due to negative news, is now trading within a range.
A price top has been fake out, leading to a drop. On a retracement to higher levels, we can look for a sell/short setup.
We have identified two entry points for a short position.
Targets are marked on the chart.
A daily candle closing above the invalidation level will invalidate this view.
For risk management, please don't forget stop loss and capital management
Comment if you have any questions
Thank You

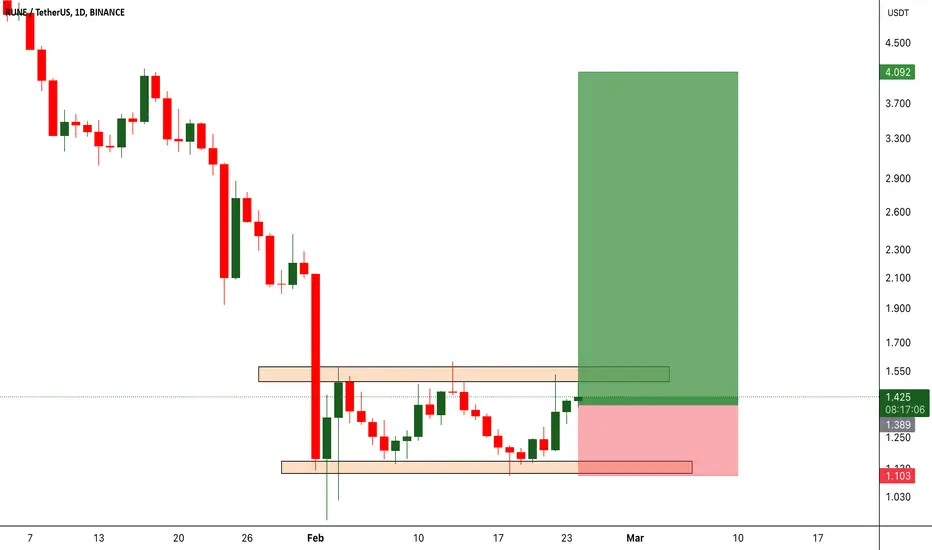
RUNEUSDT: The Unstoppable Breakout? Eyes on the Resistance!BINANCE:RUNEUSDT has been showing remarkable strength while the broader market struggles, repeatedly holding support and now pushing towards a key resistance level. This consolidation phase suggests a potential explosive move ahead. A breakout above this major resistance could trigger strong bullish momentum, making BINANCE:RUNEUSDT unstoppable in the short term. Volume confirmation will be crucial, as increasing buying pressure could validate the breakout and fuel further gains. However, risk management is essential false breakouts are always a possibility, so setting a stop loss just below recent support levels is key to protecting capital. All eyes are now on the breakout level. if BINANCE:RUNEUSDT clears it with conviction, it could be a high-potential trading opportunity. Trade smart, stay disciplined, and always keep your stop loss in place.
BINANCE:RUNEUSDT Currently trading at $1.41
Buy level: Above $1.4
Stop loss: Below $1.1
Target : $4
Max Leverage 3x
Always keep Stop loss
Follow Our Tradingview Account for More Technical Analysis Updates, | Like, Share and Comment Your thoughts
RUNEUSDTRUNE ~ 1W Analysis
#RUNE Buy gradually from here if you still have a Conviction on this Coin with a minimum target of 20%+.

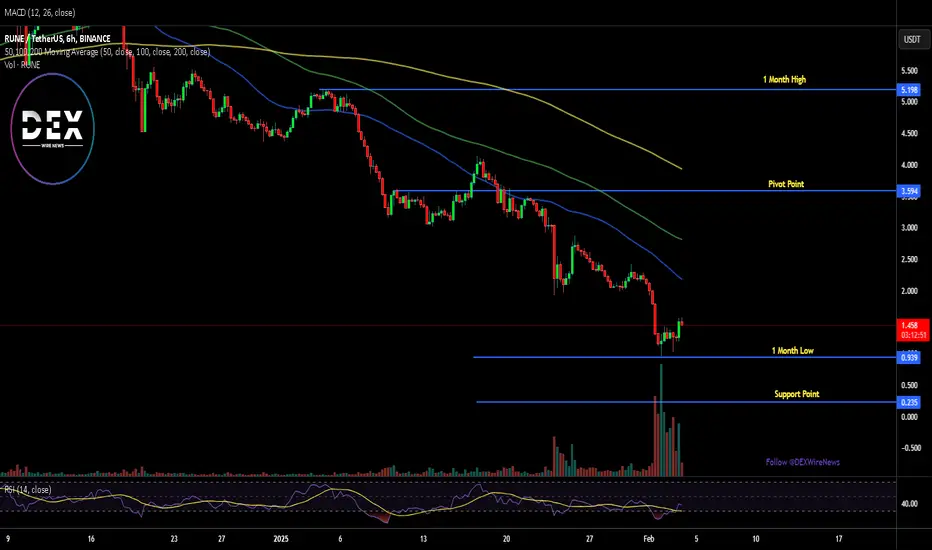
THORChain Convert Debt into Equity: What about RUNE Holders FateTHORChain ( CRYPTOCAP:RUNE ) has taken a bold step to address its $200 million debt crisis by converting unserviceable debt into equity through a new token, TCY (Thorchain Yield). This strategic move follows the suspension of THORFi services on January 23, 2025, due to financial instability. While this decision aims to stabilize the ecosystem, the market response has been mixed, with CRYPTOCAP:RUNE experiencing sharp volatility.
THORChain’s Debt-to-Equity Move
The newly introduced TCY token will be issued at a rate of 1 TCY per dollar of defaulted debt, effectively turning affected lenders and savers into equity holders. To further support this transition, THORChain plans to create a RUNE/TCY liquidity pool with an initial $500,000 backing, pricing TCY at $0.10 per token. Additionally, TCY holders will receive 10% of THORChain’s revenue indefinitely, providing a long-term recovery mechanism.
Despite these efforts, concerns linger regarding the timeline for full financial recovery. However, THORChain’s core functionality—cross-chain swaps—remains intact, ensuring continued utility for its users. Market sentiment, however, reflects uncertainty, as seen in CRYPTOCAP:RUNE ’s price action.
Technical Outlook: Can CRYPTOCAP:RUNE Recover?
Following the debt-to-equity announcement, CRYPTOCAP:RUNE has exhibited mixed performance. Initially, it plunged 10% within 24 hours, extending its 30-day decline to nearly 50%, in line with the broader market downturn. However, as of the latest data, CRYPTOCAP:RUNE is showing signs of recovery, posting an 11% gain and trading within a moderate zone.
Key Levels to Watch:
- Relative Strength Index (RSI): Currently at 38, indicating potential oversold conditions and a buying opportunity.
- 38.2% Fibonacci Retracement Level: The $3.58 price mark aligns with this critical resistance; a breakout above this level could fuel a bullish rally.
- 1-Month High Target: If momentum sustains, CRYPTOCAP:RUNE could push towards $5, the next major resistance level.
Conclusion
THORChain’s move to convert debt into equity is a double-edged sword. While it provides a structured approach to managing financial challenges, investor confidence remains uncertain. The success of the TCY token will heavily influence market sentiment around CRYPTOCAP:RUNE in the coming weeks.
As the market digests this pivotal restructuring, all eyes remain on CRYPTOCAP:RUNE ’s price action and the effectiveness of THORChain’s recovery strategy.
Thorchain RUNE long-term analysis My RUNEUSD long-term analysis.
Higher timeframes provide clear view . BUT can you see it?
Will be buying in the zone provided. Be smart.
If anyone have any questions feel free to contact me or drop a comment.

How far will RUNE drop? (3D)As you have seen and know, the RUNE token is currently in freefall and has experienced a sharp drop compared to other altcoins.
Upon analyzing the chart, we identified a fresh weekly order block. Considering the strength of the momentum, the freshness of this order block, and the fact that it belongs to a higher time frame, it is expected that this order block could halt the drop and push the price back toward higher levels.
However, if this order block is breached without any reaction and a daily candle closes below the invalidation level, it might indicate that negative fundamental factors are at play for this token, potentially unknown to the public, raising concerns about a scenario similar to the Luna incident.
For now, though, such a situation seems unlikely. The price appears to be in an ABC correction, currently within wave C of this correction.
For risk management, please don't forget stop loss and capital management
Comment if you have any questions
Thank You

RUNE 4H SPOT - Holiday SeasonRUNE 4H SPOT but watch out it's holiday season in my country
.
Market Order Allowed
TP SL On Your Own
.
CP: 2.74

RUNEUSD: Rebound at the bottom of the Channel UpTHORChain is neutral on its 1D technical outlook (RSI = 45.391, MACD = -0.566, ADX = 34.736) as it recovered the bearish action of Wednesday. That was straight after the price made a new HL at the bottom of the long term Channel Up. The 1D RSI is rebounding in the exact same way as the August 5th 2024 HL. We are bullish, aiming for the 0.618 Fibonacci level (TP = 5.8300).
## If you like our free content follow our profile to get more daily ideas. ##
## Comments and likes are greatly appreciated. ##

Skyrexio | Thorchain RUNE Is About To Explode!Hello, Skyrexians!
Recent month was difficult for cryptocurrencies, but BINANCE:RUNEUSDT was one the top losers. It was able to drop to almost the 2024 lowest price. Holders are scared, but Elliott waves power make us sure that this asset will explode significantly in 2025.
Let's take a look at weekly time frame. Previous bull run was huge and impulsive. The bear market did not overlap the bottom, it means that now price is in global wave 3. Recent dump is just the correction which reached the 0.5 Fibonacci level. We have already seen the green dot on the Bullish/Bearish Reversal Bar Indicator inside this zone. Now price is about to print another one. As always, alerts from this indicator are automatically replicated on my accounts. You can find the information in our article on TradingView . If this analysis is right, now price is about to show the most significant growth to $35-50.
Best regards,
Skyrexio Team
___________________________________________________________
Please, boost this article and subscribe our page if you like analysis!

RUNEUSDT 1WRUNE ~ 1W
#RUNE If you still have Conviction on this coin,. This support block would be a very good buying place for now,. Minimum Target 20%++


RUNE could go anywhere, next few weeks it will resolveunclear directions for RUNE USDT, will likely depend to resolve on its broader markets

RUNEUSDT 1WRUNE ~ 1W
#RUNE Buy gradually after breaking through this resistance line. with a minimum target of 20%+. The break of this resistance line confirms further bullish

RuneusdtEverything is clear in the picture
-----------------------------
Remember nothing is 100% certain

📈RUNE can go high to $40 level / Alt Season rally📉BINANCE:RUNEUSDT
KRAKEN:RUNEUSD
Hello Traders
Rune is one of my suggestions for the altcoin market.
You can clearly see that volume has increased continuously. ---> Highly potential for the alt rally season.
RUNE is the native token of the THORChain network. It represents a multi-purpose universal token that supports all functions on the THORChain network and helps run the protocol. RUNE is used in governance, for staking, bonding for validator Nodes, and trading.
The best strategy for altcoins is to allocate a certain percentage of assets (for example, 10% of the total portfolio) to buy potential altcoins.🎲

2 ALTCOINS in 2 MINUTES | AAVE & RUNE | Great UpsideTwo altcoins in under two minutes - each with a bright future and good-looking upside potential.
BINANCE:AAVEUSDT
AAVE might e heading back to retest a crucial support zone, in other words - you could get a cheaper entry. A good place to look for potential buy zones, is on the moving averages in the daily. The price is on the right-hand panel, and indicates possible bounce zones:
BINANCE:RUNEUSDT
RUNE is slightly more advanced in the bullish cycle, forming higher highs after retesting the key support. There is still a major upside potential. Ultimately, the earlier / lower you buy, the better (unless you are a swing trader or scalp trader).
Either way , many altcoins will begin to pick up now that BTC is trading sideways.
______________________________

$RUNEUSDT: Ready to Break Out! BINANCE:RUNEUSDT has recently broken out of its downtrend and is now forming a symmetrical triangle, signaling a potential breakout that could lead to a significant upward movement. The fundamentals behind CRYPTOCAP:RUNE are strong, supported by a dedicated community, which adds to its long-term potential. Traders should keep an eye on the breakout from the triangle, as this could ignite a major price surge. As always, remember to set a stop loss to manage risk effectively while taking advantage of this exciting opportunity.
BINANCE:RUNEUSDT Currently trading at $5.2
Buy level: Above $5.25
Stop loss: Below $4.38
TP1: $5.7
TP2: $7
TP3: $9
TP4: $11
Max Leverage 3x
Follow Our Tradingview Account for More Technical Analysis Updates, | Like, Share and Comment Your thoughts
