RUNEUSDT...easy to use chartBINANCE:RUNEUSDT
1) DO NOT FOLLOW MY TRADES...i am here to share my analysis (and make u POOR AF)
2) i DO NOT HAVE A PRIVATE TELEGRAM CHAN. bc i don't need ur money, i'm making my own.
3) why would anyone who is making money, make money from selling trade ideas? he is already making MONEY!!
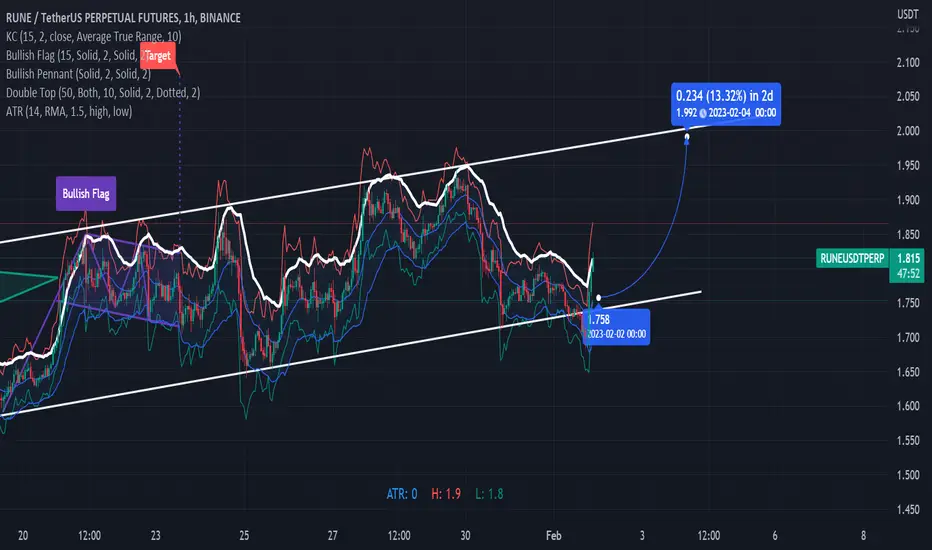
look at the chart, no need to explain further
but keep in mind, need a "CONFI-bar" to enter a buy trade
next target is to be 1.900$
#stop_being_poor
RUNEUSDT

RUNE/USDT AnalysisFor the past few weeks whole market has been green all the way. But recently it is forming up bearish channel/patterns (ETH, BNB, MATIC etc). For RUNE it has formed up clean bearish channel which you could see here. For my analysis, RUNE could face big drop in coming few days! Watch out!

RUNE BTC USDTTHORCHAIN
Strong fundamentals
After multiple blockchain integration , we got savers (earning passive) ~ NATIVE only not wrapped.
Easy swaps natively.
More upcoming = Lending / borrow
Minting and Burning
Kill switch completion Ahead
Technicals :
Bullish Reversal Megaphone + Double bottom + Bullish Divergence + Break of Trendline in Candles + RSI

Rune back on trackWe are back on track to go to 2 $ tight stoploss is just below the trendline i have drawn
a looser Sl would be the 1hr ATR @1.65
RUNEUSDT
✅ ✅ Risk warning, disclaimer: the above is a personal market judgment and analysis based on published information and historical chart data on The trading view,
And only some of these analyzes are my actual real trades.
I hope Traders consider I am Not responsible for your trades and investment decision.

runeusdt downtrendAccording to supply and demand areas and trend lines, I expect a drop to the specified range.

RUNE Thorchain Long spot trade I think RUNE will make a big move...very soon. And It's gonna run fast when it breaks daily (and weekly trend). If market continue to explode RUNE will be one of the really fast movers. In this spot trade I wouldn't wait for the trendbreak. I think the risk reward ratios is good as it is 1.6. RUNE is lagging compare to many other coins and I think its high probability that RUNE is one of the next coins that makes a big move - non financial advice.

RUNE SHORT SETUPHi, dear traders. how are you ? Today we have a viewpoint to SELL/SHORT the RUNE symbol.
For risk management, please don't forget stop loss and capital management
When we reach the first target, save some profit and then change the stop to entry
Comment if you have any questions
Thank You

RUNEUSDT IdeaMore of a creative idea with the assumptions of where the price will move with the placement of a bars pattern
On chart is also two channels, one down , one up.
There is also a large falling wedge highlighted in green

RuneusdtThis analysis is just my mental and personal idea
Please analyze before entering
Get approval first

Runeusdt - selling this coin because bulshit news..
price broke through the support level. (blue level).
On the retest, I will look for a opens short.
The main thing that the market would not turn around.
Graphically, everything is shouting for a short.
.
Here's the bullshit news for the real cryptans.
❗️Important information for EXPERIENC cryptans.
Many of you probably know that Trust Wallet (TWT) has chosen ThorCHAIN (RUNE) as their primary crosschain partner. Here's a repost of CZ (head of binans) tweeting about it: twitter.com
❗️Of course, ThorCHAIN doesn't have its own API and, in fact, Trust Wallet uses the ThorSWAP (THOR) API built on ThorCHAIN. Here is the official ThorSWAP tweet: twitter.com
❗️Please note the ThorSWAP logo and compare it to the partner logo listed on Trust Wallet swaps (swaps are only available on Android for now). This is exactly ThorSWAP, not ThorCHAIN...
If you like the idea, please "Like" it. This is the best "Thanks!" for the author 😊
P.S. Always do your own analysis before a trade. Put a stop loss. Fix profits in installments. Withdraw profits in fiat and please yourself and your
your friends.

RUNE - Are your bags full ? RUNE Weekly here. (linear).
Clear bottoming pattern is forming and we're in the final stages of the WXY correction (finishing up the 5th wave of C of Y). I'm really excited about this chart and have been for sometime. The last time I added to my bags was around 1.19. If we make a new low, which is about 50/50 right now, I will add more without hesitation.
Once my FSS indicator prints a buy signal, I will also buy adding to my position. After 3 consecutive Sell signals on the 3D, I am anxiously awaiting for it to go green.

RUNE shortRUNE broke trough the ascending trendline. Asset broke trough the support level. Bearish movement to support level at 1.14 is possible.

Ichimoku Analysis for RUNEKumo bullish crossover happened, will wait for bullish tenkan/kijun crossover though for a good 20% Run.

RUNE: Approaching ResistanceTHORchain (RUNE) technical analysis:
Trade setup : Trends are mixed. Wait for price to 1) break above $1.50 resistance, with upside potential to $2.00, or 2) pull back near $1.00 support for swing entry.
Trend : Uptrend on Short-Term basis, Neutral on Medium-Term basis and Downtrend on Long-Term basis.
Momentum is Mixed as MACD Line is below MACD Signal Line (Bearish) but RSI ~ 50 (Neutral).
Support and Resistance : Nearest Support Zone is $1.00. The nearest Resistance Zone is $1.50 (previous support), then $2.50, and $3.00.

🔰#RUNE/USDT 🔴 SHORT SCALP 🔸 HighRisk🔰#RUNE/USDT
🔴 SHORT SCALP 🔸 HighRisk
🔘 Entry : 1.401 - 1.423 - 1.435 - 1.47 Mart
☑️ Take-Profit : 1.388 - 1.362 - 1.320 - 1.250 - 1.150
🏴☠ Stoploss: 1.5 4h Close Candle
✖️ Leverage 20x
💲 Margin: 2% Risk

RLinda ! RUNEUSD-> Bulls break through resistance. What's next?RUNEUSDT shows the position of the bulls, who are trying to overcome the resistance of the bears. The price breaks through important resistance and moves into the long zone
On the chart we see the formed "descending wedge" pattern, a break of which resistance can activate quite a strong bullish impulse.
Now the price touches the resistance at 1.433 and is in the consolidation phase between 1.433 and 1.282.
I expect the formation of a local ascending triangle to the level of 1.433, breakthrough of which will send the price to 2.09 (medium-term target), and after that - to 3.04.
Regards, R. Linda!

RUNE 21.12.22 (Short-Term)RUNE continues to move in the price range I expected. If it continues like this, it is likely to reach the price range of $1.44 - $1.45 , the upper level of the channel.
I'm thinking of making a short position from the area specified in the chart to the bottom of the channel. If the price comes to the $1.44 level, it should be watched carefully.
If there is a pump in BTC in terms of a possible liquidity cleanup, there is a possibility that RUNE will break the channel. Therefore, I will wait for the return indicator before opening a short.
What I write here serves as a note to myself. Does not include investment advice.

RUNE Technical analysisPrice tapped into a 12h demand zone from where it moved up from after liquidating the support line. I expect price to reach the 4h supply around $1.45 before potentially moving down again.

long RUNE$RUNE is bouncing off the bullish trendline. Bullish movement to the resistance level at 1.69$ is likely to happen.

RUNEUSDTHello Crypto Lovers,
Mars Signals team wishes you high profits.
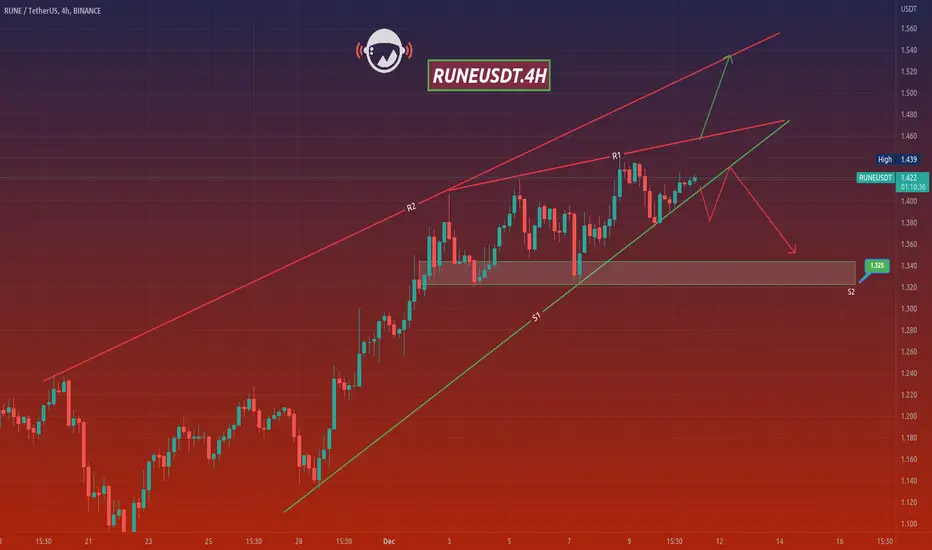
This is a 4-hour-time frame analysis for RUNEUSDT
In the current chart, there are R2 and R1 as our resistance areas which express the price was not able to rise at some points. And S1 and S2 are the support areas at the bottom of our chart. Hence, we have the price fluctuating upward in an ascending triangular shape above S1 line. We predict two scenarios to happen here. Either we will receive some confirmation candles to rise and then an increase would be there for the price to reach R2. Or it is possible that the price gives us some falling signs and faces more decline by moving below S1. Note that by the time the price does not leave the shape, there won't be a precise prediction. Please follow our updates and make sure you are attentive to anything.
Warning: This is just a suggestion and we do not guarantee profits. We advise you to analyze the chart before opening any positions.
Wish you luck
RUNE analysisPrice is ranging in an ascending channel creating higher highs and higher lows. I expect price to reach the 2h supply around $1.46 before moving down again from there.

Meditations of the stoic emperor I buy with few amounts every month cause in this case fomo is sacred, fomo is not bad for hundreds of KX or tens of KX as long as 1 is valid
Wave 3 is not the shortest wave and since the higher the price is the higher the bubble will be i think the target is 1.27 & 1.618 possibly higher levels, study fundamentals
My guestimate for buying huge is 0.618 but the bear might go to the cave at 0.5 on rune since btc might turn bullish
Do as you think it is right cause at the end it is relatively right
Long live the holder
