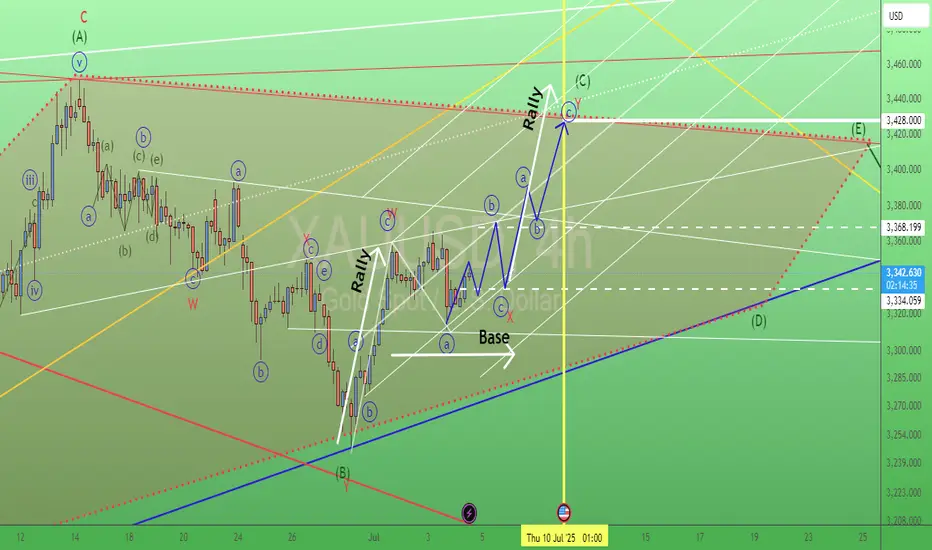
Gold. Swing trade setup. 4/July/25XAUUSD,. based on how the "speed" of chart "touching" those trendline (white). Gold probably having a ( abc (blue circled) running flat waves) "base" before "rallying" toward 3428 +/-...
Runningflat
Gold probably time for deep correction. 29/August/24XAUUSD probably having very deep correction now toward 2400 within few days. ? And What is the cause of?...The Monster of All Stocks? = Nvidia earnings report? After today Market Closed?

Expanded Flat - Wave C BeginningSPX has possibly completed forming Waves A and B of a complex expanded flat correction, and may be near starting its Wave C.
More likely this is the case should TVC:DXY continue up to and above 112-115. See related chart linked below under related ideas.
Another possibility is a running flat correction where it turns back up near the 100% fib instead.

Running FlatHere's an idea to support the possibility that BINANCE:HBARBTC may be ready for or have already begun a reversal that is potentially headed towards a new ATH.
HBAR ended its second run vs. Bitcoin with a slightly higher new high, giving it a flat top. Since correcting, it has formed what could be a strong reversal at a low that is parallel to its previous low and the two previous highs, and it did so right along the 100% fib on the trend-based fib extension shown above.
Should we actually get that reversal here, it would confirm that it has been in a running flat correction, which typically leads to a very strong move up once it reverses.
The running flat also lends confluence towards my previous suggestion that it has been in accumulation since inception, as shown in this older chart below comparing the weekly with Wyckoff Accumulation Schematic # 2:

Topglov new quarter result was worse than last quarter? 1/Nov/23Topglove''s latest "quarterly" report "disappointed" again. Not just "investors", "traders" are "hardworking" individual as well who do check their positions not just "quarterly" but everyday beside reading on each stock's Intrinsic value, ROE, P/E, Forward Free Cash Flow, Profit Margin etc "quarterly" OR reading "market news" "once a while"...

INDUDINDBK - Triangle breakout / flat formationElliott Wave Analysis:-
View 1:-
Triangle was formed and breakout happened and waiting for the retracement.
Once retracement took place we can enter into the trade with safe trade setup with Stop loss @ 1396 .
target 1:-1500
target2:-1575
View 2:-
There is a Flat formation in 4the Wave. expanding flat is getting into picture. Wave B crossed wave A and waiting for the C wave to get retraced. According to C wave we can decide whether it is an Expanding flat or Running flat.
we have to wait for retracement.
For Triangle Setup :-
aggressive buyer can enter the trade right now with same stop loss.
Conservative trader can wait for retracement.
I'm not a SEBI registered advisor.
Before taking a trade do your own analysis or consult a financial advisor.
I share chart for education purpose only.
I share my trade setup.

INARI probably found its “base” @ 1.50 +/-. 17/May/23.INARI is trending down to long term cycle 13 ( Bold Green) toward 1.50 +/-. @ wave C ( Red Circled) Which is the last leg of complex double three running flat pattern ABC ( Red Circled) in wave II ( green).

$BTC #BTC #Bitcoin Long-term Chart. Buy Setup #Elliottwave.This count is based on my assumptions so anything can happen not a trading or financial advice just for educational purposes only kindly do your own ta thanks trade with care good luck.

XAUUSD (Gold) - BIG LONG Starting - Elliott Wave TradingWave count on $XAUUSD (Gold) suggests that a bullish rally is around the corner.
I am adding longs on XAUUSD as the Elliott Wave is synchronizing with Harmonics and multiple other technical analysis tools.
Technicals:
- Reversed Bullish Divergence
- EW Running Flat Pattern
- Fibonacci Retracements
- Fibonacci Extensions
- Bullish Bat Harmonic
Expectations:
- Bullish Primary C leg, in an impulsive manner.
Many pips ahead!

Update2: BTC Scalping short trading opportunity
This is the sequel to my previous idea .
The support line of the diagonal triangle has finally been broken.
The coordinate of point (A) was erroneous, so I corrected it.
TOTAL and Nen-star patterns formed.
Recommended TPs unchanged (see also gray-color zones of the Fibonacci extension.)
For details, please take a look at the related ideas below.

Gold. Where to short toward 1798 +/-? 13/Feb/23.Gold probably forming an running flat pattern abc ( green circled) in wave B (yellow). Short gold @ 1886 +/-..

XLMLikely completed a HTF running Flat which is as follows :
Wave B extends beyond the start of wave A
Wave C finishes above the end of Wave A
Wave A must breakdown into 3 sub wave ABC
Wave B must Breakdown into 3 sub wave ABC
Wave C must subdivide into 5 waves (in the case of XLM an Ending diagonal)
the ending diagonal is a precursor to a strong reversal.
Likely the forever bottoms in around .06c & up only from now on, any dips will be eating up by the XLM bulls & Algos.

GBPUSD Bearish Impulse - Minor CGBPUSD is starting a Bearish Impulse in Minor C (orange).
Wave B (orange) is most likely a Running Flat.
However, based on Elliott Wave patterns, it could also reflect as an Expanding Flat.
But I don't think so.
I am going short on the Pound Dollar.
GBPUSD tech. Analysis:
* Elliott Wave: Ending Diagonal on Intermediate (C) (white).
* Running Flat in Minor B (orange)
* Sep '20 Bearish Fractal
* 38.2% Fibonacci Retracement of Minor A (orange)
* Up-Trend Breach
* Channel Consolidation
GBPUSD Trading Signal:
* Entry @ 1.2170
* SL @ 1.2500
* TP1 @ 1.1800 / TP2 @ 1.1600 / TP3 @ 1.2500
* BUY STOP @ 1.2050
* Aggressive Entry @ Market Price
* Moderate Entry @ 1.2320
*Safety Measure: when in the green, moving SL to BE.
Many pips ahead!
Richard, the Wave Jedi.

AUD/USD LONG TRADE wave analysis
price action
liquidity
market structure
range
breakout
momentum
correction


XAUUSD LONG TRADE hello traders
There is a bullish wave and a correction pattern. Most likely, it will be RUNNING flat. The price is now at a strong reversal level. Another BULLISH impulse may start from here.

Gold. watch out 1645 +/-. 27/Oct/22 Gold probably forming a running flat pattern in Wave b (green circled) where Price might hold @ around 1645 right before/after today US Advance GDP.

USD CHF ANALYSIS hello traders
The impulsive wave of USD/CHF is ascending and there is a running flat correction and the price reached a strong support level. Another bullish impulse wave may start from here

The potential downside of goldhello traders
There is a bearish impulse wave and we have a correction in the form of running flat. It is possible that we will get another bearish impulse wave, but the sellers must break the last wall of the buyers and the buyers' reaction be corrective after break and the sellers overcome it as well
If these conditions are met, a sell trade will be executed to target the level of 1611.500

GBPUSD H1Hi traders, GBPUSD is setting up for a upside move i am looking price action on gbpusd for a long position opportunity GOOD LUCK.

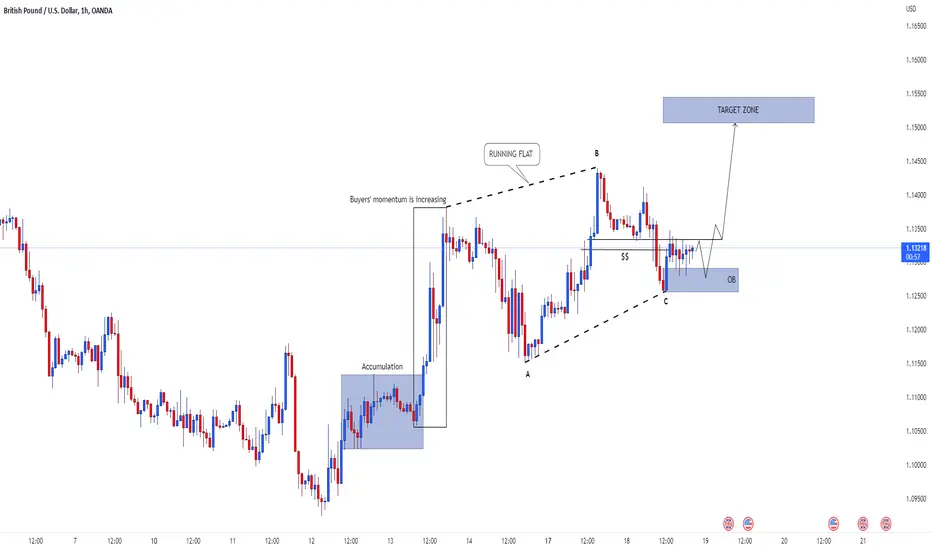
Possible Upside for GBP USD with the release GBP CPI datahello traders
There is an increase in buying momentum and an Running flat corrective pattern
and The Liquidity Grabed and we have a reversal signal , BY a large percentage we will get another bullish impulse wave
Possible Up Side of Bitcoinhello traders
In today's session, I bought bitcoin, the target level is 20460
Analysis We have a strong support and resistance level centered below the purchasing liquidity and we have an upward IMPULSE wave and a correction pattern that I expect to be running flat and we will get another bullish impulse wave

The potential downside of gold priceshello traders
The corrective wave B was broken, and the correction wave C started, it may end at 1633 area and the bearish trend will continue
But wait for confirmation
