BTC Running Flat UpdateBroke above the wedge and now re-testing it. Also broke above the daily 50 and 200 EMAs, and currently re-testing top of 200 EMA. Succeed in staying above our wedge and our 200 EMA and a running flat in an uptrend continues to look like the overall structure here.
Runningflat

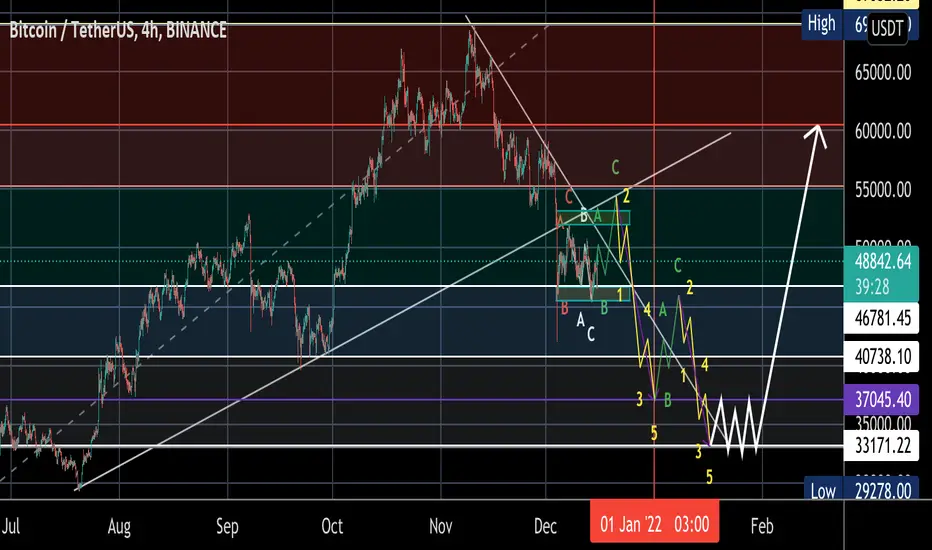
Bitcoin seem like to >10k from @ 37250. 27/ Mar/22Bitcoin seem like done its multi months correction at around 33250 which is the “confluence zone “ of Volume Profile POC and Demand zone..

Reliance industries very nice buy setupVery nice running flat forming in reliance for upside guys, there is also sharp move for entry on daily time frame. look for correction of the wave for entry.
Thanks.


Bitcoin - Quick Running Flat UpdateBitcoin's running flat correction appears to be a textbook example, in looking at our weekly chart thus far:
- Wave B traced beyond the start of Wave A -- higher high, higher low for Wave C
- Wave C stopped exactly at the 100% of our trend-based fib measured from 0 -> A -> B, and not as low as the start of Wave A -- looking like we found our bottom here
- Wave A moved 36.1k, Wave C moved 36k, and the most common relationship between Waves A and C in a running flat are 1 : 1 -- this is incredibly close to 1:1
Related idea linked below.

HBAR is also in a Running FlatSimilar to Bitcoin, HBAR is completing a running flat correction, in an uptrend, and should be expected to revisit ATHs; with a good chance of making higher ATHs.
We need our monthly lows to continue closing above 19.5 cents to confirm, and we need the overall market to hold up (BTC continuing in a running flat correction as well).
A couple of positive confirmations we can see that this is the case, now:
1.) Wave B retraced more than 100% of Wave A
2.) Wave C retraced less than 100% of Wave B, and stopped exactly at the 100% trend-based fib extension
3.) The most common relationship between waves A & C is 1:1, on the monthly we are less than 2% shy of exactly 1:1 (very good)
For more confluence, see the links to related ideas below. HBAR's BTC and ETH pairs look very bullish, and BTC's running flat looks quite similar to this one.

BITCOIN possible forming an ending diagonal. 1/Feb/22BTCUSD possible forming an ending diagonal in wave c (green circled) of an running flat pattern. .P/S : On Elliot Wave / Market Structure : Unlike Textbook written rule : ALL Impulsive wave comprised of ONLY a-b-c sub-waves NOT 1,2,3,4,5 waves

BTCUSD Elliott Wave Forecast - Wave 4 Correction (alternate)The chart depicts my alternate count for the current Wave 4 correction. I believe we are in the final impulse sub wave C which is close to completion.
For those of you who are unfamiliar with this; a flat correction, be it Regular, Expanded or Running all consist of a 3-3-5 wave structure (ABC).
As BTC had printed a more complex correction for Wave 2, alternation guidelines concerning Waves 2 and 4 would allude to a simple correction for this ongoing Wave 4. The simple correction here is in the form of a Running Flat. Please see linked idea below for the Expanded Flat scenario.
I am currently leaning towards this alternate count. The Expanded Flat scenario will only take precedence should price drop below 28.6k. If this level is breached, we can expect further depreciation towards the 24k-25k level.
I hope you found this useful, do leave your thoughts in a comment below.
As always, a 'like' and 'follow' is much appreciated and provides encouragement to share further ideas.
Thank you for taking the time.
BeyondEdge
Your Edge Is Your Perception. Go Beyond.

BTC / USD - Running Flat or Expanded Flat?Two long-term bull theories, BTC is in a Running Flat correction in an uptrend, or we're seeing an Expanded Flat correction.
Running flat looks more likely so long as we hold above our previous low @ roughly 29k, even better if we remain in this channel on the 4H chart. Targets for the bottom are near where we are now
Expanded flat becomes possible if we reach lower than the previous low, and targets for a bottom for that would range anywhere between the 1.236 and 1.618 levels on the fib extension shown above, between 11.5k and 25k, with 18.5k as the middle of each.
Let's see if either of these become true.

BTC Elliot Waves - RUNNING?Are we on ABC correction "Running" where the C will be higher then A, I think so.

A Potential Flat Pattern is Forming on TAIEXIt seems that my first interpretation about TAIEX is still active:
If the potential corrective pattern is really a Flat(either Expanded or Running),
the price of TAIEX should start to accelerate to the downside to complete wave c

Tenaga Price may drop till around RM8.50. 13/Jan/221)On Charts : Charts consist of 3-Dimensions - The X-factor ( Time or Cycle ), The Y- factor ( Price Geometry ), AND The Z-factor ( The Speed ).. 2)On Elliot Wave / Market Structure : Unlike Textbook written rule : ALL Impulsive wave comprise of ONLY a-b-c sub-waves NOT 1,2,3,4,5 waves.. AND there is NO Truncated 5th wave BUT ONLY wrong wave counts...

SPX waves updated 11/Jan/22.1)On Charts : Charts consist of 3-Dimensions - The X-factor ( Time or Cycle ), The Y- factor ( Price Geometry ), AND The Z-factor ( The Speed ).. 2)On Elliot Wave / Market Structure : Unlike Textbook written rule : ALL Impulsive wave comprise of ONLY a-b-c sub-waves NOT 1,2,3,4,5 waves.. AND there is NO Truncated 5th wave BUT ONLY wrong wave counts...

BITCOIN Running-FlatBottom could be $33k - $32k
Fib 0’ is around $33k but might get everyone scared by dipping below and forming a Diamond Bottom (Wild Guessing here) Don’t listen to me tho no one knows what Bitcoin is gonna do in the future.
But WAVE STRUCTURE LOOKS A LOT LIKE A RUNNING-FLAT NOW and it should get more clear in the next few weeks.
BTCUSD Long, Knifecatch to 74kSorry for the lack of posts over the past two weeks, been busy w/ life.
Anyways, I believe this downtrend is nearly over if we consider this recent correct market structure as a running flat .
The only concern with this is that within the b-wave, its ascending triple Elliott wave has an overextended wave Z with a ~1.618 fib level rather than a 1.272 fib as stated on one of the guidelines according to Elliott wave forecast. But ignoring this, it perfectly fits within a running flat corrective wave.
As of now, it seems like it'll end near the primary wave 0.382 fib level at ~54k. But we must hold 51k or else the entire market structure shifts bearish heading to sub 30k levels as it is an invalidation level for wave 3. The oscillator below, the BBWP (Bollinger Bands Width Percentile) is reading a close high of volatility at 90% atm. Going at or above 95 followed by a drop crossing under the associated MA (the white line) will signal the start of a consolidation phase . I didn't include it in this chart, but there is also a momentum bullish divergence on the 1 hour that growing has yet to be confirmed with a crossover of the zero line.
Key levels:
SUPPORT
- Primary wave 0.382 fib at 54k
- M CPR Pivot at 54k
- 3 Month Value Area High at 51k
- 3 Month PoC at 47k
- Lower Parallel Channel at 53k
RESISTANCE
- Confluence of multiple monthly value areas at 59k
- Monthly Value Area High at 65k
- M CPR R1 at 66k
- Long term trendline since March ATH at 67-68k
- Intermediate wave 5 target at 74k
- M CPR R2 at 78k
INVALIDATION
- Primary wave 3 0.5 fib at 51k
There are more levels to look at on the chart if you are interested in long-term plays.
I will post an interesting chart soon, so be on the lookout for it.

MASK UP! NU VARIANT INCOMING!Hello all,
I do not advise you financially, i just draw on charts that I think are interesting or requested to do so. This was requested by @edwardcryptoamos | Kudos to you allow me to add your name here, trader.
I drew my usual trendlines on a large timeframe and measured angles. Measuring the angles indicated that the shorts are acting like underage 17 year old girls trying to drink at a bar using fake ID's. This was calculated using a special formula that I have spent many, many years to make. I mainly studied my math on "MIT OpenCourseWare" (highly recommended by the way). They taught me to be creative and to not rely on the system in order to live. I think that I was disadvantaged because I wasn't able to be graded by doctorates. I am a good listener though, so I believe my math is A+.
The new support lines indicate that the bulls are acting like responsible alcoholics using real ID's and bar hopping constantly. The exposure to all the dirty bar bathrooms (sometimes on knees to crawl under the locked restroom stall), the sheer amount of variance of community interaction and drinking from dirty china that was cleaned hastily (for more tips $$$$) indicates that they will need to mask up next month because of the NU-COVID VARIANT.
tl;dr
shorts are 17 year old girls
longs are 21 year males prowling
Good luck trader, Trade Zen.

XAUUSD - Elliott wave – update - minute wave ((ii))
XAUUSD - Elliott wave – update - minute wave ((ii)) - running flat
invalidation - impulsive wave must follow

Running flat ? The last correction before the hypercycle ?
This is a possible so Protect yourself not with condom of course.

XAUUSD - Elliott wave – update - minute (ii))
XAUUSD - Elliott wave – update - minute (ii)) looks ended - confirmation over 1868.83
invalidation 1845.00

KLCI may done muti-months correction. 12/Nov/211)On Charts : Charts consist of 3-Dimensions - The X-factor ( Time or Cycle ), The Y- factor ( Price Geometry ), AND The Z-factor ( The Speed ).. 2)On Elliot Wave / Market Structure : Unlike Textbook written rule : ALL Impulsive wave comprise of ONLY a-b-c sub-waves NOT 1,2,3,4,5 waves.. AND there is NO Truncated 5th wave BUT ONLY wrong wave counts...

Why Cake isn't making big moves?Cake is now stuck in a barrier triangle ending Wave e at the top of the triangle (pink lines) means a downward move before bouncing upwards.
Reasons why we aren't seeing Cake making big moves.
1. Short Wave ii
2. Extended Wave iii
3. Hidden RSI divergence
Do note there might be a possible truncated Wave v as there has already been an extended wave iii.
Not financial advice. Only meant for educational purpose. All price actions depends on BTC hence, possible invalidation of my analysis. Please trade at your own risk.

HARTA may done long term correction. 29/Oct/21HARTA may completed its running flat pattern abc (green).. at RM5.440 where wave c (Green) price stalled at :- 1) Lower Trend Line ( Cyan/Light Blue Dashed) of wedge pattern/Ending Diagonal Pattern 2) Major Weekly Demand Zone (Cyan/Light Blue Slim Rectangle Box ).. Daily Chart might form a triple bottom where price will come close to RM5.550 before resuming up trend...Cut Lost for the long will be at RM5.440.. Target Profit is above RM20.00

CADCHF - The Perfect Correction 🔥CADCHF is currently showing us the perfect correction. In Elliot wave theory, this correction is called a Flat correction made up of 3-3-5.
3 waves - WXY (Wave A)
3 Waves - WXY (Wave B)
5 Waves - 12345 (Wave C - we are currently in Wave C)
After the massive impulse in February 2021, price has been stuck in a parallel correction. Within that channel, we can see a number of corrective moves that could have been caught using elliot wave theory. The bigger channel is supporting the ABC corrective move.
Wave A - 3 waves. The price action to take us from the top of the channel to the bottom is the move marked WXY in red. Within that move, we can see that we had 2 minor ABC moves.
Wave B - 3 waves. was similar where we had an WXY move and within that, had a minor ABC move.
Wave C - 5 waves. We are currently in the bigger wave C now where it has 5 waves to the move with wave 3 being the biggest. We are currently in wave 1 of the bigger Wave C)
Trade Idea:
Watch for wave 2 - this will be a corrective move. Once you have identified wave 2, you can catch the big wave 3!
If you enjoyed this little breakdown, leave a like and comment what you think!
As always, trade safe.
