Elliott Wave View: Russell Should Extend LowerElliott Wave sequence in Russell (RTY_F) from May 6, 2019 high (1621.9) appears incomplete favoring further downside. The bounce to 1571.5 in the Index ended wave X. Index has extended lower in wave Y and broken below the previous low on May 14 low (1516.7). This suggests the next leg lower has started. The internal of wave Y is unfolding as a double three Elliott Wave structure. Down from 1571.5, wave ((w)) ended at 1492.9 as a zigzag Elliott Wave structure where wave (a) ended at 1522.1, wave (b) ended at 1548.9, and wave (c) ended at 1492.9.
Wave ((x)) bounce is now complete at 1523.90 peak while below there should extend lower. We don’t like buying the Index, and as far as pivot at May 16 high (1571.44) stays intact, expect Index to move lower. Potential target to the downside is 1441.85 – 1466.32 area where cycle from May 6, 2019 peak reaches 100% extension.
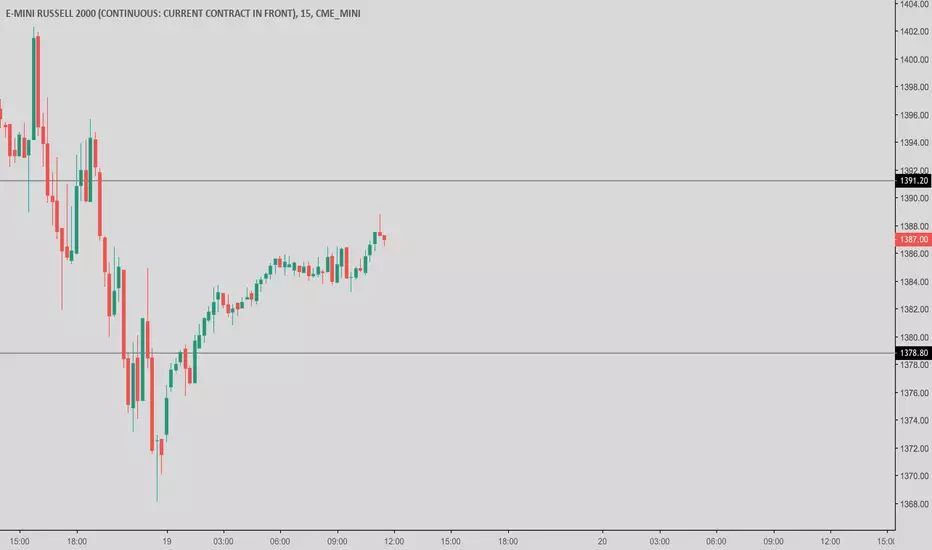
Russell

Russell 2000: No man's land at the moment.RUT is practically neutral at the moment as the 1D Channel Down (RSI = 46.549, Highs/Lows = -4.0275, B/BP = -30.2779) keeps the index bearish while 1W (excluding the early Dec - late Jan extreme) supports it (RSI= 49.965, Highs/Lows = 12.4371) from a greater fall. So far Russell is a no-action asset but we are willing to go long on the upward break-out of the 1D Channel Down. TP = 1,600 and 1,620 in extension.
** If you like our free content follow our profile (www.tradingview.com) to get more daily ideas. **
Comments and likes are greatly appreciated.

The Russell 2000 Index (RUT) Sends Out Bearish Signal, Crash...The Russell 2000 Index, which tends to move before the S&P 500 Index (SPX) has broken below support with strength.
On the chart above we can see that the RUT broke through EMA50 and EMA100 like hot butter. This can lead to a retrace as far down as 0.618 Fib. just to start, it can go lower.
The MACD is entering the bearish zone with plenty of room left for more down.
The RSI is also looking extremely bearish.
If this index is an indication of how the conventional markets will move then prepare for some strong bearish action in the weeks ahead.
This quick analysis is shared as a follow up to my SPX analysis here:
This is just a friendly reminder.
Thanks a lot for reading and your continued support.
Remember to hit like.
Namaste.

Russell leading the consolidation pack?A quick update on the count for those following the index.
Nasdaq, S&P and Dow all starting to see some decent profit taking as we enter into resistance again. Here watching the Russell as there's a good chance the market has completed a 5 wave impulse move from the 16 lows.
The correction if the above assumption is right, means that this ABC retracement may have completed after we touched 1300 and we are now entering into a multi-month consolidation period. This will be a wide range, however, with plenty of opportunities on both sides of the pig.
Thanks all

Russell2000 (RUT) Crash Incoming (30% Drop)Looking at the RUT chart, I can see that a strong drop will be coming, this can be around 25-35%, but it can vary depending on how the markets develop.
The last crash happened back in 2008 for a huge 60% drop. We can expect something similar to happen now as support is found on EMA200 (orange line).
The bearish divergence is clear once again, if you take a look at the MACD and RSI.
Other stocks and indexes are also crashing... It is clear that bad news are coming to the conventional markets... Time to move to crypto.
Dow Jones Industrial Average (DJI) Preparing for a Huge Drop!
NASDAQ COMPOSITE (IXIC) To Continue Falling!
S&P 500 Going Lower (7%+ Drop)
Bank Of America (BAC) Will Drop Hard (90%+ Crash?!)
Make sure to share your valuable opinion in the comments section below.
Let us know what you think will happen in the years to come.
Namaste.


Equities' Last Push 7-31-18Friends, as you can see from the linked ideas I have been able to use fib levels to good effect when predicting where price will go. Let's use them once more! As we can see, the Nasdaq (as well as several other indices including the all-important Russell 2000) have been bouncing off respective fib levels. Russell once again seems to say GO. This time, however, I expect limited upside. It appears the markets are in a larger-scale consolidation. They may be rolling over or, as the case may be, gathering strength for new highs. I'm sure the exact move will depend somewhat on the news. I conservatively target the boundary of the consolidation for trade completion.
The Nasdaq in particular has been hard-hit due to poor numbers from tech names, and may be due for a rally.
A trade is Nasdaq at this level is a 1:4 / risk:reward.

Russell short (RTY) set up Short set up found on a 45min chart for the RTY Futures contract. Level is 1589.40-1585.50. 39 tick risk. Target at 1568. RR 4.5:1

RTY Russell 2000 Futures LongThe small caps have been killed but I think we may be in for a nice bounce targeting the 1590 area for 30 point upside.
Directional Bias: Long
Price Target: 1590 on RTY Futures
Good Entry: 1548-1555
Risk/Reward: Max risk of 10 points/30 point reward.


$RTY_F stuck in a 4 month Bracket CME_MINI:RTY1! Next move outside will provide some nice quick movement based on the amount of time growing inside this bracket.


NOW THIS IS OVEREXTENDEDThis chart is based purely on technicals from the crash in '87.
I'm amazed how consistently markets "mean revert".
With no consideration of fundamentals, I think the over extension is happening because of the over correction in '08.
No matter how you look at it though, the next crash will be bad regardless of when it happens.

Russell 2000 3 Day StudyPlease reference image.
Current candle closes below trend and below Bollinger Band basis. Suggests futher downside. New candle tomorrow.

IWM Broken Wing ButterflyTaking advantage of a little IV in the Russell with a Put BWB.
Trade Setup:
-1 IWM Mar 17 134/136/136/137 Put Butterfly @ 0.18
DTE: 31
Max Win: $118
Max Loss: $82
Breakeven: $134.82
Trade Management: I will look to take 50% off this trade if we come down to $136.00 in the upcoming cycle, so around $59. If the market decides to crash, I am comfortable with the risk in the trade. I would likely take of the winning put side of this strategy and roll out the short put side for more premium, if that was the case.
Because of the structure of this trade, you will see that this trade has $0 upside risk and will in fact, end up with a max of $18 win if the options expire worthless. We will see if we get there.
Green is profit zone; vertical bar is expiration.


Linear regression suggest an uptrend in RUSSELL 1000A r(0.942) linear regression on Russell 1000 index suggests an uptrend in the coming months. There are two possible scenarios:
(1) the trend continues to travel along the linear regression channel eventually reaching the ~120 level.
(2) in a less likely pattern, the price breaks the 5 regression channel, and then bounces back in the strong support level at ~86
I am going LONG on this. Traders should take special care trading and watch for worldwide events that may have a negative impact on it.
---
"If you have trouble imaging a 20% loss in the stock market, you shouldn't be in stocks." - Jack Bogle

Not Much Left of IWM's UptrendWave (V) should exceed wave (|||)'s high, but a major three-wave decline should be expected after that. Not the time to join the bulls now.

LONG Russell 1000 Value / SHORT Russell 1000 GrowthLong Russell 1000 Value / Short Russell 1000 Growth
In a market with declining corporate profits and a stagnant real disposable incomes, growth is scarce. However, with bond yields indiscriminately driving equity valuations towards records across nearly all sectors (both cyclical and non-cyclical) value is even more scarce, and becoming scarcer as multiple expansion drives US equities to all-time-highs.
There are many other reasons for the return to value, including crowding within many sectors (e.g. XLP) and names (notably 'FANG'). With the US equity market beginning behaving almost like a bond, any sort of yield shock (see linked ideas) could spark a simultaneous sell-off in equities , causing a rush for the exit in a market with little margin for error. In this event, less crowded/under-owned sectors ('value') would provide a greater cushion for equity investors and help them weather the volatility.
Bringing it back to textbook market theory, value should outperform growth in a rate hiking cycle. Whilst the consensus expects US rates to remain low, and possibly even be cut, any sort of upside surprise in inflation (energy prices on top of rising core pressures) or economic growth prospects (oil 'dividend', or the US avoiding a recession in 2017) will likely see the Fed press on with further rate increases following the announcement of the current hiking cycle in December 2015. The repricing of Fed funds implied probabilities for a rate increase following the June and July jobs report illustrated this perfectly.
Natural resources and financials remain the two 'value' sectors in the US with abundant single name opportunities to choose from. Within Europe it is a similar story, with automotive and real estate featuring to a lesser extent.
Consider a spread trade LONG Russell 1000 Value / SHORT Russell 1000 Growth (IWD/IWF) with the ratio towards the lower 2016 channel line, expecting reversion to the middle of the range before making a higher-high.
For further insight and discussion please contact me via Tradingview or LinkedIn , on Twitter @James_LVDTA, and visit www.lexvandam.com to become a member of the Trading Club.

GoPro's comeback? Seeing technical and fundamental reasons to take a position here...
Double bottoming at $10.
www.theverge.com
Nevertheless do keep a lookout for Russell 2000 to manage your positions accordingly if risk off
