RUSSELL 2000, Trading Above Keylevel With Continuation Possible!Hello Traders Investors And Community, welcome to this analysis about one of the major stock market indices RUSSELL 2000, its 4-hour timeframe perspective, the recent price-action, the current formation and what to expect from the index the next times. Similarly to other preliminary indices the RUSSELL 2000 has recovered from its heavy corona breakdown seen this year but this does not mean the bear-market is overall over, in this case, all the main stock market indices begin to struggle with their uptrend growth and either consolidating or already building up downside potential, therefore, it is important to look at the facts and realistically measure what is possible in the next times and what is unlikely to do not get overwhelmed when things move into the reverse perspective, therefore I detected some important signals which will determine the further outcomes of this index.
When looking at my chart now you can watch there that the index formed a symmetrical triangle below the meaningful falling resistance marked in blue which formed by the all-time-high and the tops formed in last price-actions. This triangle has successfully confirmed to the upside and the index managed to closer above the important falling resistance line where it consolidates currently as you can watch it marked in my chart, this consolidation and breakout occurred are two decent bullish signals playing to the possibility that the index can continue with bullish rising to the upside when there do not come any bearish signs which invalidate this scenario again. Furthermore, the trading above the 60-EMA marked in cyan in my chart is supporting this scenario which will be confirmed properly when the index manages to break out of the consolidation and move on as it is shown in my chart.
Taking all these factors into consideration the index currently provides a more bullish than bearish outlook on the short-term, this is really important to note that the index has some potential in the short-term but it will run inevitably into resistance levels higher in the structure, this means a bearish reversal is not totally out of the sight as the uptrend begins to struggle and slowly don't this should not be kept by side. Also, the real economic situation is still providing a big divergence to the stock-market where real economy is damaged by corona and the stock market making almost exceptional growth to the upside where retail moves into the market while smart-money stays out of it this isn't a healthy environment where both factors real economy and stock-market growing together and therefore should not be ignored considering the next months and outcomes where the speculative rallies can reverse and lead to a shaky downside environment.
In this manner, thank you for watching, support for more market insight, have a great day, and all the best to you!
Information provided is only educational and should not be used to take action in the markets.
Russell

🟩 Smaller stocks are showing valueThe small caps are getting to levels when they show value based on earning yields nad based on relative strenghts.
These are the levels we saw before when the Russell 1000 started outperform the Russell 2000. Hence this is showing a potential broadening of the rally and give confidence to traders to not stick to the Mega Caps (FAANGS).
Rather, this is showing traders, that as long as stocks setup, you can stay synced with the theme.
TVC:RUT and TVC:RUI

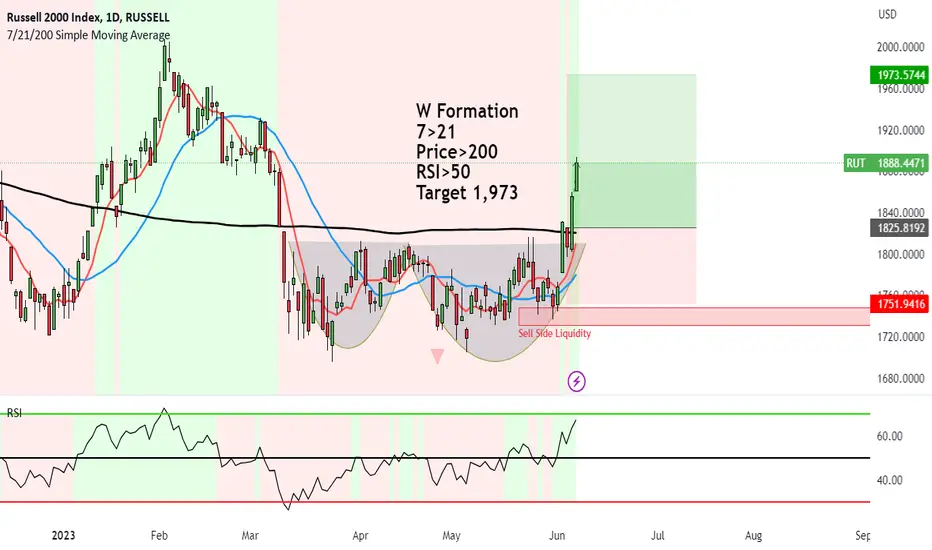
Russell 2000 showing strong upside after W breakout to 1,973W Formation formed on Russell 2000.
I missed the boat on this one. There are just so many markets so little time to focus on.
It had the perfect buy setup with all the criteria.
Anyways, those that got in, there is more upside to come.
7>21
Price>200
RSI>50
Target 1,973
ABOUT THE RUSSELL 2000
The Russell 2000 is a stock market index that measures the performance of approximately 2,000 small-cap stocks in the United States.
It was created by the Frank Russell Company in 1984 and is maintained by FTSE Russell, a subsidiary of the London Stock Exchange Group.
The Russell 2000 is widely considered a benchmark for small-cap stocks and is used by investors to gauge the overall health and performance of the broader small-cap segment of the U.S. stock market.
The Russell 2000 has a diverse range of constituents, covering various sectors such as technology, healthcare, finance, consumer goods, and industrials.
The Russell 2000 is often used as a benchmark for mutual funds and exchange-traded funds (ETFs) that focus on small-cap stocks.
CRITERIA TO GET INTO RUSSELL 2000
To be eligible for inclusion in the Russell 2000 index, stocks need to meet certain criteria set by FTSE Russell.
Market Capitalization:
The primary requirement is that a company must have a market capitalization within the defined range for small-cap stocks.
I'm not sure what this is set to at the moment. But I imagine it's smaller than the large cap stocks :P Somewhere around within the range of a few hundred million dollars to a couple of billion dollars. This is out of my knowledge point as I'm a South African :)
FTSE Russell determines the specific range annually during the reconstitution process.
U.S. Listing:
Stocks considered for inclusion in the Russell 2000 must be listed on a U.S. exchange, such as the New York Stock Exchange (NYSE) or NASDAQ.
Share Price:
Stocks need to meet a minimum share price requirement to be eligible for the Russell 2000.
The specific threshold is determined by FTSE Russell.
Also not sure but I believe it's typically in the range of a few dollars to tens of dollars (can we say that?).
If you know more information please let me know as I'm a South African and not really sure about criteria with US stock exchanges and markets. Sorry. Regardless, it looks like it's going to continue up!
Macroeconomics for Crypto.Why bitcoin does not go with the S&P?This is research is to figure out where and when to look for the bottom of bitcoin. More importantly when to get out of it if we have a bull run. This may be something new to you, but macroeconomics is crucial here. And this I will try to explain it.
The main hypothesis is that the cryptocurrency market has become highly institutionalized, the guys from Wall Street came here. They don't know how to trade from the level, unfortunately, but they know how to do macro sentiment - and Bitcoin became part of their portfolios and now trades the same way as the stock market. Bitcoin has all but lost its independence when Wall Street the weekend trading volumes and volatility is very low almost nothing happens.
In 2018 guys like Fidelity came into cryptocurrencies. In 2020 they invited their rich clients and it was a turning point, since then all major banks and funds have been sending their clients compilations with analytics on cryptocurrencies
This is an example from UBS bank
It's not what we're used to seeing in Tradinvgview or on Twitter, but it's nothing complicated
My opinion is that, the connection between cryptocurrency and stock market will only increase, so I urge all traders and investors to pay attention to the way Wall Street analyses work. Their job is to constantly monitor the analysis of the two economic cycles: business cycle and stock market cycles
This is a schematic representation, the cycles are unsynchronized. The stock market is a reflection and result of the expectations of traders as to what is happening or will happen in the business cycle
Business cycle scheme
Everything starts with a reduction in interest rates by the central banks or with an increase in government spending, loans and mortgages become cheaper, the housing sector grows first - houses are built, more resources and materials are spent, the economy comes to life. People buy homes, make repairs, buy appliances, furniture, buy cars, have children, pets. They multiply their consumption, buy a second TV in the living room, subscribe to netflix, go to barbershops and beauty salons - the manufacturing and service sectors grow, unemployment falls, household incomes and corporations grow, and prices rise with them. Consumption peaks - inflation becomes dangerous - the Central Bank raises interest rates - credit and mortgages become more expensive - the housing sector collapses followed by the manufacturing and service sectors, unemployment rises, household and corporate incomes fall, consumption slows, inflation slows down.
Sometimes there is a recession, the central bank lowers interest rates - the cycle is closed 😀
This year, almost all central banks in developed emerging markets are raising interest rates.
Fact - 50% of all macro analysis will come down to assessing the likelihood of interest rate increases or decreases.
Obviously there is money, there is growth and vice versa there is no money, no growth.
We're about here in the middle of the cycle, a global recession is likely ahead
All this is necessary and important to understand in order to assess the prospects and dynamics of stock prices on the stock market. We are used to the fact that there are many companies whose shares are traded on the stock exchange, and the companies themselves are divided into sectors and industries for classification. The first to react to the expectation of economic recovery are the sectors of financial housing and transport and so on. The logic was described above - mortgage, Home, Car, Kids, TV, netflix subscription and barbershop, etc.
Wall Street looks at the stock market a little differently, through factors, that is, properties of certain groups of stocks, for example: industry sectors are commonly divided into cyclical - these are goods services secondary necessities that are highly dependent on the business cycle and non-cyclical - that is, these are goods services primary necessities that are not so highly dependent on it.
The first - will respond cyclical, the factors are hundreds, but I will tell you with the most important and understandable. Imagine we take all the stocks and sort them by properties, by volatility, by beta, by dividend yield, by business margins, by multiples and so on so by these factors the stocks are sorted into a whole group.
The first factor I consider is the volatility factor aka beta imagine an index of unprofitable junk companies like Virgin Galactic and other meme stocks this will be the extreme manifestation of the beta factor and the riskiness of the idea in Ark innovation by Cathie Wood - it consists of just that.
The Quality factor is dividends, blue chips, s&p 500 index, Dow Jones is about them.
The Value factor is the value of perpetually undervalued companies with low multipliers, the core of the real economy, they also have their own index, Russell 2000
Growth factor - Growth stocks are companies with prospects of perpetual revenue growth Apple Tesla uber is them And the nasdaq 100 is their index
The Size factor is about capitalization small, medium, large, huge
The institutional manager's view on the composition of the portfolio is approximately as follows: there are two modes of money and no money.
When all is well, money is worthless, cash is trash. The manager buys into his portfolio everything that has high risk and high profitability, high-risk assets: IPO, SMall Cap, venture capital, cryptocurrencies, etc.
When the regime is like now, when money is expensive and everybody needs it, the riskiest part is sold first, and further down the chain the portfolio increases the share of cash and bonds from the shares.
Here's how these factors look within the stock market cycle. High-risk cyclical small-cap stocks are the first to respond to rate cuts and economic recovery. Next come value stocks, then quality stocks, then growth stocks. Eventually the party ends for everyone and everything goes down, risk OFF mode kicks in.
Finally, Bitcoin's connection to the stock market
Next you will see the result of a manual correlation search with thousands of stocks of different factors and other asset classes.
I will show just a few : the orange line is what we are comparing to, the blue line is the bitcoin scale logarithmic.
correlation coefficient on the right - peak correlation and current correlation
look only at the visual picture
First s&p 500 index is a quality factor peak correlation 88 current 68. Large Cap, Quality, Low Beta
For example Coca Cola - Correlation is negative.
Nasdaq 100 factor Grow stock growth peaks correlation 86 current 72 is little
is the Russell 2000 Value Factor Index And in it most of the small and mid-cap companies from the real economy cyclical sectors in the Peak correlation 93 now 79
The transport industry index in Peak is 95 current 82
Bank index 94 peaks 30 now
If Bitcoin were a stock
it would be an asset: Value, Cyclical, Small Cap, High Beta, High Risk asset.
Stock - value, cyclical sector, small capitalization, high beta and high risk
Its place in the cycle starts from where all cyclical industries like transportation, small capitalization companies with the value factor before the recession
Here's what the dynamics of the various stocks look like depending on the macro regime actually this is the main chart look at top Bitcoin next comes the SP500 below the Russell 2000 index and the nasdaq 100
From the covid bottom After the rate cuts, everything went up - it's understandable high risk and loss assets rose the most. But of the indices, it was the Russell 2000 that showed the most growth
February 2021 marked the vertical lines , inflation expectations hinted that things would be very bad and the entire high-risk segment of the portfolios began to close. the highbets and High Risk were the first to go under the knife.
The Russell 2000 stayed basically the same as Bitcoin for a whole year, but it moved stronger.
And the Nasdaq 100 and s&p 500 continued their movement.
This January's response is the second vertical line turned risk OFF for all assets and the party is over. Bottom line Bitcoin doesn't go for the nasdaq it doesn't go for the s&p 500 goes with the Rassell 2000 index and high-risk assets as part of someone else's portfolios.
So we have already seen a new bull run early and it will quickly start and quickly end we should try to be ready for it and not wait for miracles.
I really want to remind you that bitcoin's bottom and peak is not a price or a date - it doesn't work that way. It is a period of macro regime change from risk on to risk off and back
I have a plan for How to watch and how to act. Thank you very much for your attention. I wish you success in trading and learning the macro, I am sure you will find it very useful .
I would also like to thank Anton Klevtsov for the information
Best regards EXCAVO

Russell 2000 (RTY) Looking to Break LowerRussell 2000 (RTY) Cycle from 4.3.2023 high is in progress as a 5 waves diagonal. Down from 4.3.2023 high, wave (i) ended at 1752.7 and rally in wave (ii) ended at 1825.43. The 1 hour chart below shows the chart starting from wave (ii) peak. The Index then resumes lower in wave (iii) towards 1731.7. Internal subdivision of wave (iii) unfolded as a 5 waves impulse. Down from wave (ii), wave i ended at 1794.8 and rally in wave ii ended at 1814. Index resumes lower again in wave iii towards 1733, wave iv rally ended at 1748.80. Final leg wave v ended at 1731.7 which completed wave (iii).
Index then corrected in wave (iv) with internal subdivision as a zigzag Elliott Wave structure. Up from wave (iii), wave a ended at 1762 and wave b pullback ended at 1742.20. Final leg wave c higher ended at 1796.50 which completed wave (iv). Index resumes lower again in wave (v). Down from wave (iv), wave i ended at 1720.4 and wave ii ended at 1778.9. Wave iii ended at 1716.70. Expect wave iv to fail and Index to resume another leg lower to end wave v of (v) of ((i)). Afterwards, Index should rally in wave ((ii)) before it resumes lower again. Near term, as far as pivot at 1825.43 high stays intact, expect rally to fail in 3 ,7, 11 swing for further downside.

IWM Russell 2000 RUT affected by the SIVB collapse! Puts to buy!After the last RUT Russell 2000 Price Target was Perfectly reached:
Now you need to know that many of the Russell 2K companies will be impacted by the SIVB collapse.
Roughly 50% of the US venture capital-funded startups are clients of SVB , potentially putting 65,000 startups at risk of payroll disruptions. Such a situation could have significant consequences for the startup and tech sectors.
Silicon Valley Bank did business with FTX, plus many other formerly overvalued tech companies.
With $210 billion in assets, $SIBV was the 15th largest bank in the US in terms of deposits.
IWM puts considering buying:
2023-4-21 expiration date
$169 Strike Price
$3.65 Premium
Looking forward to read your opinion about it!

Elliott Wave Projects Zone where Russell (RTY) Rally May FailRussell 2000 (RTY) ended a 3 swing corrective rally from 10.13.2022 low at 2016.90 on 2.2.2023 high. From this level, the Index declines lower with internal subdivision as a 5 waves impulse Elliott Wave structure. Down from 2.2.2023 high, wave ((i)) ended at 1906.2 and rally in wave ((ii)) ended at 1970.10. The Index resumes lower in wave ((iii)) towards 1728.5 and wave ((iv)) rally ended at 1800.8. Final leg wave ((v)) ended at 1708 which completed wave 1 in higher degree. Rally in wave 2 is now in progress to correct cycle from 2.3.2023 high in 3, 7, or 11 swing before the decline resumes.
Internal subdivision of wave 2 is unfolding as a zigzag Elliott Wave structure. Up from wave 1, wave ((a)) ended at 1779.4 and pullback in wave ((b)) ended at 1750.40. Wave ((c)) higher is in progress as 5 waves. Up from wave ((b)), wave (i) ended at 1808.2 and wave (ii) pullback ended at 1785.30. Expect the Index to extend higher before it completes wave ((c)) of 2. Potential target higher is 100% – 161.8% fibonacci extension of wave ((a)). This area comes at 1821.4 – 1865.4 where the rally in Russell may fail and the Index starts to resume lower. As far as pivot at 2.2.2023 high at 2016.9 stays intact, expect rally to fail in 3, 7, or 11 swing for more downside.

3rd Dimension Analysis. One dimension analysis or the depth analysis can be studying into the financial data of a the company.
. Two dimension analysis is when the investor or trader studying into the chart - Price & Time.
. Third dimension analysis is where we combine one and two dimension analysis.
Third Dimension Analysis = TA + Depth
Micro E-Mini Dow Jones
Contract value, $0.50 x DJIA Index
Micro E-Mini S&P
Contract value, $5 x S&P 500 Index
Micro E-Mini Nasdaq
Contract value, $2 x Nasdaq-100 Index
Micro E-Mini Russell
Contract value, $5 x Russell 2000 Index
Disclaimer:
• What presented here is not a recommendation, please consult your licensed broker.
• Our mission is to create lateral thinking skills for every investor and trader, knowing when to take a calculated risk with market uncertainty and a bolder risk when opportunity arises.
CME Real-time Market Data help identify trading set-ups in real-time and express my market views. If you have futures in your trading portfolio, you can check out on CME Group data plans available that suit your trading needs www.tradingview.com

Did stocks just bottom? Are they going higher or lower?It looks like stocks bottomed today, but what is my evidence, and why would I say that?
1. This correction has been very orderly, and VIX has been going down along with stocks, which means something is happening.
2. Stocks have held exceptionally well despite rising interest rates and the DXY.
3. We have continuous liquidity injections by most central banks, and that doesn't just mean the BoJ and PBoC. Since the Sep-Nov issues that bond markets faced globally, even the Fed and Treasury have increased market liquidity.
4. Current debts can't be repaid. That's why bonds are going down (yields up). There is no way governments can't pay these dividends through taxation and can only repay them with printed money. Now you can hold both a depreciating asset that pays dividends and riskier assets. Chasing a fool's yield isn't ideal, but it's a strategy. Higher yields = more money supply will be created. High inflation isn't necessarily bad for stock markets, contrary to what the majority wrongly believes.
5. During this correction, sentiment has become increasingly bearish, with most investors being bearish.
At the CryptoBullSociety, in private channels, as well as on my Twitter account, I have been talking about the market piercing the 200 DMA and bottoming. Yesterday I shared bullish ideas on Tradingview for metals and Chinese stocks, which also permeates to US stocks after such a substantial rise since Oct 2022; the market needed to test bulls and, as usual, pull into the golden cross before going higher. On their way up, stocks swept some highs and filled some gaps, but some gaps were left unfilled higher, along with some newly formed double tops. Even if markets are about to go lower, I believe SPX will first test 4350-4400 and then go lower. By lower, I mean more of a sideways market than a continuation of the bear market or an outright crash. So far, we have seen the major US indices pull into their crosses, test support, sweep lows, and today form a reversal candle. Below are many US-related charts showing all the potential targets (double tops, double bottoms, etc.). The reason why I call them targets is that the market tends to break these structures. As we've been trending higher, it's more likely we will first take out the double tops and then the double bottoms.
Currently, nothing indicates a crash, while there are indications of a bottom being in. To be clear, I am not saying we are ready to fly to the moon tomorrow, although we could. Given the system's structure, with most governments being broke, more money will be created. Below you can see some charts of other stock markets, like the GER40 (DAX), UK100 (FTSE), and CN50 (CHINA). I also added the S&P500 value index, IVE. UK100 is at new ATHs, GER40 near highs seem to be in tight consolidation before expansion, CN50 appears to be back in a bullish trend after capitulation (something I talked about in yesterday's idea, which you can find below), and IVE almost made new ATHs a few weeks ago.
My overall point is that sentiment is bearish, while I believe liquidity will keep increasing, causing a short squeeze that could last at least until SPX gets to 4350. As I've mentioned in my previous ideas, it's unlikely that we would get a 2000 or 2008 crash so quickly after the Fed started tightening, and if we get one, it will probably be in Q4 2023 or Q1 2024. The path I've drawn in the chart is what I see as the most likely one, followed by another significant correction. Of course, I could be wrong, so my stop loss is at 3840

Elliott Wave Projects Russell (RTY) Should Resume HigherCycle from 12.20.2022 low in Russell (RTY) ended with wave 1 at 2016.97 as a 5 waves impulse structure. The Index then pullback in wave 2. Subdivision of wave 2 is unfolding as a zigzag Elliott Wave structure. Down from wave 1, wave (i) ended at 1986.3 and wave (ii) ended at 2015.60. Wave (iii) ended at 1938.8, wave (iv) ended at 1984.20, and final leg wave (v) ended at 1906.20 which completed wave ((a)).
Rally in wave ((b)) ended at 1970.30 with internal subdivision as a double three Elliott Wave structure Up from wave ((a)), wave (w) ended at 1964.1 and dips in wave (x) ended at 1921.30. Wave (y) higher ended at 1970.30 which completed wave ((b)). The Index has resumed lower in wave ((c)) with internal subdivision as an impulse. Down from wave ((b)), wave (i) ended at 1931.3 and wave (ii) ended at 1968.60. Wave (iii) ended at 1885.4, and wave (iv) ended at 1921. Expect the Index to resume lower within wave (v) of ((c)) to complete wave 2. Potential target lower is 100% – 161.8% Fibonacci extension of wave ((a)), which comes at 1791 – 1860.

Russell 2000 potential for bullish rise to overlap resistanceLooking at the H4 chart, my overall bias for RUT is bearish due to the current price being below the Ichimoku cloud, indicating a bearish market.
Looking for a buy entry at 1893.8737, where the 38.2% Fibonacci line is. Stop loss will be at 1722.0208, where the previous swing low is. Take profit will be at 2134.4378, where the overlap resistance is.
Please be advised that the information presented on TradingView is provided to Vantage (‘Vantage Global Limited’, ‘we’) by a third-party provider (‘Everest Fortune Group’). Please be reminded that you are solely responsible for the trading decisions on your account. There is a very high degree of risk involved in trading. Any information and/or content is intended entirely for research, educational and informational purposes only and does not constitute investment or consultation advice or investment strategy. The information is not tailored to the investment needs of any specific person and therefore does not involve a consideration of any of the investment objectives, financial situation or needs of any viewer that may receive it. Kindly also note that past performance is not a reliable indicator of future results. Actual results may differ materially from those anticipated in forward-looking or past performance statements. We assume no liability as to the accuracy or completeness of any of the information and/or content provided herein and the Company cannot be held responsible for any omission, mistake nor for any loss or damage including without limitation to any loss of profit which may arise from reliance on any information supplied by Everest Fortune Group.

RTY 1 BUYPeace be upon you, merchants. An opportunity to buy. With a breach of support in 1915. As well as penetrating the descending channel. Which humiliates the power of buyers in the market. The price is moving up. In the coming days we can see. Price 2120. And the price of 2200

Russell 2000 potential for rise towards overlap resistanceLooking at the D1 chart, my overall bias for RUT is bullish due to the current price being above the Ichimoku cloud, indicating a bullish market.
Looking for a pullback buy entry at 1889.4148, where the 38.2% Fibonacci line and overlap support is. Stop loss will be at 1722.0208, where the recent swing low is. Take profit will be at 2134.1183, where the overlap resistance is.
Please be advised that the information presented on TradingView is provided to Vantage (‘Vantage Global Limited’, ‘we’) by a third-party provider (‘Everest Fortune Group’). Please be reminded that you are solely responsible for the trading decisions on your account. There is a very high degree of risk involved in trading. Any information and/or content is intended entirely for research, educational and informational purposes only and does not constitute investment or consultation advice or investment strategy. The information is not tailored to the investment needs of any specific person and therefore does not involve a consideration of any of the investment objectives, financial situation or needs of any viewer that may receive it. Kindly also note that past performance is not a reliable indicator of future results. Actual results may differ materially from those anticipated in forward-looking or past performance statements. We assume no liability as to the accuracy or completeness of any of the information and/or content provided herein and the Company cannot be held responsible for any omission, mistake nor for any loss or damage including without limitation to any loss of profit which may arise from reliance on any information supplied by Everest Fortune Group.

The Russell Riddle: which chart is 2008? ($IWM W) For the answer, scroll down to the comment section.
Two charts of $IWM weekly TF.
One chart is current (as of 2/4/2023).
The other is 2008 ,up to 4 candles before the 50% drop.
Which one crashed 50%?
The conundrum: why do we assess current price action as bullish, when a similar pattern resulted in the GFC in 2008?
There are many possible answers, none of them wrong.
The one that interests me is the possibility that our bias is more extreme when we have experienced (traded) the price history. In this case it means experiencing the climb from the October 2022 lows. The alternative is basing our bias on the price history in a chart but *without* experiencing the returns themselves. For example IWM's similar price action in 2008. Any difference in sentiment would be consistent with studies showing that decisions made from experience often diverge from those based on description.

Russell Futures ( RTY1! ), H4 Potential for Bullish ContinuationTitle: Russell Futures ( RTY1! ), H4 Potential for Bullish Continuation
Type: Bullish Continuation
Resistance: 2033.0
Pivot: 1909.8
Support: 1832.2
Preferred case: Looking at the H4 chart, my overall bias for RTY1! is bullish due to the current price being above the Ichimoku cloud , indicating a bullish market. Expecting price to retest the pivot at 1909.8, where the overlap support is before heading towards the resistance at 2033.0, where the previous swing high is.
Alternative scenario: Price could head back down to break the pivot at 1909.8, where the overlap support is, before heading towards the support at 1832.2, where the previous swing low and 38.2% Fibonacci line is.
Fundamentals: There are no major news.

Russell 2000 Potential for Bullish ContinuationLooking at the H4 chart, my overall bias for RUT is bullish due to the current price being above the Ichimoku cloud, indicating a bullish market.
Look for a potential buy entry at 1789.4537, where the overlap support and 61.8% Fibonacci line is. Stop loss will be at 1722.0208, where the previous swing low is. Take profit will be at 1911.6949, where the overlap resistance is.
Please be advised that the information presented on TradingView is provided to Vantage (‘Vantage Global Limited’, ‘we’) by a third-party provider (‘Everest Fortune Group’). Please be reminded that you are solely responsible for the trading decisions on your account. There is a very high degree of risk involved in trading. Any information and/or content is intended entirely for research, educational and informational purposes only and does not constitute investment or consultation advice or investment strategy. The information is not tailored to the investment needs of any specific person and therefore does not involve a consideration of any of the investment objectives, financial situation or needs of any viewer that may receive it. Kindly also note that past performance is not a reliable indicator of future results. Actual results may differ materially from those anticipated in forward-looking or past performance statements. We assume no liability as to the accuracy or completeness of any of the information and/or content provided herein and the Company cannot be held responsible for any omission, mistake nor for any loss or damage including without limitation to any loss of profit which may arise from reliance on any information supplied by Everest Fortune Group.

RUT Russell 2000 Santa Rally U.S. stocks tend to rise during the Santa Claus rally period.
The Santa Rally is considered the last five trading sessions of the year and first two of the new year.
Since 1950, the S&P 500 has traded higher 78% of the time during the Santa rally period for an average gain of 1.3%.
My price target for RUT Russell 2000 is $1860.
Looking forward to read your opinion about it.

$SPR is on updtrend am looking for a pull back to get in. This is my set up at the moment.
Entry; $30.98
S/L; $30.20
TP1; $32.54
TP2; $34.88
Please always do your own search and analysis before you take any trade. Do not rely on anyone :)

$LNG in on both weekly and daily downtrendI am looking for a pull back to get in. This is my set up at the moment.
Entry; $148.47
S/L; $151.03
TP1; $141.35
TP2; $134.73
Please always do your own search and analysis before you take any trade. Do not rely on anyone :)

Yearly open price actionStocks closed pretty strong for the year, and the yearly open filled a gap very quickly. At the moment, I see very little evidence that the year will start with a massive dump, especially after 2022 was so brutal for stocks, bonds, and crypto. It looks more likely that things will first go up and then potentially go down. The market resuming its bounce makes more sense before it goes down again.
In my opinion, Q1 has the potential to be a bullish quarter, with SPX getting even up to 4400. It might be a massive bull trap, but it's possible. I think the Q1-Q3 period has the potential to be very choppy and much choppier than people imagine. Instead of having a clear trend, we might see a ton of chop that frustrates both bulls and bears, and then eventually a resumption either to the upside or downside, depending on what global liquidity is like and how markets force Central banks to act.
Even though I see a recession coming, I've been talking about how it wouldn't come in 2022 and that all we saw in 2022 was a slowdown and inflation, giving its place to disinflation. I doubt the recession will start in Q1 2023 and that markets might not crash until Q4 2023. At the same time, it's clear that the USD is in a challenging position and that the Fed is cornered while other central banks are increasing liquidity while raising rates. Maybe the market finally accepts that interest rates won't be higher than inflation over the next few years, and they price that in. Finally, we need to remember that the Fed started hiking in March 2022 and that the impact of their hikes could take anywhere from 12 to 24 months until they genuinely impact the economy.
So let's focus on what the current price action is telling us on SPX, NDX, and RUT. On my main chart, I have S&P 500 and the potential scenarios I see. I see the Monthly Pivot and the critical breakdown zone being tested. We currently have a double top at 3880 which will most likely be broken. A lot will then depend on whether the market will close above the Monthly Pivot. If it does, it may go significantly higher toward 4350-4400. Until I see a close below 3750, I don't think it makes sense to be very bearish, as the market is trading in a range, so it could first take out the highs, then the lows, and then move higher. It's, therefore, better to take it step by step.
For NDX below, we can see that the market has found decent support and could bounce. In my opinion, we will see new lows on Nasdaq much faster than all other indices, and I am pretty sure we will get new lows in 2023, even if we don't see other indices make new lows. For RUT, we are in a mini range, which is part of a more extensive range. And I think we first take the highs and then the lows. In my opinion, the market will trade both at 1630 and 1910, so it's all a matter of how we get to each point. Either way, both look very attractive for going long or short.

Russell 2000 Index - EXPLAINED - What, Why, Where, How?Small cap stocks, Penny stocks and pink sheets are the high adrenaline stocks investors play games in.
They are generally the cheaper, highly volatile, some are illiquid and can fluctuate 50% - 1,000% a day.
From the Wolf of Wallstreet glamorizing the potential returns for investors to your every day salesman broker trying to sell you the next winner.
But what is the Russell 2000 Index and what should we know about it?
I’m going to sum it up a bit of information about how it works and important facts you need to know
Enjoy!
WHAT IS IT?
The Russell 2000 Index (listed in 1984) is a stock market index that tracks the performance of small-cap publicly traded companies in the United States.
It is named after the Russell Investment Group, which operates the index.
The share price can vary significantly, as it is made up of a diverse range of small-cap publicly traded companies.
MARKET CAP
Small-cap stocks are generally ones with a market capitalization of between:
$50 million and $2 billion.
CRITERIA TO LIST STOCKS
There are a few criteria that needs to be met to qualify for the inclusion in the Russell 2000 Index:
• The company must be a publicly traded U.S. company.
• It must market capitalization of at least $50 million.
• Must be ranked in the bottom 2,000 of the Russell 3000 Index, based on market capitalization.
• Must meet certain liquidity requirements, including having a minimum average daily trading volume of at least 250 shares over the previous six months.
• Must have a minimum of one year of trading history.
WHAT IT CONSISTS OF
The index is made up of the smallest 2,000 publicly traded companies in the Russell 3000 Index, which represents approximately 98% of the total market capitalization of all publicly traded companies in the United States.
HOW IT OPERATES
The index is reconstituted annually, with new companies added and removed based on their market capitalization and other factors.
VOLATILITY & LIQUIDITY
The Russell 2000 Index has a high level of volatility (greater price swings) and low liquidity (ease of flow of orders) compared to other large cap stocks.
DANGERS WITH THE INDEX
Currency risk: When the US dollar drops the index can follow
Diversification: There is no sector for the stocks. When the index drops the stocks follow.
Liquidity: You might find difficulties finding buyers or sellers to ease in or out of your positions.
Volatility: The jumpiness in the market is highly erratic.
Lack of analyst analysis: You’ll hardly see news coverage via the media which means, you could be left in the dark with what is going on in the companies.
Liquidation risk: You have a higher chance at being in a company that is about to be liquidated due to financial issues, no growth, manipulation and cooking the books.
Economic issues: When global economies collapse, stocks drop with it. Small cap stocks are no exceptions. This can affect the investment prospects
.

Russell1806 Target Achieved..New Pattern DevelopingTechnical & Trade View
Russell 2000 (e-mini futures contract)
Bias: Intraday Bullish Above Bearish below 1785
1806 Target Achieved..New Pattern Developing
Technicals
Intraday 1785 is primary support
Primary upside objective is 1882/92
Failure below 1780 opens a test of 1760 H4 Value Area High
20 Day VWAP bullish, 5 Day VWAP bullish

RUT Russell 2000 Double BottomA double bottom is a reversal chart pattern in technical analysis that describes a change in trend.
RUT Russell 2000 is oversold at the pre-covid level right now on a double bottom chart pattern.
My price target is $1805.
Looking forward to read your opinion about it.
