Russell Targeting Equality Objective at 1937In this update we review the price action in the Russell 2000 and identify the next high probability trading opportunities and price objectives.
Russell2000

IWM [Russel 2000] Inverse Head & Shoulders & BreakoutThe IWM as seen from the chart has been forming a solid and strong Inverse Head & Shoulders.
An Inverse Head & Shoulders is a strong Bullish Chart Technicals Pattern, that can be seen here. 2 Shoulders, and 1 head in the middle, making the low.
I am sharing this idea, as it is a pattern which has been printed on the Russel-2000 this past week, and can't go unnoticed!
The Russel-2000 Index has also been in a YEAR-long consolidation, and is ready to make a move one way or another.
On the weekly time frame of the Russel, the TTM_SQUEEZE Indicator a momentum indicator that can also predict big moves has been flashing red (signaling squeeze) and that a big move is coming one way or another.
AFTER This recent breakout attempt in November from IWM, and a retest of the bottom consolidation levels, the russel seems ready to bounce up with this inverse head and shoulders, or make a break down.
I think this is something to definitely keep on your radar folks!
Good Luck Trading!
I am personally looking at playing this with either :
IWM febuary monthlys OR $URTY a 3x leveraged russel ETF

RUT Russell 2000 same level as December 2020The Russell 2000 index lost all its gains from 2021 and is now at the pick of December 2020.
I expect 2022 to be the year of this index, that has a lot of undervalued gems, like 2021 was they year of the Big Tech with high multiples.
Looking forward to read your opinion about it.

Bottom fishing Russell2000 and SPXMeasured-move, swing low, RSI daily oversold, markets overreacting (no reason for bear market). Good setup for bottom fishing.

RUSSELL 2000 SHORTAs we could see, the Russel was going sideways many months. Now we break out of the $2107 support this week. And that is very bearish. If the price will further go down and can not come back to its support level, we could have a much bigger correction (15%). This theory is pretty simple to thought, there is no important support line than $1706 because in this price range was mainly a bull run.

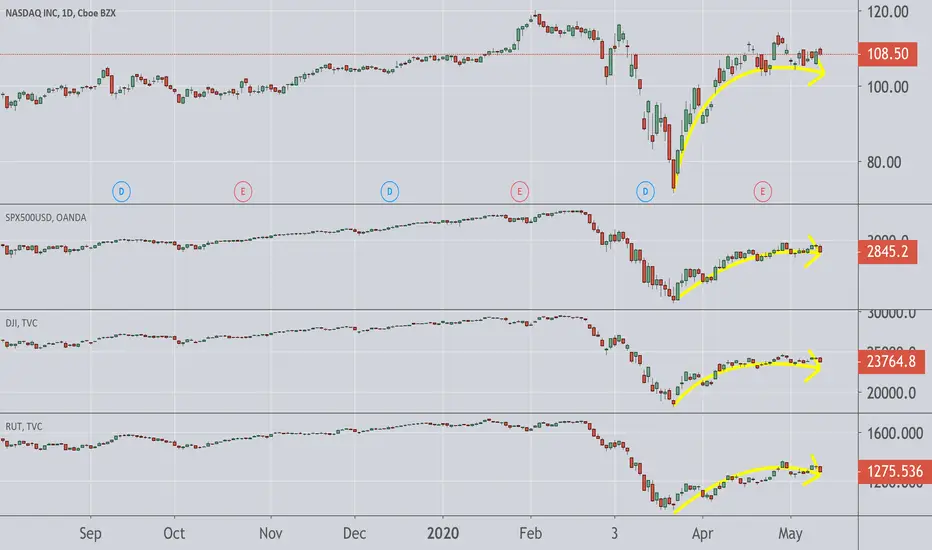
Tech Stocks - You got the curves ....Comparing these 4 major indices, you can see clearly that Nasdaq index is the one with the strongest retracement to date.
We can see the SPX500 , DJIA and Russell are showing signs of fatigue and probably the price action will consolidate for a while here before we see the next action.
If based purely on stock market being a leading indicator of the economy, then we can rationalise that the bull run remains intact. That means the other 3 indices must catch up with Nasdaq.
However, if we think that this is a merely a bear market rally albeit a fierce retracement, then it is a matter of time before the price tumbles down.
Review the 2008 chart and you will see that it has retraced by more than 60% before it tumbles down. We are only halfway there thus far (not saying it must reach 60% before coming down)
Another angle I was thinking many of the tech stocks like Apple, Facebook, Microsoft ,etc can easily have their employees work from home thus fulfilling the social distance measure and still get work done !
The small caps companies forming the Russell 2000 index may not have this luxury as they are more of manufacturing companies. They tend to be from traditional business and not the disruptive fintech type.
In weeks to come, when we look back at this chart, it would be more meaningful.
Sun Running Down a Hill? Sunrun - Intraday - We look to Sell at 29.04 (stop at 30.03)
Previous support level of 30.00 broken. We look for losses to be extended today. Closed below the 20-day EMA. The primary trend remains bearish. We look to set shorts in the early trade.
Our profit targets will be 26.22 and 23.50
Resistance: 30.00 / 32.00 / 35.00
Support: 25.00 / 23.00 / 20.00
Disclaimer – Saxo Bank Group. Please be reminded – you alone are responsible for your trading – both gains and losses. There is a very high degree of risk involved in trading. The technical analysis, like any and all indicators, strategies, columns, articles and other features accessible on/though this site (including those from Signal Centre) are for informational purposes only and should not be construed as investment advice by you. Such technical analysis are believed to be obtained from sources believed to be reliable, but not warrant their respective completeness or accuracy, or warrant any results from the use of the information. Your use of the technical analysis, as would also your use of any and all mentioned indicators, strategies, columns, articles and all other features, is entirely at your own risk and it is your sole responsibility to evaluate the accuracy, completeness and usefulness (including suitability) of the information. You should assess the risk of any trade with your financial adviser and make your own independent decision(s) regarding any tradable products which may be the subject matter of the technical analysis or any of the said indicators, strategies, columns, articles and all other features.
Please also be reminded that if despite the above, any of the said technical analysis (or any of the said indicators, strategies, columns, articles and other features accessible on/through this site) is found to be advisory or a recommendation; and not merely informational in nature, the same is in any event provided with the intention of being for general circulation and availability only. As such it is not intended to and does not form part of any offer or recommendation directed at you specifically, or have any regard to the investment objectives, financial situation or needs of yourself or any other specific person. Before committing to a trade or investment therefore, please seek advice from a financial or other professional adviser regarding the suitability of the product for you and (where available) read the relevant product offer/description documents, including the risk disclosures. If you do not wish to seek such financial advice, please still exercise your mind and consider carefully whether the product is suitable for you because you alone remain responsible for your trading – both gains and losses.


Most important level for Small caps..!The Russell 2000 Index is a small-cap stock market index that makes up the smallest 2,000 stocks in the Russell 3000 Index. It was started by the Frank Russell Company in 1984. The index is maintained by FTSE Russell, a subsidiary of the London Stock Exchange Group.
As you can see in this chart Small caps had a sinewave pattern in the past trading year, anytime they entered this level they bounce back:
A:
RUT close below 2080 this pattern could make a rectangular Top..!
B:
otherwise, we see another upward move between 10-15% in small caps!
You can see the most important support(green line) and resistance (red line) levels.
Best,
Moshkelgosha
DISCLAIMER
I’m not a certified financial planner/advisor, a certified financial analyst, an economist, a CPA, an accountant, or a lawyer. I’m not a finance professional through formal education. The contents on this site are for informational purposes only and do not constitute financial, accounting, or legal advice. I can’t promise that the information shared on my posts is appropriate for you or anyone else. By using this site, you agree to hold me harmless from any ramifications, financial or otherwise, that occur to you as a result of acting on information found on this site.

Bitcoin and the Russel 2000I noticed that the Russel seems to call tops and bottoms of Bitcoin
You can see in the chart notes, the Russel:
-coming up thru the midline marks a parabolic BTC move
-coming down thru the midline marks a BTC bottom
When we hold the midline as support, it denotes the BTC move is not over yet

My Forecast for 2022 Maret!First I want to express my gratitude to the +9000 Tradingview users who started following me in 2021 and supporting me with their likes and comments. I wish you all a year full of successful trades.
I also appreciate the @TradingView team's efforts to make the platform stronger in the past decade, it gives me more energy to write more detailed analysis, Nice job..!
Let's Go:
In these charts, you see S&P 500, Nasdaq 100, Dow Jones, and Russell 200 monthly charts and their rate of change(12).
As you can see the highest 12 monthly rates of change were recorded at the end of February 2021, for all major indexes, and then markets slows down!
2021 ends with an overall performance of :
SPX:+26.89%
NDX:+26.63%
DJI:+18.73%
RUT: +13.7%
* Better to adjust these gains for Inflation which is at the highest level in the past 4 decades (+6.8% YOY).
As it is obvious it was a bad year for small caps which leads the market by +90% return by February 2021 and they end the year at the lowest rank of performance by +13.7. Their performance loomed in the past 10 months, and more than 77% of that glorious gains melted in front of the eyes of novice investors who were looking for their tickets to the Moon or Mars or other planets..!
Now, let's review the previous analysis:
A review on my analysis 3 weeks ago..!
On December 16th, 2021, I published one analysis:
In that analysis, I mentioned that higher than normal volatility is expected and Money shifts to Banks, Energy, and Telecoms.
Complex correction is the most probable scenario!
Higher volatility (increased ATR):
looking at the performance of indexes in the past 3 weeks shows:
Dow Jones: +6.42%
S&P 500: +5.64%
Russell 2000: 5.07%
Nasdaq 100: 3.75%
Now let's review the performance of the sectors and industries I mentioned in the previous analysis:
Energy: +9.74% in the past 3 weeks(Equally weight-adjusted)
OXY:+14.47%
VLO: +12.62%
PSX: +12.24%
MPC: +9.96%
XOM: +8.28%
COP: +8.24%
CVX: +6.14%
BP: +6.09%
Banks: +6.64% in the past 3 weeks(Equally weight-adjusted)
WFC: +10.47%
BAC: +9.39%
GS: +6.47%
MS: +6.16%
JPM: +6.03%
C:+1.32%
Telecom: +2.83% in the past 3 weeks(Equally weight-adjusted)
T:+9.29% (max:+10.66%)
VZ: +3.99%(max:+4.4%)
TUMS: +1.14%(max:8.68%)
CMCSA: -3.07%(max2.55%)
Overall performance of the 18 stocks:
+7.18% in the past 3 weeks(Equally weight-adjusted) which is:
12% better than DJI(+6.42), 27% better than SPX(+5.64%), 41% better than RUT (+5.07%) and 91.4% better than Nadaq100(+3.75%) ..!
17 out of 18 stocks had positive returns.
14 out of 18 stocks beat the Nasdaq performance in the same timeframe!
10 out of 18 stocks beat the performance of all 4 major indexes mentioned above!
Conclusion:
1-The Energy and Banks sector could continue their rally in January 2022..!
2-Tech stocks especially those which still burn cash, will experience a hard time in 2022, and any positive must be considered as transitory!
3-Small caps may experience lower prices and even Negative returns in 2022.
4-SPX, NDX, and DJI could have 10-15% returns in 2022.
5-Keep in mind that 12 monthly rates of change decreased by half in the past 10 months for SPX, NDX, and DJI which means expected market ROI should be lower in 2022 in comparison to 2021 and 2020!
6-For small caps this phenomenon is even worse, they lost 85% of their gains, and continuation of this phenomenon could lead to a negative return in 2022. ( Fundamentals also support depreciation of unprofitable business in high inflation era)
7- 2022 will be the year for those who know how to handle high volatility! A year for aggressive portfolio management strategies!
I will provide updates for this analysis as needed.
Best,
Moshkelgosha
DISCLAIMER
I’m not a certified financial planner/advisor, a certified financial analyst, an economist, a CPA, an accountant, or a lawyer. I’m not a finance professional through formal education. The contents on this site are for informational purposes only and do not constitute financial, accounting, or legal advice. I can’t promise that the information shared on my posts is appropriate for you or anyone else. By using this site, you agree to hold me harmless from any ramifications, financial or otherwise, that occur to you as a result of acting on information found on this site.

Possible Recangular Top in Small cap's Index..!1- Closing below the 50EMA after 78 weeks
2- Sideway for the past 45 weeks
Possible scenario:
A: Rebound at 2080-2100 level
or
B: closing below 2080 level and further decline to 1780-1700 and completing a rectangular top formation
Best strategy: wait for A or B, it is not a good time to Short/Long
This time could be different:
and we may see a breakout
Education:
A rectangle occurs when the price is moving between horizontal support and resistance levels. The pattern indicates there is no trend, as the price moves up and down between support and resistance. The rectangle ends when there is a breakout, and the price moves out of the rectangle. (Investopedia)
You can see the most important support(green line) and resistance (red line) levels.
Best,
Moshkelgosha
DISCLAIMER
I’m not a certified financial planner/advisor, a certified financial analyst, an economist, a CPA, an accountant, or a lawyer. I’m not a finance professional through formal education. The contents on this site are for informational purposes only and do not constitute financial, accounting, or legal advice. I can’t promise that the information shared on my posts is appropriate for you or anyone else. By using this site, you agree to hold me harmless from any ramifications, financial or otherwise, that occur to you as a result of acting on information found on this site.
Reference:
www.investopedia.com

The markets may have actually topped...and let it be said that if it hasn't topped as of right this moment...it is FREAKING CLOSE... like sooo close. I can feel it in my bones.
The dollar is blowing up.
Fed is tightening (so far) They may reverse course and print infinity but that would cause a currency crisis which in my opinion would be wayyyy WORSE.
Crypto and other momentum assets are dropping like stones.
Cannabis stocks are ironically up. (which I think of as a recessionary signal, similar to cigarettes or alcohol stocks going up during bad times.)
We haven't had a 10% since Oct 2020 which is only 10 because I rounded up...
The DJI has produced an average gain of +50% per year over the last 2 years sine the massive monetary and fiscal stimulus. What is the average gain per year? How far will we need to fall to get back to the median line...?
I think this is the big one. To be honest I thought Mar 2020 was too, but that was just the warning signal. And that huge red arrow there is not the end of it... if this debt bubble is indeed bursting then one would assume that all of the progress because of said debt bubble should be erased more or less. So....at LEAST the last 12 years Hahaha! oh...it hurts...
But yeah. This is what I see. What do you see?

RTY - Millennium Tower IndexThe Russell 2000 continues to expend energy in a large Range which
remains in a weakened condition.
2282.50 was rejected.
There is little to support this as the Parking Lot is being vacated.
Small to Mid Caps are not faring well in the present Environment
with little reason to Position for 2022.
Slowly Sinking into a LArger Sell is ahead after the next Retracement.
___________________________________________________________
RTY / M2K will Ourperformi to the Downside.

The Russel 2000 Looks HorriblePlaying around with EWT and the Russel 2000 looks like it completed a wave 3 and has been distributing along with a bear trap breakout in early November when we got a high CPI print and the Fed said they will accelerate the taper. Macd cross as well...

Best places to go long or short the RussellThe Russell is even cleaner than the Nasdaq. Two major buy / sell areas on the chart. So far the Russell has been playing the game of chop. Sweep the lows, sweep the highs and move in the other direction. The same way we had a failed breakout, we could get a failed break down.
Best place to sell 2310-2360. Resistance/Gap combo and the real direction for now is down, so it is with the main trend.
2200 & 2080 are decent for short term trades. As we go down they are good for a bounce. If they get broken they are good to put shorts if the market bounces from lower.
Best place to buy long term is 1980-2030. Extreme support combo with 1. Untested breakout / gap, 2. Key Bollinger bands, 3. 400 DMA

Russell 2000: In the triangle and bullish divergenceWe are in the middle on the never-ending triangle on the daily chart. There was a false breakout a couple of weeks ago but it seems bulls are strong enough to break out this triangle once and for all. For swing traders, sell with an adjusted stop loss and for long-term traders, buy if there is a correction to the lower part of the triangle (2155) or after the correction if there is a breakout (2287). The bullish signal on the RSI is there and it must be taken into consideration and the 2575 level should be reached if the triangle breakout takes place, but normally, after 1 year going sideways, the uptrend should be much longer.

IWM time to retrace before going upHello Hello people.
Back with some conviction with this trade. Monthly fib in Red, Weekly in Blue and short term in Pink.
Last time the ride was good upto 222 which I posted last week. Now it's look little overextended and that gives some shorting opportunity.
A safe entry is below Blue fib line 222.40 and there are a lot of places to take profit as down as Blue 23% fib line 217. What's the stop loss probably 224.5
do your DD and good luck.

RUT Russell 2000 Santa Rally?The Santa Rally is set to start on Monday, Dec. 27.
This period gave positive return for the S&P 500 78.9% of the time.
Since 1950, the average return of the Santa rally was 1.33%.
How do you think this will be reflected in the Russell2000 index?
The reasons could be optimism over the new year ahead or holiday spending.

Trading Range on Nasdaq 100 FuturesWe are in Trading Range on the Russell 2000 Index Futures.
Like and Comment will be hugely appreciated, thank you so much for your support.
See other ideas below too!
RISK DISCLAIMER:
Trading Futures ,Forex, CFDs and Stocks involves a risk of loss.
Please consider carefully if such trading is appropriate for you.
Past performance is not indicative of future results.
Always limit your leverage and use tight stop loss.

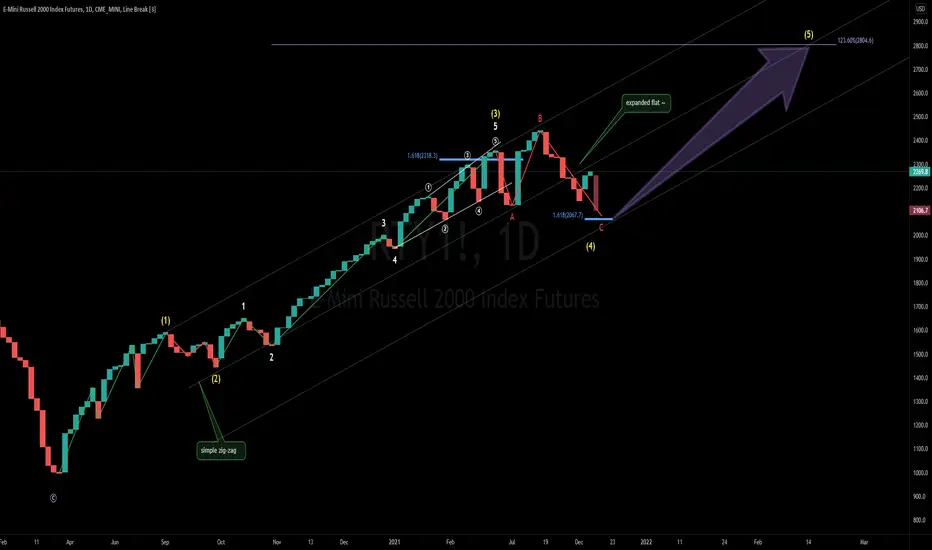
"most fear the unknown" iwm updatemost fear the unknown, and in turn they stay away from it,
i walk into the unknown with confidence, knowing there is always opportunity ahead.
----
iwm\rty (small caps) look to be on the verge of finding a big local bottom in this local region here through an expanded flat.
the law of alternation states: "if wave 2 was a simple zig-zag, then wave 4 will have to be a complex correction".
that's precisely what we're seeing here, a little complex correction phase to really shake out the weak hands out of this wicked market.
-----
wave 4 target = $2067.70
wave 5 target = $2800
Cheap Valuations for Fintech PSFERecent strategic partnerships and acquisitions, insider share buying, trading under a 2.0 P/S with ~ $1.5B annual revs and $120B transactional volume, and significant gaps to fill on the chart all make PSFE a no-brainer buy at these levels.
Just my personal opinion, not investment advice.

Russell 2000 touch downs.According to RSI this is a trough lands. RSI is just oversold way oversold since Covid's low.
