Major Market Dashboard - in 3D The distribution is currently underway with SPX breaking it's bear flag to the downside. NAS and the Russell are showing mirrored patterns; NAS is working on saving a right inverse shoulder and Russ challenging the neckline of a H&S
Russell2000

Russell20009.28.21 Advice for Countdaamoney using his chart..........................................................................

RUS2000USD continuing down side afterRUS2000USD continuing down side after an abc flat correction. Limit is at daily support.

Weekly Bearish Harami at PCZ of Bearish 5-0 on PalantirWe are at the PCZ of a bearish 5-0 and the weekly candle which is currently opened is as of right now a Bearish Harami but it hasn't closed yet but since i like to speculate and get the best price i will be entering a bearish position tomorrow in anticipation of the weekly closing bearishly and i suspect that it will make a lower low down to the 0.886 retracement.

Major indexes Review and Support level UpdateAll major indexes started the week with a down gap and have continued sinking so far.
These are the fact we should pay attention to:
1- 4786 out of 5816 traded assets are trading at lower prices today, 82.2%.
2- All major indexes trading below their 50 days moving averages
3- They are all trading near to the lowest daily numbers, which shows they are not settled down.
4- They just experienced 4-7% correction from their tops..!
5- This is the longest time in the history of the S&P 500 without a 10% correction.
6- September historically is the worst month of the year in comparison to other months in the past 70 years.
7- This correction must be considered as a correction unless we have enough evidence of trend reversal.
8- S&P 500 and Dow Jones have been closed at lower numbers 8 days out of the last 10 trading days, and NASDAQ 100 and Russell 2000 7 out of last 10 days closed at lower numbers! this clearly showed in short term more correction is more likely..!
In conclusion, I believe we should wait for a sign of reversal, and we do not have any sign yet.
Being ready is important:
Let's review the process of this analysis in the past few weeks:
DISCLAIMER
I’m not a certified financial planner/advisor nor a certified financial analyst nor an economist nor a CPA nor an accountant nor a lawyer. I’m not a finance professional through formal education. The contents on this site are for informational purposes only and do not constitute financial, accounting, or legal advice. I can’t promise that the information shared on my posts is appropriate for you or anyone else. By using this site, you agree to hold me harmless from any ramifications, financial or otherwise, that occur to you as a result of acting on information found on this site.

RTY - Russell 2000 a consistent Sell @ HighsIndependent Producers are being systematically crushed, slowly being
wiped off the Competition Map.
The Map itself is on a well defined Roll Up.
Wreck them, collect them.
Master of the obvious type stuff I know but many seem to cling to their
hopes.
The RUT has a large composition of Mixed Bags to hold.
Weightings:
Consumer Discretionary @ 13.1%
Financials @ 15.1%
Health Care @ 21..11%
Industrials @ 15.35%
Information Technology @ 14.13%
Communications, Consumer Staples, Energy, Basic Materials, Utilities,
Telecoms and Real Estate make up the balance.
A horizontally opposed group of Sectors... On the surface of it, many
would argue it is a balanced Index.
It is certainly not, it is a place where Wall Street Parks $ during periods
of indecision as it is a "Safe Place" for BlackRock and Vanguard to defend
positions.... there are 2,000, but a very few are needed based upon
the Sector weightings.
Total Volatility is Highest for the RTY relative to the ES YM NQ (NQ Being 2nd in VX).
___________________________________________________________________
We anticipate a run back up to the Top of the Range @ 2335, our last sell for
a great many handles due South.

Russell Futures The Running GiraffeLook at analysis. The Russell 2000 futures are clearly forming the classic "running Giraffe" Pattern. In all my year of charting, this is certainly the clearest this pattern has formed. Please tell me if you disagree.

Russel 2000: further upside potential?A price action above 2250 supports a bullish trend direction.
Remains above its 200-day simple moving average.
Upside price potential supports the bullish trend.
Improving bullish trend according to Heikin Ashi.
Might see a scenario of walking of the Bollinger Bands
Note the price action that is low according to the Linear Regression channel pattern. This also supports a bullish bias.

RTY and what I learn from my brotherI have not posted in few weeks and why is because I have working on new strategy. Everything I know of trading I learn from my brother honestly. He is the best trader I know and smartest person I know. He mentors me with trading. Much more in the past than now because I am a much better trader now. But he still helps me. He bankrolled my first trading account with 25000 USD and when I make this back I try and pay him back but he said keep it. Wow! I'm lucky. He is incredible with computers and he is a person that big companies hire to try and break in to their computers system and he finds the holes and weakness. (He got into a bit of teenage trouble for this, but he is very good man, now especially). He is also on tradingview but that is where I will leave it. Then he builds algorhythms that seal up the flaws. I don't pretend to understand. He also codes for trading strategies and I have the advantage of getting them no cost. but I digress. LOL
So I notice that after 6 months that my returns start to fade some. This is despite me not changing anything about my strategy. So I seek my brothers advice. I ask him if this is statistically significant or not. He did some analysis and said yes this is real and significant. When your strategy becomes less profitable the market has adjusted to your strategy and it is time to make some adjustments. He said he would give me the strategy he is using now, but I said nope let me figure this out. So I get to work and I come up with a strategy that uses a moving average, RSI and ADX/DI. No shapes or wedges, support or drawing. I like this.
I played around with my new strategy and use backtester that my brother uses. I find I can win almost 80% of trades with a risk reward of well over 3:!. I go to him and I say this can't be right. So he analyzed it too and came up with similar numbers. He said now for to forward test it for the real test. So over the past few weeks I did this and so did my brother. These are the results.
PuckBunny
total trades 72
wins 55
losses 17
win percentage 76%
reward to risk ratio: 3.53:1
Sortino ratio of 2.03
Brother Puckbunny
total trades 84
wins 69
losses 15
win percentage 82%
Reward to risk: 3.22:1
Sortino ratio 2.41
So of course he always beats me and I ask him how. he said he adjusted my moving average to change to longer or shorter depending on volatility. Thus more trades, more win percentage and more money. He gave me the indicator he built for this and make it dummy (me) proof by showing the sells and buys on chart.
An interesting part of this strategy is that the risk is quite large. In fact, in some trades the risk is 4 times more than potential reward. The thinking is that based on chance alone the price is much more likely to hit target than be stopped out. Add to this a directional bias and you have a winning strategy. the big risk is the opposite of what most of us were teach. However, he has built a safety being that he adjusts the stop in kind of a reverse trailing stop loss, based on how much below entry price is and volatility. So this big risk is rarely realized.
So I have been using this strategy for 1 week and I take 7 trades and win them all. Now this is my first one to post. You can see details on chart.
RTY long 2272 (you can see buy signal on chart)
stop loss 2166 (I know right?)
Let's see how this goes.

gold dxy Russell silver8.24.21 gold dxy Russell silver...........................................................................................

S&P500 SPX week 34 preview and trading ideaYesterday (Monday 23 Aug), the market quickly recovered the last week correction and is trying to test the $4500 level. The S&P 500 E-mini Futures tested the $4492 level around 08:00 AM (London Time, GMT+1).
The previous correction lasted about 5 days and it took about 5 days to recover. This correction, as well as the recovery, lasted both 2 days. After the breakout of the previous resistance level, we expect a trading range of around 66 points ($4455 – $4520).
The focus of the week is on the Federal Reserve policymakers’ virtual appearance at the bank’s annual Jackson Hole Economic Policy Symposium (Thursday – Saturday). Fed Chair Powell will speak on Friday. This event, as well as other factors such as the “New Home Sales”, “Core Durable Good Orders”, “Crude Oil Inventories”, “GDP Q2”, “Initial Jobless Claims”, etc. will add volatility to the week.
This week’s trading idea is to sell the 4535/4540 vertical call spread with expiration 27 Aug 2021 for a credit around $0.55 against a $5 collateral.

Russell 2000 back to support zone and down 6 days in a rowThe Russell 2000 ($IWM) is once again back to this 210 band of prior support. We've seen buyers step in around this this level about half a dozen times this year. We're also closing below the lower Bollinger Band.
The million dollar question: Is this time different? Place your bets!

RUSSELL ON MULTI MONTH BULLISHTapering should not stop this index to reach the moon. FED still keeps printing anyway. Meanwhile, business and economic environment will be getting better from this good momentum.

Gold 120 Pips In ProfitGood day guys! This is just an update in regards to this trade I put out over in the morning. We did get the RSI divergence to the zone that was marked and our entries were placed. We are currently up 118+ pips in profit. If you were able to get into this position, be sure to trail your SL into profit. Do not be surprised if you see price head higher to form a topping pattern. We do appreciate you for checking out this post and remember, we will see you on the other side.
Rodrick Goss (CEO)
Third Eye Traders

russell dropRussell 2000 index recently dropped below post-covid crash rally support line and 180-day moving average at the same time.

XSPA, bottom of range play on micro cap stock.*Not financial, trade, nor dating advice.
This is a snipe of an asset that has been severely impacted by Covid lockdowns and, in so saying, could be an extremely volatile play if a variant makes headway through Summer and Fall. I don't have a prediction on when this trade may play out, but I'm getting very interested what I see on the chart.
It's in a great location, at least for me, bottoms of ranges between 68.1 and 88.6 x2 off of fibs taken from the past 2 most significant outbreaks.
Price action has been trending upward after break of the trend line from a pop in the spring. Previous to that it saw a high in June 2020, and a 50% play to $4.83 is not out of reach should this asset pick up more buy volume, and absent any spooks to the market. It has multiple W market structure in price action and in the internal indicators. Buy volume is gradually getting greater but still needs to see a more significant push. Maybe on earnings news?
The moving averages are converging and starting to show upward movement. I'll believe it is bull when the 13ema crosses the 30sma. Right now the price is sandwiched between the 30sma and 200 sma, but still looks good imo.
There are two bullish MACD divergences, both confirmed.
MA's pointing up and have crossed the obv and the modified Williams%R.
You can view the fundamentals here. Nothing to write home to mom about, but, more importantly, nothing terribly alarming stands out to me.
I got a double after an entry in Fall 20 and have free stock after a trade in spring 2021. I'me slowly accumulating, and I'm in the trade without stops. Only a small percentage of my investable capital. I'll risk it going to 0. I'm looking to sell half on a double to get my original investment back and let the rest ride.
I'm a beginning trader and like to incorporate technical and fundamental analysis into my trades. I also like when others take the time to share their thoughtful analysis, critique and comment.
I received my discretionary trading education at TRi, School for Trader Development.
Thanks for stopping by.

Are we in Post Melt-Up phaseMy answer to this question is Yes..!
It is highly likely that we were experienced the Melt-up in Small caps between March 2020 and February 2021 in the small caps!
The sharpest move (+144% in 12 months) in the past 23 years!
What Is a Melt-Up?
A melt-up is a sustained and often unexpected improvement in the investment performance of an asset or asset class, driven partly by a stampede of investors who don't want to miss out on its rise, rather than by fundamental improvements in the economy.
Gains that a melt-up creates are considered to be unreliable indications of the direction the market is ultimately headed. Melt-ups often precede meltdowns.
What is the Price Rate Of Change (ROC) Indicator
The Price Rate of Change (ROC) is a momentum-based technical indicator that measures the percentage change in price between the current price and the price a certain number of periods ago. The ROC indicator is plotted against zero, with the indicator moving upwards into positive territory if price changes are to the upside, and moving into negative territory if price changes are to the downside.
The indicator can be used to spot divergences, overbought and oversold conditions, and centerline crossovers.
The Price Rate of Change (ROC) oscillator is an unbounded momentum indicator used in the technical analysis set against a zero-level midpoint.
A rising ROC above zero typically confirms an uptrend while a falling ROC below zero indicates a downtrend.
When the price is consolidating, the ROC will hover near zero. In this case, it is important traders watch the overall price trend since the ROC will provide little insight except for confirming the consolidation.
Daily Charts in the past 7 months: Pure sideway!
Weekly Chart:
Monthly Chart:
Conclusion:
If you have small caps in your portfolio, define your emergency exit plan..! It will be needed soon!
Reference Article:
www.investopedia.com
www.investopedia.com

IWM - Get in gear DG's and bid this JUNK up.As Independent Producers are failing one by one....
The Gamblers continue to BID the Russell 2000.
When this fails, it will lead.
The declines in the RTY will outpace all other Instruments
including the distant 2nd, the NQ.
Patience, HUGE Trade setting up here.


S&P 500 still near ATHs. So when top? Where bottom?Although stocks are up 100% from their March 2020 lows and up 200% from their 2000-2008 peaks, I still think there is an even bigger move coming. The way the system is structured and the direction the world is heading are all telling me that we have more upside. But will there be a break? I think there will be, but it will be a buy the dip opportunity.
In my opinion the SPX500 has a decent chance of having a 10-20% dip before the end of the year as the last two major dips it had were in Sep-Nov 2020 and the market is already up 30% above its Feb 2020 highs. So having a decent correction wouldn't indicate a bear market. After the March crash I doubt we will see a 30-50% correction in quite some time.
However once SPX starts reaching 4500-4800 I believe it will pull back down to 4000 and could even get to 3600. So the first dip to buy is 4000 and then the next one 3600. Getting to 3600 means that the vaccine/election pump has fully retraced and that would be a great place to buy.

Russel Future (RTY). Freefall?I everybody. It been a while since I posted and 2 reasons for this. First, my new position has me running around like sheep, and 2 I haven't trade to much lately. But Boy oh Boy when I have taken trade they have worked out big for me. You see my last oil trade and how much I made on selling it. Well after I exit I rode it hard on the way back up and exit at 73.50. I took two contracts on this one.
Now I am in RTY trade and I rode it hard from 2160 to near top. I then enter again where you see on this chart near the top and hoping for drop down to grey rectangle. I will exit there. if price fall through grey rectangle then I will take sell and watchout here because RTY could fall freefall down into nothing.
not much of analysis right now, more description of what I have been up to and so you guys don't forget about me.
Happy trading!
Ms Bunny
Always like it when you like me and support me. More posts to come.

RTY - Russell 2000This is fast becoming the Gift that keeps on Giving.
We closed out Buy To Open Positions an are now employing an
Inverse SELL to Open Ladder from 2273 to 2335.
We are using M2K as a Hedge IF need be - low probability imho.
Our target for the RTY remains Sub 2K, there has been aggressive
Support Mechanism for the RUT, we see it as an enormous Gift :)

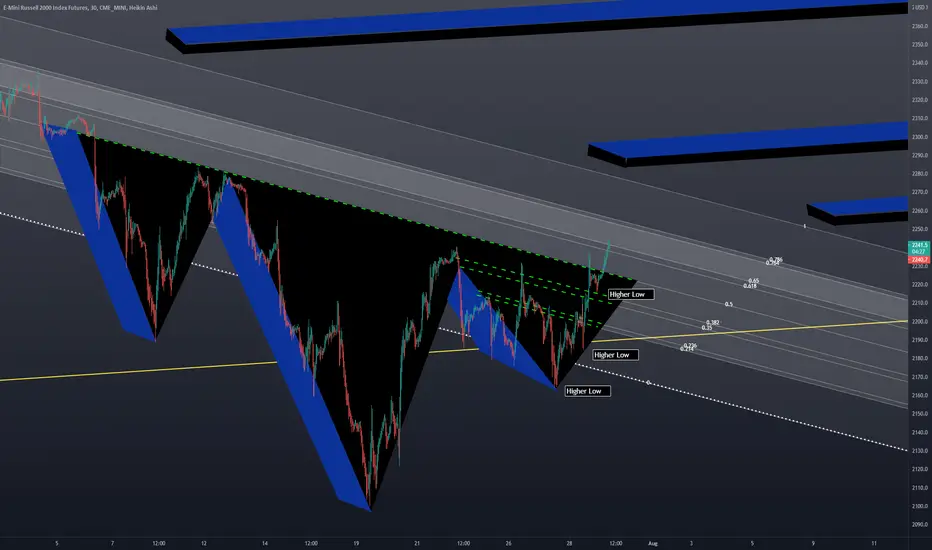
RTY - Inverse ConfirmedJobs numbers at 8:30 AM will set the tone for the rest of the week. RTY has shown strength at the bell followed by a dip that coincides with NAS mid-morning recoveries. The 10 Year Note gained to 1.259%, but seems to be reluctant to make a run to the upside. With tech earnings winding down will this RTY pattern be the rotation vehicle for a bit more mega-cap profit taking?