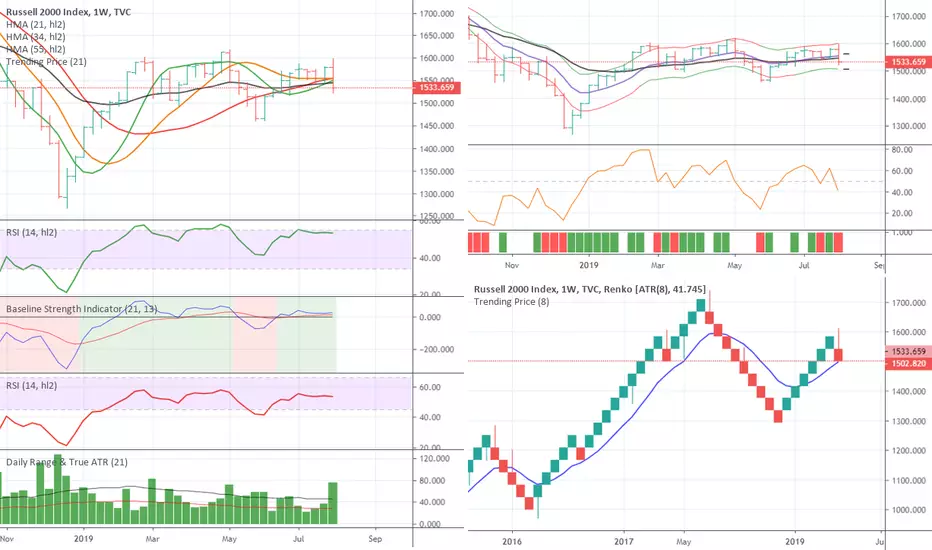
RUT Update for week ending 30 August 2019Week update for week ending 30 August 2019
In Bear territory.
Projected range for upcoming week 1518.8 - 1465.23
Price Projection:
HMA: Bear
Bull RSI: Neutral
Bear RSI: Bearish
BSI: Bearish
5 RSI: Negative
Consolidation: In Consolidation between 1450.33 - 1533.49
Price-Trend: .685x ATR
Daily for 30 August 2019
In Bear territory.
Price Projection: 1515.50
HMA: Neutral Bear
Bull RSI: Neutral
Bear RSI: Neutral
BSI: Neutral Bear
5 RSI: Positive
Consolidation: In Consolidation between 1450.84 - 1515.34
Price-Trend: .18x ATR
** Weekly updates will always be provided, if not updated daily, it generally means the underlying primary signals have not changed since last reported. **
Russell2000


RUT Update for 29 August 2019Daily for 29 August 2019
In Bear territory.
Price Projection: 1515.20
HMA: Neutral Bear
Bull RSI: Neutral
Bear RSI: Bearish
BSI: Neutral Bear
5 RSI: Positive
Consolidation: In Consolidation between 1450.32 - 1515.34
Price-Trend: .11x ATR
** Weekly updates will always be provided, if not updated daily, it generally means the underlying primary signals have not changed since last reported. **

RUT Update for 28 August 2019Daily for 28 August 2019
In Bear territory.
Price Projection: 1437
HMA: Neutral Bear
Bull RSI: Neutral
Bear RSI: Bearish
BSI: Bearish
5 RSI: Negative
Consolidation: Re-established between 1450.32 - 1515.34
Price-Trend: 1.01x ATR
** Weekly updates will always be provided, if not updated daily, it generally means the underlying primary signals have not changed since last reported. **

RUT Update for 27 August 2019Daily for 27 August 2019
In Bear territory.
Price Projection: 1437
HMA: Neutral Bear
Bull RSI: Neutral
Bear RSI: Bearish
BSI: Bearish
5 RSI: Negative
Consolidation: Broken to the low
Price-Trend: 1.74x ATR
** Weekly updates will always be provided, if not updated daily, it generally means the underlying primary signals have not changed since last reported. **

RUT Update for 26 August 2019
Daily for 26 August 2019
In Bear territory.
Price Projection:
HMA: Neutral Bear
Bull RSI: Neutral
Bear RSI: Bearish
BSI: Bearish
5 RSI: Negative
Consolidation: In Consolidation between 1456 - 1515
Price-Trend: 1.18x ATR

RUT Update for week ending 23 August 2019Week update for week ending 23 August 2019
In Bear territory.
Projected range for upcoming week 1491 - 1430
Price Projection:
HMA: Bear
Bull RSI: Neutral
Bear RSI: Neutral
BSI: Bearish
5 RSI: Negative
Consolidation: In Consolidation between 1456 - 1533
Price-Trend: 1.55x ATR
Daily for 23 August 2019
In Bear territory.
Price Projection: 1422 - 1363
HMA: Neutral Bear
Bull RSI: Neutral
Bear RSI: Neutral
BSI: Bearish
5 RSI: Negative
Consolidation: In Consolidation between 1456 - 1515
Price-Trend: 1.92x ATR
Spent the week neutral. The Weekly is still holding on to that neutrality within the consolidation range. Current strength is demonstrating a push through the floor toward a pocket of 1422 - 1363. Generally this pocket is formed due to the neutrality and can tighten if strength continues.

RUT Update Week Ending 16 August 2019Week Ending 16 August 2019
The week is neutral bearish, the daily is bearish.
Projected range for upcoming week: 1464 - 1525
Weekly Data.
In Bear Territory.
Price Projection: Daily Only
HMA: Neutral Bull
BSI: Bullish
Bull RSI: Neutral
Bear RSI: Neutral
5 RSI: Negative
Consolidation: 1456 - 1533
Price-Trend: .93x ATR
Daily Data for Wednesday 16 August 2019
In Bear Territory
Price Projection: 1374
HMA: Strong Bear
BSI: Bearish
Bull RSI: Neutral
Bear RSI: Bear
5 RSI: Negative
Consolidation: 1456 - 1509
Price- Trend: .98x ATR

RUT Update 14 August 2019Daily Data for Wednesday 14 August 2019
In Bear Territory
Price Projection: 1374
HMA: Very Strong Bear
BSI: Bearish
Bull RSI: Neutral
Bear RSI: Bear
5 RSI: Negative
Consolidation:Broken to the low side
Price- Trend: 2.45x ATR
Prices are now 2.45x ATR away from the mean. Expect some mean reversion (return toward the MAs) before any further movement.
Attached yahoo finance article regarding the futures position for the 15 August 2019. This is an example of set-up for a reversion to the mean. We may start there and fall or we may start low and move high. What ever the case may be. Prices don't like being 3x or more away from the mean.

RUSSELL 2000 1D RANGE TRADESRanges, Descending Triangles, Triangles, & Ascending Triangle are repeatable trading chart patterns.
Triangles and ranges are consolidation chart patterns that can breakout either direction.
Ascending and descending chart patterns will have a directional bias depending on the previous incoming trend.
Each chart pattern will have defining trendlines of the support/resistance levels creating the pattern.
What ever time frame you are trading this chart pattern, wait for a candle close outside of the trendline in the direction of the breakout candle. (Our time frame preference is the Daily chart).
Add volume indicator - Volume is the amount of $ that went into a particular candle or in Forex the # of trades that took place.
Add ATR indicator - Volatility is the amount of price movement that occurred. Use the ATR to measure the price movement.
When you see descending volume bars and descending atr line (which indicates volatility) this shows
a dis-interest in traders to invest in this pair creating consolidation which creates the chart pattern.
Trade Management after there is a breakout candle close.
1 - Position size (compare volume bar to volume ma line).
a - Breakout candle must be 100% of average volume for a full position size.
b - If 75% of average volume then ½ position size.
2 - Enter two trades.
3 - SL for both trades will be 1.5 x ATR.
4 - 1st trade TP will be 1 x ATR.
5 - No TP on 2nd trade – letting profit run and adjusting SL to follow price.
6 - When 1st TP hit – move 2nd trade SL to breakeven.
7 - Adjust the 2nd trade SL to follow price.
*8 - When breakout candle is more than 1 ATR from breakout candle open.
a - Enter 1st trade at candle close with ½ position size.
b - Enter 2nd trade with a pending limit order that is 1 ATR of breakout candle open.
c – Price should pullback to that pending limit order for 2nd trade.
d – If Price returns back into chart pattern close trade before SL is hit.

RUT Update week ending 9 August 2019Week Ending 9 August 2019
The week is bearish, the daily is bearish.
Weekly Data.
In Bear Territory.
Price Projection: 1434
HMA: Bear
BSI: Bearish
Bull RSI: Neutral
Bear RSI: Bear
5 RSI: Negative
Consolidation: Broken to the low side
Price-Trend: .6x ATR
Daily Data for Wednesday 9 August 2019
In Bear Territory
Price Projection: 1416
HMA: Strong Bear
BSI: Bearish
Bull RSI: Neutral
Bear RSI: Bear
5 RSI: Negative
Consolidation: 1533.49 - 1502.32
Price- Trend: 1.18x ATR
Projected range for upcoming week: 1466 - 1544

Great possible return of 10-15% on URTYGreat dip buy opportunity on URTY on a horizontal trend. Reputable ETF of the Russell 2000 has a possible return of 10-15%. Low risk etf with a great return in the next 1-4 weeks.

RUT 6 August 2019Daily Data for Tuesday 6 August 2019
In Bear Territory
Price Projection: 1470.66
HMA: Very Strong Bear
BSI: Bearish
Bull RSI: Bear
Bear RSI: Bear
5 RSI: Negative
Consolidation: 1532 - 1472
Price- ATR - Trend: 2x

RUT Update 5 August 2019Daily Data for Monday 5 August 2019
In Bear Territory
Price Projection: 1416.24
HMA: Very Strong Bear
BSI: Bearish
Bull RSI: Bear
Bear RSI: Bear
5 RSI: Negative
Consolidation: None

RUT Update week ending 2 August 2019Week Ending 2 August 2019
Weekly Data.
In Bear Territory.
Price Projection: 1486
HMA: Bear
BSI: Positive but declining
Bull RSI: Neutral
Bear RSI: Neutral
5 RSI: Negative
Consolidation: 1517 - 1586
Daily Data for Friday 2 August 2019
In Bear Territory
Price Projection: 1486
HMA: Bearish
BSI: Bearish
Bull RSI: Neutral
Bear RSI: In Bear Territory
5 RSI: Negative
Consolidation: None
Projected range for upcoming week: 1487 - 1564
Update 1 August 2019Entered Bearish territory
Price Projection: 1518.09
HMA: Bearish
BSI: Above zero line
Bull RSI: Entered Neutral
Bear RSI: Neutral
Consolidation: None

Post Rate Cut Update 31 July 2019RUT held on to its ground.
It had broken the consolidation to the high side on 30 July 2019.
31 July it re-established the consolidation zone, giving it a new high bar.
New consolidation zone is: 1543 - 1599
All three RSI (Bull, Bear, 5) are showing bullish strength.

Update 30 July 2019RUT has generated an enveloping bar.
This bar broke and closed beyond the consolidation high.
The price projection from this movement is 1603.12

RUT Update week ending 26 July 2019Weekly consolidation range: 1517 - 1586
Daily consolidation range: 1543 - 1581
Weekly strength indicates a strong bullish attitude
Daily strength indicates a strong bull attitude
Weekly Bull RSI: No new signals
Weekly Bear RSI: No new signals
Weekly BSI: No new signals
Open daily price projections: 1603, 1623 from July 24
Projected trade range for upcoming week: 1555 - 1625

Russell 2000 CFD (US2000USD) (RUT) short.All description on chart.
Please, don't forget to like and follow.
Thank you.

E-Mini Russell 2000 One Hour Long $790.00The E-Mini Russell 2000
One hour time frame has shifted from side ways
movement to a down channel. The market is at
the bottom of the channel and is showing signs
the market could push bullish towards price point
1566 about +158 Ticks away. Which is around
$790.00 of profit opportunity with one E-Mini
Contract. Stops can go below the bottom of the
channel.

IWM Has No More Upside - Longterm Target Is 112 USDCurrently we are in a ABCDE formation down. Next target is 141 USD, where it will make a corection up to 151 USD for the (e).
In my last post i noted that transportations are also expecting a correction down, which should take IWM with it. Therefore the larger target of IWM is 112 USD. Best case Scenario we are looking at a target of 99 USD.

SImple The Stochastic Pop was developed by Jake Bernstein and modified by David Steckler, who wrote a corresponding article for Stocks & Commodities Magazine in August 2000. Bernstein's original Stochastic Pop is a trading strategy that identifies price pops when the Stochastic Oscillator surges above 80. Steckler modified this strategy by adding conditional filters using the Average Directional Index (ADX) and the weekly Stochastic Oscillator. This article draws on both methodologies to present another modified version of the Stochastic Pop suited for SharpCharts.
Once the trading bias is established, Steckler used the Average Directional Index (ADX) to define a slowdown in the trend. ADX measures the strength of the trend and a move below 20 signals a weak trend. Steckler preferred ADX below 15, but would use 20 as well. A high and rising ADX signals a strengthening trend, while a low and falling ADX indicates that the trend is weakening. On the chart below, 14-period ADX on the daily chart shows a weak trend when it moves below 20. Notice how Gap (GPS) moved into a trading range as ADX dipped below 20 twice (yellow areas).
the obv volume is very important for to determinated the market trend...
