Oil Long Trade Idea With LOTS of confluences. In this trade idea I have put together my analysis for a buy trade in Oil lining up 4 or 5 different supporting confluences.
Russia

What will happen to USDRUB?This is the chart that all the world should watch for the rest of 2020s.
How the price acts after breaking this ascending triangle will shape the global political economy. Therefore all the investors should watch it very closely.
Within 6 months after the price breaks this triangle, I would expect an extremely influential story or event that completely change the power balances between China-US-Russia axis.

Russia/Ukraine Crisis effect on Raiffeisen Bank InternationalA few western companies that are listed could very much feel the consequences of the Russian invasion.
Energy firms revenues and profits may be offset by a potential oil price jump so that is not a major concern right now. The financial sector is where I see an issue. According to calculations by JPMorgan, for the financial sector, the risk is concentrated in Europe. Any conflict in Ukraine will hit Russia just as you would imagine, there would be an economic hit and, along with sanctions that the US will impose this doesn’t sound good. Raiffeisen Bank International derived 39% of its estimated net profit last year from its Russian subsidiary. Raiffeisen Bank International would therefore be a good company to short.
The two orange lines represent all-time highs and lows. The two black lines represent the last decade support and resistance levels In early 2014 when Russia invaded Crimea the stock fell by around 32%. In the event of an invasion, I see the stock falling towards the bottom black support line. Represented by the blue arrow. This would be a drop of around 22%.

Russia/Ukraine Crisis effect on GoldGold is usually seen as a safe haven. In the event of an invasion by Russia into Ukraine I would expect Gold to go up. Now, Gold went up approximately 10% during the last crisis so I expect a similar result. If Gold does rise 10% again this would lead to a breakout of a right-angled triangle and would lead to near all-time highs so I would sell near that region since it could be a level of resistance.

Russia/Ukraine Crisis effect on Natural GasThe Russia and Ukraine crisis will cause a strain on Natural Gas prices. This analysis will explain its effects.
Global natural gas consumption rebounded by around 4.6% in 2021. This strong growth demand was led by an economic recovery following the 2020s lockdowns and a succession of extreme weather events. Supply could not keep up. Along with unexpected outages, this led to a tight market and steep price increases. The year closed with record high spot prices in Europe and Asia, as natural gas supplies remained very tight. Beginning with the Russia/Ukraine crisis from the end of January till today natural gas spot prices have seen a rapid rise. By almost 35%, from around 3.631 to 4.902.
This has been solely due to a fear of an invasion into Ukraine. The reason is simple, Europe heavily relies on Russia for natural gas. Around 40%. A third of the gas comes from pipelines underneath Ukraine, Germany is trying to circumvent this issue with Nord Pipeline 2. But this is still in the making and the US have said that they would stop this pipeline if there were any invasion into Ukraine. So, an invasion into Ukraine will be a good buying opportunity for Natural Gas.
However, there's a problem.
If the markets, see a problem looming in the commodities sector they almost always price in the problem from the get-go. So, I suspect many large banks, traders are ready for an invasion and gas producers have already got a supply of gas that can be shipped, if need be, to circumvent the gas supply shock that would occur if Russia invaded Ukraine. Also, A senior Biden administration official said last Tuesday that the US has held talks with major gas producers in North Africa, the Middle East and Asia, as well as domestically about their willingness to “temporarily surge” their gas output to meet any supply shortages. This would lead to a medium-term fulfilment of gas prices and the increase may not be as pronounced as one may imagine. I still believe there will be a large short-term spike in the prices, but this would not sustain for very long and eventually, the price will level out. Only if the supply shortages are met. If not, then the prices may continue to rise. So, if an invasion comes then a spike in natural gas and oil prices will probably occur. After that, I will wait and see how the supply shortage is managed and how that will affect prices.
In 1991 the spot price of natural gas begins around 1.649, the highest price was around 16.470 near the end of 2005. But, for the largest period, it's been between 1.649 and 6.162. In the last decade, the spot price has only on three occasions reached that amount.
The purple indicator second to the bottom is the RSI, it measures overbought and oversold situations. Since natural gas is a commodity, I’m not going to focus largely on these indicators apart from the CCI (commodity channel index). Which is designed for assets such as natural gas. The RSI has seen overbought levels which have been represented by the purple boxes on the chart. Most of these events have been geopolitical and not nearly related to technical stuff. So, the large increase in the RSI which would inevitably come in the event of an invasion should be mostly ignored. Only recognize that the increase is related to the event and when the RSI starts to cool off it could be a sign to sell.
The blue indicator is the CCI. This indicator is used to signal overbought scenarios as well. Since it works by comparing the current price by the average price over some time. The times when the CCI has been overbought are presented by the blue circles on the graph. As with the RSI, I would use this indicator only to see a sell, not a buy. Since the indicator lags in time, the event and spike in price will come before it is shown on the indicator and could cause a delay in action which could result in a bad timing in position.
The red lines represent all-time lows and highs. The orange lines are recent highs and lows based on the last decade. But the important lines are the black ones. These represent an area of resistance for the price going back to 2002. The price has stalled and found support and resistance in this region. So, if one wants to have a long-term position in natural gas, I will use this to measure the level of support of the resistance. These lines would not cause any issues in an event of an invasion since the price would probably spike through and ignore the resistance. But when the price cools down, you can expect it to find this region as a support level and that could signal a sell.
The blue arrow is my prediction in the event of an invasion. The highest peak of the arrow is where I see some form of a bad scenario working out. But if the US and Europe make sure the gas supply is sufficient, I do expect a rise in the price but not to the arrowhead. Only between the top black line to the orange line. Which is the green rectangle. The growth of the green rectangle represents a rise of 40% which, is more than enough to make a decent profit.

USDRUB Russian ruble is no longer aligned to Crude Oil priceI don`t want to be prophetic, but does George Soros ( 91 years), The Greatest Speculator of all time, want to be remembered as The Man Broke the Bank of Russia too?
Developments in Kazakhstan and NATO supporting Ukraine to defend against an invasion from Russia are bad signs for the ruble.
US, UK and other officials started the evacuation of their embassy employees Kyiv.
The US, UK and other NATO members warned Russia about the heavy sanctions bombardment in case the tension with Ukraine escalates.
Bank of Russia wants Full Ban on Crypto, calling Bitcoin a Ponzi scheme. Russia's central bank consider trading, mining and crypto usage illegal. the Russian Ministry of Finance also announced a halt of foreign currency purchases, to withhold the further downslide of the ruble.
I see an imminent breakout of usd to all time high if the tensions escalates.
Looking forward to read your opinion about it.

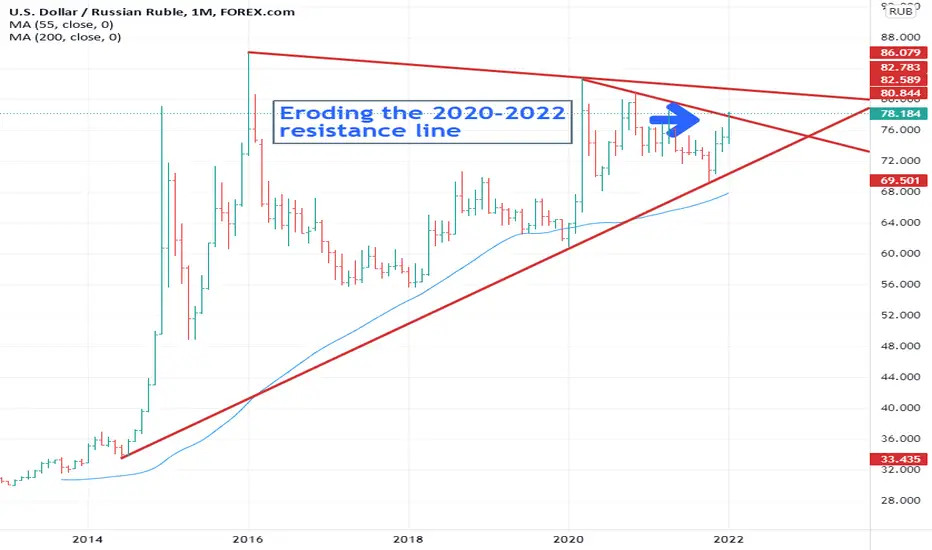
The Russia Risk It is hardly surprising to see USD/RUB creeping through its 2020-2022 resistance line given the increasing tensions between Russia and the Ukraine. That gives us the fundamental reason, but how can the chart to help with our trading strategy when something is hard quantify from a fundamental perspective?
Will Russia invade the Ukraine? Who knows, I was chatting about this with my friend yesterday who is convinced they will not, due to the risk of sanctions, but I have to say I am not so convinced and there is a real risk here and I am not convinced that the markets are fully pricing in that risk premium….and here’s where some basic chart knowledge really comes into its own. Charts help to take out some of the emotion out of decision making and it has some basic rules. For example, the definition of an up move is for higher reaction highs and higher reaction lows. For USD/RUB the last reaction low and the 55-day moving average coincide well in the 74.36/25 region, so placing a stop below there is logical. Too far away? Look at an hourly chart and follow the same principle.
Need a target zone, or somewhere you need to aim for? The 2016-2022 resistance line at 81.40 is a good place to start. What do you do when it starts to reach your target zone? There is a decision to be made... do you lock in profits and exit or hold on? You need to take a closer look at the chart at this point– is the RSI overbought? Is the market running out of steam, struggling to get through this level? At the very least you should be looking to tighten your stops.
By the way resistance lines that only connect 2 points are not as good as down trends (these connect 3 points) and with USD/RUB bouncing off its 2014-2022 uptrend at the end of last year all the risks are on the topside. Above 81.40, we have the 82.86 March 2020 high and the 85.98 January 2016 high.
Disclaimer:
The information posted on Trading View is for informative purposes and is not intended to constitute advice in any form, including but not limited to investment, accounting, tax, legal or regulatory advice. The information therefore has no regard to the specific investment objectives, financial situation or particular needs of any specific recipient. Opinions expressed are our current opinions as of the date appearing on Trading View only. All illustrations, forecasts or hypothetical data are for illustrative purposes only. The Society of Technical Analysts Ltd does not make representation that the information provided is appropriate for use in all jurisdictions or by all Investors or other potential Investors. Parties are therefore responsible for compliance with applicable local laws and regulations. The Society of Technical Analysts will not be held liable for any loss or damage resulting directly or indirectly from the use of any information on this site.
GAZ The gas that's in danger of farting!
Watch out for the detonation. it's likely to be very strong.

$XAUUSD the big move is near*This is not financial advice, so trade at your own risks*
*My team digs deep and finds stocks that are expected to perform well based off multiple confluences*
*Experienced traders understand the uphill battle in timing the market, so instead my team focuses mainly on risk management
Nerves are high whenever we look at this bad boy. If this move is as big as we think it's going to be people are about to make a lot of money. People are also about to lose a lot of money. Some people on my team are speculating that you should go long here, others are neutral.
Nobody on our team is bearish on this call.
A gold mining company called Harmony Gold $HMY is where some of us have parked a little cash in case this is bullish.
If you want to see more, please like and follow us @SimplyShowMeTheMoney


Groups convenes to set the crypto regulations for use in RussiaA crypto working group has had its first sitting in the Russian parliament.
The working group will discuss the proposals that seek to regulate cryptos and blockchain technology in Russia.
Government officials and technology experts have convened at the parliament of Russia, the State Duma, to discuss crypto regulation. The working group will discuss the current proposals on regulating circulating cryptos and developing newer ones.
Alexey Gordeev gave this report earlier today to the media. Gordeev is the chair of the working group that is currently discussing the regulation of cryptos in the country.

I've got an idea... free and open, trustless marketI'm just writing here more text, because platform wants me to write a detailed description to something, that needs no words, because is so obvious. Much love.

$BKF Long SetupI am looking at the $BKF (Brazil, Russia, India & China) ETF as a great setup for a buy.
From a charting perspective, it looks like the optimal risk / reward entry. In the macroeconomic context - I would also expect rising commodity prices to pull emerging markets higher.
More on this soon!
Take care and God bless.

Are Wheat & Biofuels Supply Plays?Took positions in BG last year, & ended up trading out too soon. Here is a good dip & options are cheap, not trading advice just a MACRO play. As long as food prices are going up & Russian Export Taxes are increasing then Wheat Grain & Biofuels might still be valid fundamentally. Bunge is a global player so please check out their Fundamentals, SEC Filings & Prospectus before investing real money, also it costs nothing to check price action for a few weeks or months before making a decision. That's how lots of analysts make their very best decisions. In fact the way I came across BG was from bad information about an alleged Silver Squeeze. Don't follow hype, do your own research & make the best decisions for you & your investment goals.

VTB the russian bank interesting perspectives in the near futureVTB is one of the most important banks in the Russian market and overall one of the pillar of the dynamics of the russian economy
first of quick view of the news :
** hit record retail loans
** earnings are on the rise but monitoring the interest rate is a must for next year forecast
** successful deal of selling the magnit from it's portfolio
second a quick view of the charts
the volumes are steady and the MA 9/MA 50 /MA 200 are forecasting a potential rise of the price of the stock

SBER analysisprobability 1: 33,3%
probability 2: 33,3%
probability 3: 33,3%
wait for the break.
next analysis (Wednesday)

Idea about MagnitMagnit is a chain of retail stores, the third largest private company in Russia by revenue (after Lukoil and X5 Group). It consists of more than 15 thousand grocery stores, 500 supermarkets, 5 thousand perfume and cosmetics stores, 1 thousand pharmacies, manages a greenhouse complex and its own fleet of 5.7 thousand cars. Founded in 1995. Revenue ₽1553.8 billion (2020). Capitalization ₽600.5 billion
The deal is on the rebound from the support level.
The tool is not fast, it forms an impulse through a long sideways movement.
Support levels ₽5525/₽5650/₽5750
1) A deal on the trend.
2) 200 EMA - day support.
3) The instrument needs a correction to collect liquidity.
Long: ₽5675
Until then: $5530
Target : ₽5950 (speculative)
Stop below ₽5400
NOT IRR.

ISKJ | Fundamental Growth +30%0. Top Russian Medical Genetic company
1. Develop alternative to Sputnik COVID-19 vacine named Betuvax-CoV-2
2. Russian Health Ministry approves clinical trails of Betuvax at September 27 2021. Clinical trails involve 116 volonteer without chronic diseases
3. Forecast release date midwinter 2021.
4. In case of anual vaccination of 1% Russian population target price: 120 RUB
5. In case of anu vaccination rate of 4%, target: 320 RUB
6. Govermental support rate up to +10-20% price impact
7. Lot's of other medical projects that support ISKJ fundamental price at 85 RUB without Betuvax project impact.
Target price: 125 RUB

Polymetal(POLY) "Continuation"Disclaimer/
On average, 90% of all stocks move down with the market, and 75% - up.
The wave principle applies to some extent to individual stocks, but counting waves for them is often confusing and has little practical significance. But since the company has a large capitalization, we assume that the state of the shares depends on the psychology of the masses
According to our old plans, we have reached a turning point. Now the 3rd wave is coming.
Gold, contrary to the correction that we have observed recently and will, most likely, observe for some time, is at the top (Price range:1950-1550USD, Delta:400, Average:1750), which is a good thing for gold mining companies. (Relative stability)
"The Group's revenue and most of its loans are denominated in US dollars, while the bulk of the Group's expenses are denominated in Russian rubles and Kazakhstani tenge. Thus, changes in exchange rates may affect the financial results and performance of the Group. The strengthening of functional currencies relative to the US dollar may adversely affect enterprises in Russia and Kazakhstan and lead to higher operating costs denominated in local currency and lower margins. ". I have been waiting for the strengthening of EUR, USD for a long time. Now there is also a turning point.
Other gold mining "Russian companies" are in a similar position.
SENSITIVITY TO RUB/USD, GOLD PRICE(1H 2021 FINANCIAL RESULTS)(At the 1H 2021 average realized price)
Effect on FCF :
A 1 RUB/USD movement in domestic currency $17-21m
A $100/oz movement in the gold price ~$150m

OZON ContinuationOZON HLDGS PLC
Disclaimer/
On average, 90% of all stocks move down with the market, and 75% - up.
The wave principle applies to some extent to individual stocks, but counting waves for them is often confusing and has little practical significance. But since the company has a large capitalization, we assume that the state of the shares depends on the psychology of the masses. With time in the distant future, not everything is clear. Due to the fact that the shares were placed recently, we are afraid of falling below the placement price (This trend can be seen in some companies)./

BTC/USDT WHAT WE TRADE NOW!I'm so sorry man, in this video i speak in russian language, in next time only english!
I show you how u can trade bitcoin now, its easy bro
PLEASE SUBCRIBE TO ME!!!

Idex Russia RTS / MICEX in USD Target priceTo 2022 target price by chart pattern, usind next futures for got this movement, look also to USD/RUB for below 70$ target price

HTF LONG - 0.6969 ETHBTC coming at yaCombination of fractal behavior and 3 years of consolidation is about to send Russia to the moon. Let's aim for that top trend line resistance. I know what the drawing says, but 0.6969 or 0.69420 ETHBTC is about where we should end the run.
Next major correction... late July after a DeFi summer. Perhaps a sell the news event when EIP1559 comes out? Maybe the market sells on Ethlon Musk buying into $ETH after PoS, expecting him to talk shit about it a week later on Twitter. Can we rule anything out at this point?
Following this as my guide until there's a major deviation.
