Daily Market Update for 4/12Summary: We have our inflation data now as Consumer Price Indexes for March were released today. Large-cap stocks declined while small caps advanced.
Notes
Ideas always welcome in the comments. Errors will be amended as comments on TradingView or corrected inline in my blog.
-=x=-=x=-=x=-=x=-=x=-=x=-=x=-
Tuesday, April 12, 2022
Facts: -0.30%, Volume higher, Closing Range: 15%, Body: 58% Red
Good: Not much, maybe higher high
Bad: Closing range, lower low, higher volume on decline
Highs/Lows: Higher high, Lower low
Candle: Outside day, long upper wick over red body
Advance/Decline: 0.56, almost two declining stocks for every advancing stock
Indexes: SPX (-0.34%), DJI (-0.26%), RUT (+0.33%), VIX (-0.45%)
Sector List: Energy (XLE +1.66%) and Utilities (XLU +0.38%) at the top. Health (XLV -0.97%) and Financials (XLF -1.09%) at the bottom.
-=x=-=x=-=x=-=x=-=x=-=x=-=x=-
Market Overview
We have our inflation data now as Consumer Price Indexes for March were released today. Large-cap stocks declined while small caps advanced.
The Nasdaq declined by -0.30%. Volume was higher than the previous day. The closing range of 15% comes under a 58% red body that is topped by a long upper wick. The upper wick formed in an early rally that failed and turned into distribution the rest of the day. A short lower wick formed as the index recovered some losses late in the session. There were almost two declining stocks for every advancing stock.
The Russell 2000 (RUT) rallied +2.38% in the morning but gave back the gains to end the day with a +0.33% advance. The S&P 500 (SPX) declined by -0.34%. The Dow Jones Industrial Average (DJI) lost -0.26%. The VIX Volatility Index declined by -0.45%.
Five of the eleven S&P 500 sectors gained today, dominated by cyclical sectors. Energy (XLE +1.66%) and Utilities (XLU +0.38%) were the best two sectors. Health (XLV -0.97%) and Financials (XLF -1.09%) had the biggest declines.
As expected, soaring oil prices put the Consumer Price Index data at its highest year-over-year growth since 1981. However, Core CPI, which excludes oil and food items, rose less than expected. Could this be the start of a turning point in inflation?
The US Dollar index (DXY) continued its rise, climbing by +0.34% today. The 30y Treasury Yield advanced just slightly, but the 10y and 2y yields declined. High Yield (HYG) and Investment Grade (LQD) Corporate Bond prices rose. Silver and Gold continued to rise. Brent Oil briefly topped $105 again but ended just below at $104.70.
The put/call ratio (PCCE) declined to 0.710. The CNN Fear & Greed Index remains in the Fear range.
Checking in on the big six mega-caps, only Tesla (TSLA) and Apple (AAPL) gained today, advancing +1.13% and +1.15%. Nvidia (NVDA) had the biggest decline, losing -1.88%.
Exxon Mobile (XOM), Chevron (CVX), and Shell (SHEL) topped the mega-cap list with the first two gaining over 2% each. Danaher Corporation just barely held onto its mega-cap status ($200b market cap) after declining by -3.57% today and ending up at the bottom of the list.
There were some decent gains in the Daily Update Growth List, but most of the list declined. Cloudflare (NET) and CrowdStrike (CRWD) topped the list with +3.90% and +3.19% gains. The biggest loser on the list was Twitter (TWTR) which fell by -5.38%, giving back some of its recent advances.
-=x=-=x=-=x=-=x=-=x=-=x=-=x=-
Looking ahead
Tomorrow will bring the Producer Price Index data for March which is another take on inflation. Produce Prices are forward-looking as rising prices are passed along to consumers in the future.
Tomorrow kicks off earnings season for big banks as JPMorgan (JPM) and BlackRock (BLK) report. In addition, Fastenal (FAST), Delta Air Lines (DAL), and Bed Bath & Beyond (BBBY) will report.
-=x=-=x=-=x=-=x=-=x=-=x=-=x=-
Trends, Support, and Resistance
The outside day for the Nasdaq did not test any moving averages or support/resistance areas.
The trend line from the 3/29 high and the five-day trend line point to a -0.46% decline.
If the one-day trend continues, that would mean a -2.87% decline for Wednesday.
-=x=-=x=-=x=-=x=-=x=-=x=-=x=-
Wrap-up
The inflation data is out there and is one less thing for investors to fret over. The producer price index data will be an interesting number to watch tomorrow. The February index was expected to be 0.6% but came in at 0.2%. March is forecast for 0.5%. Another surprise that puts PPI nearer to 0.25% would be good news.
Stay healthy and trade safe!
RUSSELL 2000

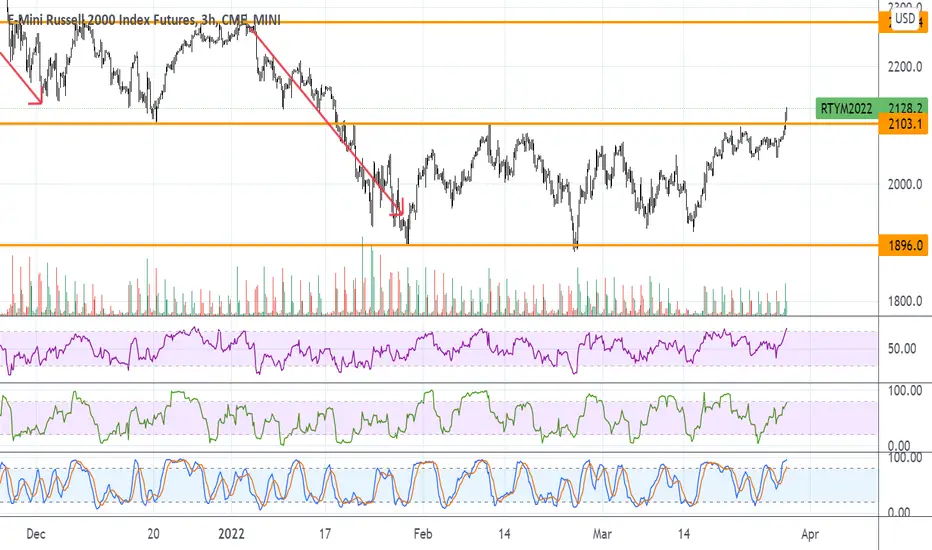
Russel2000 On The EdgeIn this update we review the recent price action in the Russell200 futures contract and identify the next high probability trade locations and price objectives to target.

Daily Market Update for 4/11Summary: Investors sold both equities and bonds ahead of CPI data coming this week that's expected to show record-high inflation and more motivation for the Fed to act aggressively.
Notes
Ideas always welcome in the comments. Errors will be amended as comments on TradingView or corrected inline in my blog.
-=x=-=x=-=x=-=x=-=x=-=x=-=x=-
Monday, April 11, 2022
Facts: -2.18%, Volume higher, Closing Range: 4% (w/gap), Body: 74% Red
Good: Nothing
Bad: Gap-down, closing range, advance/decline ratio
Highs/Lows: Lower high, Lower low
Candle: Gap-down at open, small upper wick, no lower wick
Advance/Decline: 0.35, almost three declining for every advancing stock
Indexes: SPX (-1.69%), DJI (-1.19%), RUT (-0.71%), VIX (+15.17%)
Sector List: Industrials (XLI -0.32%) and Consumer Staples (XLP -0.41%) at the top. Technology (XLK -2.52%) and Energy (XLE -3.01%) at the bottom.
-=x=-=x=-=x=-=x=-=x=-=x=-=x=-
Market Overview
Investors sold both equities and bonds ahead of CPI data coming this week that's expected to show record-high inflation and more motivation for the Fed to act aggressively.
The Nasdaq declined -2.18% by the end of the day, opening with a gap-down. The closing range of 4% and higher volume than the previous day shows a clear distribution day. The candle is 74% red with a small upper wick and a barely visible lower wick. There were almost three declining stocks for every advancing stock.
Small-caps held up the best with the Russell 2000 (RUT) only declining by -0.71%. The S&P 500 (SPX) dropped by -1.69% while the Dow Jones Industrial Average (DJI) fell by -1.19%. The VIX Volatility Index rose by +15.17%.
All eleven S&P 500 sectors dipped today. Industrials (XLI -0.32%) and Consumer Staples (XLP -0.41%) were at the top of the list while Technology (XLK -2.52%) and Energy (XLE -3.01%) had the biggest losses.
The US dollar index (DXY) advanced by +0.14%. US 30y and 10y Treasury Yields advanced, hitting their highest point since early 2019. The 2y Treasury Yield declined. High Yield (HYG) and Investment Grade (LQD) Corporate Bond prices declined sharply. Silver and Gold gained. Brent Oil dropped below $100 / barrel.
The put/call ratio (PCCE) climbed to 0.863. The CNN Fear & Greed index fell back into the Fear zone.
All big six mega-caps declined with Nvidia (NVDA) leading the way, dropping by -5.20%. Tesla (TSLA) was the last of the six to stay above key moving averages but dropped below its 21d EMA today. Facebook's market cap rose above Nvidia last week, so it may be time to update the big six list again.
Only four stocks in the mega-cap list gained today. Novartis (NVS) had the top gain, advancing +1.10%. Microsoft, Tesla, and Nvidia were at the bottom of the list.
Despite the market losses, there were quite a few gainers in the Daily Update Growth List. Draft Kings (DKNG) had the biggest gain, advancing +2.99% today. Enphase Energy (ENPH) was at the bottom of the list with a -3.72% decline.
-=x=-=x=-=x=-=x=-=x=-=x=-=x=-
Looking ahead
Consumer Price Index data arrives in the morning and is expected to be 8.4% year-over-year. There is a 10-year note auction in the afternoon.
CarMax (KMX) could be an interesting earnings report to watch for as remarks about the price of used cars could be useful to how inflation is tracking.
-=x=-=x=-=x=-=x=-=x=-=x=-=x=-
Trends, Support, and Resistance
The Nasdaq gapped down at open today and moved lower. The next support area to test would be the round number 13,000.
The five-day and one-day trend lines point to a -0.04% decline for tomorrow.
The trend line from the 3/29 high ends with a -0.99% decline.
-=x=-=x=-=x=-=x=-=x=-=x=-=x=-
Wrap-up
Tomorrow depends on the CPI data. If it's near or better than expected, we could see a bounce in the indexes. That bounce may be short-lived however as analysts don't expect the Fed to back off on aggressive action given it's a mid-term election year.
Stay healthy and trade safe!

Daily Market Update for 4/8Summary: Friday was a continuation of this choppy week that saw more Fed officials take a hawkish stance toward policy to get inflation under control.
Notes
Ideas always welcome in the comments. Errors will be amended as comments on TradingView or corrected inline in my blog.
-=x=-=x=-=x=-=x=-=x=-=x=-=x=-
Friday, April 8, 2022
Facts: -1.34%, Volume lower, Closing Range: 10%, Body: 69% Red
Good: Higher low, lower volume on decline
Bad: Lower high, closing range of 10%
Highs/Lows: Lower high, Higher low
Candle: Inside day, red body in between tiny upper and lower wicks
Advance/Decline: 0.42, more than two declining for every advancing stock
Indexes: SPX (-0.27%), DJI (+0.40%), RUT (-0.76%), VIX (-1.81%)
Sector List: Energy (XLE +2.75%) and Financials (XLF +1.01%) at the top. Consumer Discretionary (XLY -0.92%) and Technology (XLK -1.40%) at the bottom.
-=x=-=x=-=x=-=x=-=x=-=x=-=x=-
Market Overview
Friday was a continuation of this choppy week that saw more Fed officials take a hawkish stance toward policy to get inflation under control.
The Nasdaq declined by -1.34%. Volume was lower than the previous day. The candle has a 69% red body in between small upper and lower wicks. The closing range of 10% put the close below the 50d moving average. There were more than two declining stocks for every advancing stock.
The Dow Jones Industrial Average (DJI) advanced +0.40%, helped by big energy and big finance companies. The S&P 500 (SPX) receded by -0.27%. The Russell 2000 (RUT) declined by -0.76%. The VIX Volatility Index fell by -1.81% after hitting higher levels earlier in the week.
Seven of the eleven S&P 500 sectors ended the day in the green. Energy (XLE +2.75%) and Financials (XLF +1.01%) were the best two sectors. Consumer Discretionary (XLY -0.92%) and Technology (XLK -1.40%) led the losing sectors.
There were no surprises in the World Agricultural Supply and Estimates (WASDE) report. Investors already know about the crisis in the food chain caused by the war in Ukraine.
The US Dollar Index (DXY) gained another +0.09%, ending the week at its highest point since May 2020. Treasury Yields continued higher as bond investors sell-off notes ahead of the Fed reducing the balance sheet. High Yield (HYG) and Investment Grade (LQD) Corporate Bond prices continued to track lower. Brent Oil moved slightly higher but is staying near the $100 level.
The put/call ratio (PCCE) declined to 0.786. The CNN Fear & Greed index moved closer to Neutral.
All of the big six declined, led by Nvidia (NVDA) which fell by -4.50%. Tesla (TSLA) is the only of the six to remain above moving averages, despite declining by -3% today.
Home Depot (HD) was the top mega-cap today, advancing +2.76%. The stock had been underperforming the market, including the Consumer Staples sector, so possibly investors are looking for a bargain. Nvidia was at the bottom of the mega-cap list, followed by Tesla.
Only four stocks in the Daily Update Growth List gained. RH was the biggest winner, advancing +2.43% and followed by Fastly (FSLY) which rose +2.20%. Lemonade (LMND) landed at the bottom of the list with a -8.34% drop today.
-=x=-=x=-=x=-=x=-=x=-=x=-=x=-
Looking ahead
There is not much economic news to kick off on Monday, but Tuesday will bring the Consumer Price Index data for March.
The week will also start off light with earnings reports and then pick up with Finance firms reporting later in the week.
-=x=-=x=-=x=-=x=-=x=-=x=-=x=-
Trends, Support, and Resistance
The Nasdaq dropped below the 50d moving average in the morning, recovered mid-day but then closed below that line to end the week.
The trend line from the 3/29 high and the one-day trend line point to a -0.21%.
The five-day trend line ends with a -1.95% decline.
-=x=-=x=-=x=-=x=-=x=-=x=-=x=-
Wrap-up
There wasn't much news to change investor sentiment in either direction today, so more of the same continued into Friday. Equities chopped around while bonds sold off. The volatility will continue until more agreement is established on how quickly the Fed will reduce the balance sheet and how much they will increase interest rates.
Stay healthy and trade safe!

Daily Market Update for 4/7Summary: Stocks weren't sure what to do on Thursday, but Bonds sold off as investors continue to digest what Fed actions may be in store for later this year.
Notes
Ideas always welcome in the comments. Errors will be amended as comments on TradingView or corrected inline in my blog.
-=x=-=x=-=x=-=x=-=x=-=x=-=x=-
Thursday, April 7, 2022
Facts: +0.06%, Volume lower, Closing Range: 72%, Body: 12% Green
Good: High closing range
Bad: Lower high, lower low, dip below 50d MA
Highs/Lows: Lower high, Lower low
Candle: Thin green body above a long lower wick
Advance/Decline: 0.48, more than two declining stocks for every advancing stock
Indexes: SPX (+0.43%), DJI (+0.25%), RUT (-0.35%), VIX (-2.49%)
Sector List: Health (XLV +1.92%) and Energy (XLE +1.31%) at the top. Real Estate (XLRE -0.82%) and Communications (XLC -0.87%) at the bottom.
-=x=-=x=-=x=-=x=-=x=-=x=-=x=-
Market Overview
Stocks weren't sure what to do on Thursday, but Bonds sold off as investors continue to digest what Fed actions may be in store for later this year.
The Nasdaq recovered from an intraday dip to close +0.06% higher. The candle has a 12% body in the upper half of the candle. It's above a long lower wick that formed in the first half of the day as the index plunged below the 50d MA. Prices recovered in the afternoon before the Nasdaq hit resistance at the 21d EMA and formed a short upper wick before close. The closing range was good at 72%, but there were more than two declining stocks for every advancing stock.
The S&P 500 (SPX) was the best index today, advancing by +0.43%. The Dow Jones Industrial Average (DJI) climbed by +0.25%. Small-caps did not do well with the Russell 2000 (RUT) declining by -0.35%. The VIX Volatility Index fell by -2.49%.
Seven of the eleven S&P 500 sectors gained. Health (XLV +1.92%) and Energy (XLE +1.31%) were at the top of the list. Real Estate (XLRE -0.82%) and Communications (XLC -0.87%) had the biggest losses.
The weekly Initial Jobless Claims were less than forecast. 166,000 claims were counted against the expectation of 200,000.
The US Dollar index (DXY) continued higher, climbing by +0.13% today. US 30y, 10y, and 2y Treasury Yields all rose. The gap between the 10y and 2y continues to widen. High Yield (HYG) and Investment Grade (LQD) Corporate Bond prices fell for another day. Brent Oil dipped below $100 but then closed the day just above that mark.
The put/call ratio (PCCE) declined to 0.799. The CNN Fear & Greed index moved back toward Neutral. The NAAIM Money Manager Exposure Index rose to 83.41 from 79.72 the previous week.
Three of the big six mega-caps ended the day with gains. Tesla (TSLA) gained +1.10%, followed by Microsoft (MSFT) and Apple (AAPL) which gained +0.62% and +0.18%.
Pfizer (PFE) was the top mega-cap, followed by other Health sector stocks. Pfizer gained +4.33% today. Pfizer announces the acquisition of ReViral, a respiratory virus drugmaker. At the bottom of the mega-cap list was Alibaba (BABA).
Chewy (CHWY) was the top stock in the Daily Update Growth List. Chinese stocks dominated the bottom of the list with Ehang Holdings (EH) falling by -7.17% to land at the bottom of the list.
-=x=-=x=-=x=-=x=-=x=-=x=-=x=-
Looking ahead
The World Agricultural Supply and Demand Estimates report, published by the USDA, will be published at noon tomorrow.
-=x=-=x=-=x=-=x=-=x=-=x=-=x=-
Trends, Support, and Resistance
The Nasdaq dipped below the 50d MA mid-day before recovering and finding resistance at the 21d EMA before close.
If the one-day trend line continues, that would mean a +0.38% gain on Friday.
The trend line from the 3/29 high and the five-day trend line point to -0.98% and -1.47% declines.
-=x=-=x=-=x=-=x=-=x=-=x=-=x=-
Wrap-up
The market is still sorting out what interest rate hikes and the balance-sheet runoff means for the rest of 2022. If the bond market is an indication, then we will likely see more volatility in equities, especially with growth stocks. Higher yields and the strengthening US dollar will especially put pressure on large multinationals that depend on repatriated revenues.
Stay healthy and trade safe!

Daily Market Update for 4/6Summary: A look at the Fed meeting minutes didn't do much to alleviate investor worries over inflation and near-term Fed actions. That created a wildly volatile day for equities while the US Dollar strengthened and Treasury yields rose.
Notes
Ideas always welcome in the comments. Errors will be amended as comments on TradingView or corrected inline in my blog.
-=x=-=x=-=x=-=x=-=x=-=x=-=x=-
Wednesday, April 6, 2022
Facts: -2.22%, Volume higher, Closing Range: 26% (w/gap), Body: 47% Red
Good: Recovery from the intraday lows
Bad: Gap down at open, low closing range, high volume on decline
Highs/Lows: Lower high, Lower low
Candle: Gap down, longer lower wick under a 50% red body.
Advance/Decline: 0.29, more than three declining stocks for every advancing stock
Indexes: SPX (-0.97%), DJI (-0.42%), RUT (-1.42%), VIX (+5.09%)
Sector List: Utilities (XLU +1.99%) and Health (XLV +1.52%) at the top. Technology (XLK -2.37%) and Consumer Discretionary (XLY -2.55%) at the bottom.
-=x=-=x=-=x=-=x=-=x=-=x=-=x=-
Market Overview
A look at the Fed meeting minutes didn't do much to alleviate investor worries over inflation and near-term Fed actions. That created a wildly volatile day for equities while the US Dollar strengthened and Treasury yields rose.
The Nasdaq declined by -2.22%. Volume was higher than the previous day. The index opened with a gap down to start below the 21d EMA, continued lower until getting support at the 50d MA and recovering some of the loss. The candle has a 26% closing range, considering the full range from yesterday's low to include the gap. There were more than three declining stocks for every advancing stock.
The Russell 2000 (RUT) lost -1.42%. The S&P 500 (SPX) fell by -0.97%. The Dow Jones Industrial Average (DJI) declined by -0.42%. The VIX Volatility Index rose another +5.09%.
Five of the eleven S&P 500 sectors gained for the day with Utilities (XLU +1.99%) and Health (XLV +1.52%) performing the best. Growth sectors led markets lower. Technology (XLK -2.37%) and Consumer Discretionary (XLY -2.55%) were at the bottom of the sector list.
Crude Oil Inventories were higher than expected, helping Crude Oil futures to drop.
The US Dollar index (DXY) rose to +0.14%. US 30y and 10y Treasury Yields rose while the 2y yield declined. That continued to widen the gap after the yields inverted briefly last week. High Yield (HYG) and Investment Grade (LQD) Corporate Bond prices continue to drop. Brent Oil dropped to $101.
The put/call ratio (PCCE) rose to 0.897. The CNN Fear & Greed index moved back into the Fear range.
The big six mega-cap charts were crushed by the sell-off. Microsoft (MSFT), Alphabet (GOOG), Amazon (AMZN), and Nvidia (NVDA) all broke below key moving averages. Only Apple (AAPL) and Tesla (TSLA) remain above the three moving averages I track. Nvidia had the biggest drop, declining by -5.88% while Apple faired the best, declining only -1.85%.
Eli Lilly (LLY) along with the rest of the Health sector did well. LLY topped the mega-cap list with a +4.56% gain. Nvidia and Tesla were at the bottom of the mega-cap list.
All stocks in the Daily Update Growth List declined. Twitter (TWTR) had the smallest decline, falling only -0.41%. The biggest declines were from Beyond Meat (BYND) and Cloudflare (NET), which both fell over 8%.
-=x=-=x=-=x=-=x=-=x=-=x=-=x=-
Looking ahead
Tomorrow will kick off with the weekly Initial Jobless Claims report. Treasury Secretary Janet Yellen as well as several Fed members are scheduled to speak throughout the day.
-=x=-=x=-=x=-=x=-=x=-=x=-=x=-
Trends, Support, and Resistance
The Nasdaq opened the day below the 21d EMA and continued lower before getting support at the 50d MA.
The trend line from the 3/29 high, the five-day trend line, and the one-day trend line all point to a +0.30% advance for tomorrow.
-=x=-=x=-=x=-=x=-=x=-=x=-=x=-
Wrap-up
It seems that the Fed will shed $95 billion a month from the balance sheet and raise interest rates 225 more basis points before the end of the year. That will be three 50 point increases and three 25 point increases. The good news, is now we know. The bad news is that the impact on your favorite equities may not be over yet.
Stay healthy and trade safe!

Daily Market Update for 4/5Summary: Brainard turns hawkish and sucks the energy out of the market. Equities dropped as yields soared.
Notes
Ideas always welcome in the comments. Errors will be amended as comments on TradingView or corrected inline in my blog.
-=x=-=x=-=x=-=x=-=x=-=x=-=x=-
Tuesday, April 5, 2022
Facts: -2.26%, Volume higher, Closing Range: 11%, Body: 86% Red
Good: Nothing
Bad: Lower high, lower low, closing range
Highs/Lows: Lower high, Lower low
Candle: Mostly red body, tiny upper and lower wicks
Advance/Decline: 0.24, 4 declining for every advancing stock
Indexes: SPX (-1.26%), DJI (-0.80%), RUT (-2.36%), VIX (+13.25%)
Sector List: Utilities (XLU +0.63%) and Health (XLV +0.21%) at the top. Technology (XLK -2.11%) and Consumer Discretionary (XLY -2.34%) at the bottom.
-=x=-=x=-=x=-=x=-=x=-=x=-=x=-
Market Overview
Brainard turns hawkish and sucks the energy out of the market. Equities dropped as yields soared.
The Nasdaq declined by -2.26%. Volume was higher than the previous day. The lower high and lower low as well as the low closing range all mark a bearish day of distribution. The red body covers 86% of the candle and leaves behind an 11% closing range. There were more than four declining stocks for every advancing stock.
The Russell 2000 (RUT) declined the most, losing -2.36$. The S&P 500 (SPX) dropped by -1.26%. The Dow Jones Industrial Average lost -0.80%. The VIX Volatility Index rose +13.25%.
Only four of the eleven S&P 500 (SPX) sectors, all defensive sectors. Utilities (XLU +0.63%) and Health (XLV +0.21%) were the top gainers. Technology (XLK -2.11%) and Consumer Discretionary (XLY -2.34%) had the most significant declines.
Services and non-Manufacturing PMI indexes were slightly lower than expected. The trade balance also showed a more negative picture than forecast, but not too far off the expectation.
The US Dollar index (DXY) rose by +0.50%. US 30y, 10y, and 2y Treasury Yields all rose but the yield curve continues to recover from the temporary inversion last week. High Yield (HYG) and Investment Grade (LQD) Corporate Bond prices declined sharply. Brent Oil is hovering near $105 a barrel.
The put/call ratio (PCCE) rose to 0.753. The CNN Fear & Greed index moved toward the Fear range but remains close to Neutral.
All big six meg-caps declined. Nvidia (NVDA) declined by -5.22%, closing below its 21d EMA. Amazon (AMZN) lost -2.55%, dropping back below its 200d MA. The other four remain above their moving average lines but are showing the same volatility as the rest of the market.
United Health (UNH) was at the top of the mega-cap list with a +1.52% gain. Alibaba (BABA) was at the bottom of the list, declining by -5.53% today. Alibaba topped the list yesterday.
Only two stocks in the Daily Update Growth List, RH (RH) and Twitter (TWTR) ended the day with gains. RH gained +7.10% after Josh Brown of Ritholtz doubled his position in the company. Beyond Meat (BYND) was at the bottom of the list, dropping by -7.85%. The stock had plenty of company as more than half of the list declined more than 5%.
-=x=-=x=-=x=-=x=-=x=-=x=-=x=-
Looking ahead
After the market opens on Wednesday, we'll get the weekly update on Crude Oil Inventories. The Meeting Minutes from the most recent FOMC gathering will be released in the afternoon, giving investors more detail into the conversations around inflation and the proposed Fed response.
-=x=-=x=-=x=-=x=-=x=-=x=-=x=-
Trends, Support, and Resistance
The Nasdaq lost support at 14,500 on the economic data and then descended further after Brainard's public comments on inflation and the Fed response.
If the index is to return to the trend line from the 3/14 low, it would require a +4.34% advance. That is not likely to happen in just one day.
The five-day trend line is pointing to a +0.26% advance for Wednesday.
If the one-day trend line continues, the index will test the 21d EMA with a possible decline of -1.51%.
-=x=-=x=-=x=-=x=-=x=-=x=-=x=-
Wrap-up
Why did Lael Brainard's hawkish views cause so much turmoil in the markets? She's considered one of the most dovish of the Fed governors. So it was a big deal when she said the Fed should draw down the balance sheet at a rapid pace. It also adds more evidence to the mix that the Fed will also raise interest rates by 50 basis points next month, compared to the 25 basis points last month.
Stay healthy and trade safe!

SPX likely just Finished a Cycle HighI have Swing short signals all over the place. SMH, IYT, and XLI leading markets lower to start the Quarter here. The Russel had a real bad day today as the credit markets (junk bonds) are tanking once again. Even Energy looks to be resetting lower.

Daily Market Update for 4/4Summary: Equities rallied on the first day of the week. Large-cap growth stocks drove the rally while Twitter soared 27% on news that Elon Musk bought a significant stake in the company.
Notes
Ideas always welcome in the comments. Errors will be amended as comments on TradingView or corrected inline in my blog.
-=x=-=x=-=x=-=x=-=x=-=x=-=x=-
Monday, April 4, 2022
Facts: +1.90%, Volume lower, Closing Range: 99%, Body: 92% Green
Good: Higher high, higher low, great closing range
Bad: Lower volume on gain
Highs/Lows: Higher high, Higher low
Candle: Mostly green body, small lower wick
Advance/Decline: 1.18
Indexes: SPX (+0.81%), DJI (+0.30%), RUT (+0.21%), VIX (+0.16%)
Sector List: Communications (XLC +2.76%) and Consumer Discretionary (XLY +2.25%) at the top. Utilities (XLU -0.77%) and Health (XLV -0.83%) at the bottom.
Expectation:
-=x=-=x=-=x=-=x=-=x=-=x=-=x=-
Market Overview
Equities rallied on the first day of the week. Large-cap growth stocks drove the rally while Twitter soared 27% on news that Elon Musk bought a significant stake in the company.
The Nasdaq rose by +1.90%. Volume was lower than the previous day. The candle is 92% green body with a tiny lower wick and really no upper wick as the index ended the day with a 99% closing range. The higher high and higher low starts the week off in an uptrend. There were more advancing stocks than declining stocks.
The S&P 500 (SPX) gained +0.81%. The Dow Jones Industrial Average (DJI) advanced by +0.30%. The Russell 2000 (RUT) rose by +0.21%. The VIX Volatility Index (VIX) moved higher by +0.16%.
Five of the eleven S&P 500 sectors gained. Communications (XLC +2.76%) and Consumer Discretionary (XLY +2.25%) were the top sectors, the former helped by Twitter's big gain. Utilities (XLU -0.77%) and Health (XLV -0.83%) were at the bottom of the sector list.
Factory Orders for February met expectations.
The US Dollar index (DXY) rose by +0.43%. US 30y and 10y Yields rose while the 2y Yield declined. Both High Yield (HYG) and Investment Grade (LQD) Corporate Bond prices advanced. Brent Oil rose back above $105 for a barrel.
The put/call ratio (PCCE) declined to 0.640. The CNN Fear & Greed index is at the mid-point of Neutral.
All big six mega-caps gained with Tesla (TSLA) leading the way, advancing +5.61% for the day. Amazon (AMZN) closed back above its 200d moving average, gaining +2.93% today. All big six are above their key moving averages.
Alibaba (BABA) was the top mega-cap for the day. It advanced +6.62% along with many other Chinese stocks that rallied. Pfizer (PFE) was at the bottom of the list, declining by -1.22% today.
Twitter (TWTR) was the top stock in the Daily Update Growth List. The company's stock price soared +27.12% after Elon Musk took a 9% stake in the company. Twitter was followed by Chinese Fintech companies. FUTU Holding (FUTU) gained +19.51% and UP Fintech (TIGR) gained +13.74%. There were no decliners in the list, but Crowdstrike (CRWD) landed at the bottom, advancing only +0.52% today.
-=x=-=x=-=x=-=x=-=x=-=x=-=x=-
Looking ahead
Tuesday morning will bring Import/Export data for February. We will also get the Services and Non-Manufacturing PMI data for March. The data shows the level of activity in those sectors. API Weekly Crude Oil stock comes in the afternoon.
-=x=-=x=-=x=-=x=-=x=-=x=-=x=-
Trends, Support, and Resistance
The Nasdaq moved met resistance at the 14,500 level, but then closed above that level after a late-session rally.
If the index returns to the trend line from the 3/14 low, that would mean a +2.17% gain for Tuesday.
The one-day trend line points to a +0.77%.
The five-day trend line is still sloping downward from the 3/29 high. That line ends with a -1.79% decline for tomorrow.
-=x=-=x=-=x=-=x=-=x=-=x=-=x=-
Wrap-up
It was a good start to the week. Investors seem positive about the news of withdrawals in Ukraine. It also helped to have the shiny object of Twitter's rally to attract attention to the market. We'll see if the rally can continue this week.
Stay healthy and trade safe!

Daily Market Update for 4/1Summary: Small-caps led the way higher on Friday, but defensive sectors continued to top the sector list with mixed news in economic data.
Notes
Ideas always welcome in the comments. Errors will be amended as comments on TradingView or corrected inline in my blog.
-=x=-=x=-=x=-=x=-=x=-=x=-=x=-
Friday, April 1, 2022
Facts: +0.29%, Volume lower, Closing Range: 74%, Body: 5% Red
Good: High closing range, recovery from dip
Bad: Lower high, lower low
Highs/Lows: Lower high, Lower low
Candle: Thin red body in upper part of candle, long lower wick
Advance/Decline: 1.1, more advancing than declining stocks
Indexes: SPX (+0.34%), DJI (+0.40%), RUT (+1.01%), VIX (-4.52%)
Sector List: Real Estate (XLRE +1.99%) and Utilities (XLU +1.40%) at the top. Technology (XLK -0.30%) and Industrials (XLI -0.78%) at the bottom.
-=x=-=x=-=x=-=x=-=x=-=x=-=x=-
Market Overview
Small-caps led the way higher on Friday, but defensive sectors continued to top the sector list with mixed news in economic data.
The Nasdaq rose +0.29%. The candle has a thin red body in the upper half and a long lower wick. Despite the high closing range of 74%, the candle has a lower high and lower low from the previous day. Volume was lower than Thursday. However, there were more advancing stocks than declining stocks.
The Russell 2000 (RUT) outperformed the other indexes, moving up by +1.01%. The S&P 500 (SPX) advanced +0.34% and the Dow Jones Industrial Average (DJI) gained +0.40%. The VIX Volatility Index fell by -4.52%.
Eight of the eleven S&P 500 sectors gained for the day. Real Estate (XLRE +1.99%) and Utilities (XLU +1.40%) were the top-performing sectors. Technology (XLK -0.30%) and Industrials (XLI -0.78%) were at the bottom of the list.
Payrolls grew less than expected in March, with Nonfarm Payrolls gaining 431,000 compared to the forecast of 490,000. However, the unemployment rate declined to 3.6%, better than the expected 3.7%. The ISM Manufacturing PMI that shows the health of the sector, came in at 57.1 compared to the expected 59.0
The US Dollar index (DXY ) gained by +0.22%. The US 30y Treasury Yield declined while the 10y and 2y Treasury Yields rose. High Yield (HYG) Corporate Bond prices fell but Investment Grade (LQD) Corporate Bond prices gained slightly. Brent Oil ended the week below $105.
The put/call ratio (PCCE) declined to 0.784. The CNN Fear & Greed index is on the Fear side, but near Neutral.
Four of the big six gained for the day. Alphabet (GOOG) had the biggest gain, advancing +0.75% after testing its 200d MA. Tesla (TSLA), Microsoft (MSFT), and Amazon (AMZN) followed with +0.75%, +0.36% and +0.35% gains. Apple (AAPL) and Nvidia (NVDA) declined but only Amazon remains below its 200d MA.
Verizon Wireless (VZ) was the top mega-cap for the day. The communications company gained +2.32% on Friday. Nvidia was the worst-performing stock in the mega-cap list.
Stocks in the Daily Update Growth List did well for the day. Fastly (FSLY) topped the list with a +7.65% gain. Draft Kings (DKNG) was at the bottom of the list, declining by -2.16%.
-=x=-=x=-=x=-=x=-=x=-=x=-=x=-
Looking ahead
Factory Orders data for February will be released on Monday after the market opens.
ZoomInfo (ZI) is among a shortlist of earnings reports to start the week.
-=x=-=x=-=x=-=x=-=x=-=x=-=x=-
Trends, Support, and Resistance
Despite the daily gain, the Nasdaq put in a lower low and lower high on the day, continuing a downtrend over the last three days of the week.
If the index returns to the trend line from the 3/14 low, that would require a +3.88% for Monday. Returning to that trend line would likely take a few days.
The five-day trend line is in decline, but the index would still need a +0.25% to return to that line.
The one-day trend line is also in decline despite ending the day with a gain. If the one-day trend continues, expect a -0.78% decline for Monday.
-=x=-=x=-=x=-=x=-=x=-=x=-=x=-
Wrap-up
After two strong days on Monday and Tuesday, the Nasdaq entered a downtrend for the remainder of the week. It's not a bad thing, as it allows moving averages to catch up, keeping the market from getting extended.
Oil prices seem to be coming down which is good. Maersk says that supply chain issues created by shipping costs could be resolved in a few months. That is good news. Market direction for next week depends a lot on the war in Ukraine.
Stay healthy and trade safe!

Daily Market Update for 3/31Summary: No sector avoided losses among continuing worries over the war in Ukraine and the Fed's response to inflation. Chinese stocks moved lower on disappointing economic data and COVID outbreaks.
Notes
Ideas always welcome in the comments. Errors will be amended as comments on TradingView or corrected inline in my blog.
-=x=-=x=-=x=-=x=-=x=-=x=-=x=-
Thursday, March 31, 2022
Facts: -1.54%, Volume lower, Closing Range: 1%, Body: 94% Red
Good: Lower volume
Bad: Closing range, advance/decline
Highs/Lows: Lower high, Lower low
Candle: Mostly red body, tiny upper wick
Advance/Decline: 0.41, more than two declining for every advancing stock
Indexes: SPX (-1.57%), DJI (-1.56%), RUT (-1.00%), VIX (+6.36%)
Sector List: Utilities (XLU -0.11%) and Consumer Staples (XLP -0.24%) at the top. Consumer Discretionary (XLY -1.92%) and Financials (XLF -2.29%) at the bottom.
-=x=-=x=-=x=-=x=-=x=-=x=-=x=-
Market Overview
No sector avoided losses among continuing worries over the war in Ukraine and the Fed's response to inflation. Chinese stocks moved lower on disappointing economic data and COVID outbreaks.
The Nasdaq fell by -1.54%. Volume was lower than the previous day but the 94% red body and 1% closing range show selling throughout the day. There is a small upper wick formed after open but then a sell-off in the last hour erased a lower wick leaving behind a thick red bodied candle. There were more than two declining stocks for every advancing stock.
The S&P 500 (SPX) lost -1.57% while the Dow Jones Industrial Average (DJI) fell by -1.56%. Small caps held up the best with the Russell 2000 (RUT) declining only -1.00%. The VIX Volatility Index rose +6.26%.
All S&P 500 sectors declined. Defensive sectors were at the top of the sector list. Utilities (XLU -0.11%) and Consumer Staples (XLP -0.24%) had the least significant declines. Consumer Discretionary (XLY -1.92%) and Financials (XLF -2.29%) were at the bottom of the list.
PCE Price Index data was slightly lower than forecast. Weekly Initial Jobless claims came in at 202,000 compared to the forecast of 197,000. The Chicago PMI for March showed a stronger than expected manufacturing sector.
The US Dollar index (DXY) grew +0.52%. US 30y and 10y Treasury Yields were lower while the 2y Yields increased. High Yield (HYG) and Investment Grade (LQD) Corporate bond prices moved lower. Brent Oil moved below $110, ending the day at $105.22.
The put/call ratio (PCCE) rose to 0.787. The CNN Fear & Greed index is just on the Fear side of Neutral. The NAAIM Money Manager Exposure Index rose to 79.72 from 52.69 the previous week.
All of the big six declined today. Alphabet had the biggest loss, declining by -2.10%. However, Amazon (AMZN) is the only one trading below any moving average line (the 200d MA).
No mega-caps gained today. Costco (COST) faired the best, only declining -0.11%. The biggest loser was Alibaba (BABA), declining -6.67% to end up at the bottom of the list.
The Daily Update Growth List had just eight stocks with gains. The best stock in the list was MongoDb, gaining +3.11%. Chinese stocks were at the bottom of the list with FUTU Holdings (FUTU) having the largest decline. The stock fell by -12.94%.
-=x=-=x=-=x=-=x=-=x=-=x=-=x=-
Looking ahead
Tomorrow is payrolls Friday when we get the monthly look at employment data in the early morning. We will also get the ISM Manufacturing Purchasing Managers Index after the market opens.
-=x=-=x=-=x=-=x=-=x=-=x=-=x=-
Trends, Support, and Resistance
The Nasdaq continued to pull back from the recent rally.
If the index will return to the trend line from the 3/14 low, it would take a +4.49% gain which is not likely to come in one day.
The five-day trend line points to a +2.80% gain.
If the one-day trend continues, we can expect another -0.23% decline for Friday.
-=x=-=x=-=x=-=x=-=x=-=x=-=x=-
Wrap-up
Investor jitters drove selling today. The war in Ukraine. Continuing high inflation. Economic data from China amid COVID outbreaks. Those were the major themes and will continue to drive volatility in the days and possibly weeks ahead.
We just ended the worst quarter for equities since the pandemic began. Here's hoping for a better Q2!
Stay healthy and trade safe!

Daily Market Update for 3/30Summary: Stocks pulled back after yesterday's rally as investors awaited any breakthroughs in the Russia-Ukraine negotiations.
Notes
Ideas always welcome in the comments. Errors will be amended as comments on TradingView or corrected inline in my blog.
-=x=-=x=-=x=-=x=-=x=-=x=-=x=-
Wednesday, March 30, 2022
Facts: -1.21%, Volume lower, Closing Range: 26%, Body: 52% Red
Good: Lower volume on decline, still well above last week's close
Bad: Closing range, lower high, lower low
Highs/Lows: Lower high, Lower low
Candle: Medium red body in middle of candle, equal upper and lower wicks
Advance/Decline: 0.33, three declining for every advancing stock
Indexes: SPX (-0.63%), DJI (-0.19%), RUT (-1.97%), VIX (+2.28%)
Sector List: Energy (XLE +1.16%) and Utilities (XLU +0.83%) at the top. Technology (XLK -1.33%) and Consumer Discretionary (XLY -1.52%) at the bottom.
-=x=-=x=-=x=-=x=-=x=-=x=-=x=-
Market Overview
Stocks pulled back after yesterday's rally as investors awaited any breakthroughs in the Russia-Ukraine negotiations.
The Nasdaq fell by -1.21%. The decline nearly filled the gap-up at yesterday's open. Volume was lower than the previous day. The 52% red body sits in the middle of candle with equal length upper and lower wicks. The upper wick, formed in the morning. The index then declined, briefly pausing at 14,500 before moving lower. A quick rally before the close created the lower wick.
The Russell 2000 (RUT) had the biggest decline, pulling back by -1.97% today. The S&P 500 (SPX) dropped -0.63%. The Dow Jones Industrial Average (DJI) declined only -0.19%, helped by a rally in energy stocks.
Four of the eleven S&P 500 sectors gained. Energy (XLE +1.16%) was at the top of the sector list, followed closely by Utilities (XLU +0.83%). The other two gaining sectors were both defensive sectors. Technology (XLK -1.33%) and Consumer Discretionary (XLY -1.52%) were at the bottom of the list.
GDP data for Q4 was lower than expected, showing quarter-over-quarter growth of 6.9% compared to expected growth of 7.1%. GDP Price Index data also came in lower than expected, possibly good news that prices are growing less quickly than thought. Crude Oil Inventories were lower than expected, helping boost oil prices today.
Brent Oil prices moved higher on reports that Germany may ration oil and the US Crude Oil Inventories were lower than expected. The US Dollar index (DXY) declined by -0.58%. US 30y, 10y, and 2y Treasury Yields all declined and the inversion in the 10y and 2y started to recover. High Yield (HYG) Corporate Bond prices declined while Investment Grade (LQD) Corporate Bond prices rose.
The put/call ratio (PCCE) declined to 0.627. The CNN Fear & Greed index is at Neutral.
All big six declined. Amazon (AMZN) dipped back below its 200d MA but all others are well above moving averages.
Novo Nordisk (NOVO) was the top mega-cap today, advancing +2.12%. UnitedHealth (UNH) followed with a +2.12% advance, helping the health sector end the day with gains. ASML Holding (ASML) was at the bottom of the mega-cap list, declining by -3.47%.
The Daily Update Growth List had only three gainers. Lululemon Athletica (LULU) was at the top of the list, gaining +9.58% on strong earnings and a stock repurchase announcement. RH (RH) and Chewy (CHWY) both disappointed investors with their earnings and landed at the bottom of the list. They declined by -13.33% and -16.10% respectively.
-=x=-=x=-=x=-=x=-=x=-=x=-=x=-
Looking ahead
PCE Price Index Data along with Personal Spending for February comes in the morning. We will also get the weekly Initial Jobless Claims. After the market opens, the Chicago Purchasing Managers Index data will provide a look at manufacturing health.
Walgreens (WBA) reports earnings tomorrow. The company will give one more look at the health of the Retail sector which so far had mixed results in earnings this week.
-=x=-=x=-=x=-=x=-=x=-=x=-=x=-
Trends, Support, and Resistance
The Nasdaq pulled back from yesterday's rally. On the way down, it go support at 14,500 but then ended the day below that area.
If the index returns to the trend line from the 3/14 low, that would mean a +2.83% gain for Thursday.
The five-day trend line points to a +2.11% gain.
If the pull-back continues, the one-day trend line ends with a -1.15% decline for tomorrow.
-=x=-=x=-=x=-=x=-=x=-=x=-=x=-
Wrap-up
Investors, and the general public, were hoping for more of a breakthrough in negotiations to end the war between Russia and Ukraine. Negotiators on both sides needed time to write a formal agreement and get support from within their parties. Talks will resume in online formats on Friday.
Germany has said it may start to ration oil. That caused Brent Oil to rise above $110 again today but is now back below that mark. Tomorrow's inflation data tomorrow will have the most influence over markets as we wait for better news from Ukraine.
Stay healthy and trade safe!

RTY UpdateRSI overbought with MFI divergence, yields and oil rising. I don;t think this is sustainable.
Took a small short position, but I think the reversal is tomorrow.
Small Caps look Very BullishThe SPY and QQQ look like they need a rest. However, the RTY looks ready for bullish continuation.

Daily Market Update for 3/28Summary: More yield curve inversion in bond markets raised eyebrows while a drop in oil prices helped equities rally.
Notes
Ideas always welcome in the comments. Errors will be amended as comments on TradingView or corrected inline in my blog.
I had a vacation last week and decided to stay away from the computer as much as possible, so no Daily Updates for the past week. Overall a constructive week for the market, but fear-driven volatility persists as global events unfold and the yield curve inverts for the first time since 2008.
-=x=-=x=-=x=-=x=-=x=-=x=-=x=-
Monday, March 28, 2022
Facts: +1.31%, Volume lower, Closing Range: 100%, Body: 70% Green
Good: 100% closing range, consistent gains after morning dip.
Bad: Lower volume, and advance/decline ratio below 1.0
Highs/Lows: Higher high, Higher low
Candle: Thick green body above a medium lower wick. No upper wick.
Advance/Decline: 0.64, three declining stocks for every two advancing
Indexes: SPX (+0.71%), DJI (+0.27%), RUT (+0.00%), VIX (-5.67%)
Sector List: Consumer Discretionary (XLY +2.67%) and Real Estate (XLRE +1.27%) at the top. Materials (XLB -0.45%) and Energy (XLE -2.48%) at the bottom.
-=x=-=x=-=x=-=x=-=x=-=x=-=x=-
Market Overview
More yield curve inversion in bond markets raised eyebrows while a drop in oil prices helped equities rally.
The Nasdaq gained +1.31% for the day, continuing the rally since March 14. Volume was lower than the previous day and there were more declining stocks than advancing stocks. So although the rally continues, it is slowing. That could be constructive, allowing for moving averages to catch up. Or it could mean another dip is ahead.
The S&P 500 (SPX) gained +0.71%. The Dow Jones Industrial Average (DJI) gained +0.27%. The Russell 2000 (RUT) stayed flat. The VIX Volatility Index declined -5.67%, continuing to drop back to normal levels, but still elevated.
Consumer Discretionary (XLY +2.67%) led the sector list, helped by Tesla's (TSLA) 8% gain. Real Estate (XLRE +1.27%) was the next best sector. Materials (XLB -0.45%) and Energy (XLE -2.48%) were at the bottom of the sector list. The Energy sector was brought down by a dip in oil prices.
The 5y Treasury Yield rose above the 30y yield for the first time since February 2006. Inversions signal future recessions. The inversion in 2006 preceeded the 2008 Financial Crisis and a 60% correction in US equity markets.
Brent Oil fell by -8.64% but remained above $105. The US Dollar index (DXY) rose +0.32% today. US 30y and 10y Treasury Yields declined while the 5y and 2y Treasury yields advanced. Both High Yield (HYG) and Investment Grade (LQD) Corporate Bond prices rose. Silver and Gold both declined sharply.
The put/call ratio declined to 0.654.
The big six all gained today with Tesla (TSLA) leading the way with a +8.03% gain. Amazon (AMZN) and Microsoft (MSFT) followed with +2.56% and +2.31% gains. With Amazon moving above its 200d moving average, now all six are above the three key moving average lines.
Tesla topped the broader mega-cap list as well. Big oil companies were at the bottom of the list with Royal Dutch Shell (SHEL) having the biggest loss, declining by -2.90%.
The Daily Update Growth List did very well with only a handful of declining stocks in the list. At the top of the list was DoorDash (DASH), gaining +8.68%. GrowGeneration (GRWG) declined by -4.05%, ending down at the bottom of the list.
-=x=-=x=-=x=-=x=-=x=-=x=-=x=-
Looking ahead
How Price Index data for January will be available in the morning. After the market opens, we'll see CB Consumer Confidence for March and the JOLTs Job Openings for February.
More Fed members are scheduled to speak tomorrow and investors will be watching for any aggressively hawkish comments.
API Weekly Crude Oil Stock comes in the afternoon.
Lululemon Athletica (LULU), Chewy (CHWY), RH (RH) are among some of the interesting earnings reports for Tuesday.
-=x=-=x=-=x=-=x=-=x=-=x=-=x=-
Trends, Support, and Resistance
The Nasdaq seems to have support at 14,000 and is heading toward the support/resistance area of 14,500.
If the trend from the 3/14 low continues, we can expect a +1.89% advance for Tuesday.
The one-day trend line points to a +0.33%.
If the index returns to the five-day trend line, that would mean a -0.72% decline.
-=x=-=x=-=x=-=x=-=x=-=x=-=x=-
Wrap-up
It will be interesting to watch how the market reacts to more inversion in the yield curve. The higher yields on shorter-term Treasuries could be a combination of worries about the war in Ukraine, but also could be over fears of a recession induced by the Fed's attempts to control inflation.
Typically, an inversion signals a recession that is still months to a couple of years away.
Stay healthy and trade safe!

RUT Russell 2000 Support and ResistanceRUT Russell 2000 bounced from the strong support of $1940 and is heading to the $2180 resistance.
I also think we might see the end of the war soon.
Russia says the first phase of its “military operation” in Ukraine is mostly complete.
Looking forward to read your opinion about it.

RTY MFI oversoldJust noticed this, probably means garbage stocks get a pump tomorrow.
ES MFI almost went oversold as well, I think I was too focused on NQ premarket. All indications are a pump tomorrow for Ponzi Friday

RTY UpdateLooks to me like the market just wants to bounce sideways, I hope that's the case because sideways rangebound trading is just about the easiest way to make money.
In any case, if you're still bullish, wait until MFI goes oversold before buying the dip. I woke up late today and missed the morning drop so staying out for now. Garbage stocks are tempting but I'll probably have to wait to see what happens tomorrow.
Might buy a few CHWY puts or something EOD if there's no afternoon rebound.
I told you guys short squeezes always run 3 or 4 days, looks like that's over. Could just go sideways though.
Daily Market Update for 3/18Summary: The Nasdaq had its best week since November 2020, rallying more than 10% from Monday's low to close with a +8.18% gain.
Notes
Ideas always welcome in the comments. Errors will be amended as comments on TradingView or corrected inline in my blog.
-=x=-=x=-=x=-=x=-=x=-=x=-=x=-
Friday, March 18, 2022
Facts: +2.05%, Volume higher, Closing Range: 99%, Body: 89% Green
Good: High volume advance, great closing range
Bad: Nothing
Highs/Lows: Higher high, Higher low
Candle: Mostly green body, tiny lower wick, no upper wick
Advance/Decline: 1.86, more than three advancing for every two declining stocks
Indexes: SPX (+1.17%), DJI (+0.80%), RUT (+1.02%), VIX (-7.01%)
Sector List: Consumer Discretionary (XLY +2.11%) and Technology (XLK +2.05%) at the top. Energy (XLE -0.09%) and Utilities (XLU -0.85%) at the bottom.
-=x=-=x=-=x=-=x=-=x=-=x=-=x=-
Market Overview
The Nasdaq had its best week since November 2020, rallying more than 10% from Monday's low to close with a +8.18% gain.
The tech-dominated index rose +2.05% for the day. Volume was much higher thanks to a quadruple witching day where derivative contracts all expire the same day, causing an increase in volume. The candle is 89% green body with a 99% closing range, leaving behind a small lower wick created right after the market opened.
The S&P 500 (SPX) climbed by +1.17%. The Dow Jones Industrial Average (DJI) rose by +0.80%. The Russell 2000 (RUT) advanced +1.02%. The VIX Volatility Index fell further, declining -7.01% today.
Nine of the eleven S&P 500 (SPX) sectors gained today. Growth sectors led again with Consumer Discretionary (XLY +2.11%) and Technology (XLK +2.05%) at the top of the sector list. Energy (XLE -0.09%) and Utilities (XLU -0.85%) were the two declining sectors.
Existing Home Sales for February declined -7.2% month-over-month. Much more than the forecast of a -1.0% decline.
Brent Oil remained above $100, closing at $105 today. The US Dollar index (DXY) gained +0.22%. The US 30y and 10y Treasury yieldS declined while the 2y Treasury yield advanced. High Yield (HYG) and Investment Grade (LQD) Corporate Bond prices advanced. Gold and Silver declined. Timber continues to rise back toward its 2022 highs after dropping sharply this month.
The put/call ratio (PCCE) declined to 0.676. The CNN Fear & Greed index is in the middle of the Fear range as it moves back toward neutral. A drop in market volatility and less demand for safe-haven assets is driving the move in the index.
The big six made significant progress in their charts today. Nvidia (NVDA) is outperforming in the current rally, gaining +6.81% and well above its moving average lines. All six are above their 21d exponential moving average. Five are above their 50d moving average. Three of the six are above their 200d moving average.
Alibaba (BABA) topped the mega-cap list with a +7.90% gain, beating out Nvidia for the top spot. Verizon Communications (VZ) was at the bottom of the list, declining -2.98%.
In the Daily Update Growth List, UP Fintech (TIGR) was at the top. The company benefited from both the momentum in Chinese stocks and a great earnings report and outlook. The stock soared +33.66% today. The stock is up +73.42% for the week and over 100% from its low on Monday. The other Chinese stocks in the list also dominated the top spots.
Only two stocks declined in the growth list, Solar Edge (SEDG) declined -0.66% and Penn National Gaming (PENN) lost -0.11%.
-=x=-=x=-=x=-=x=-=x=-=x=-=x=-
Looking ahead
There is not much economic data scheduled for Monday, but Fed Chair Jerome Powell will speak in the morning.
Nike (NKE), Pinduoduo (PDD), and Tencent Music Entertainment (TME) report earnings on Monday.
-=x=-=x=-=x=-=x=-=x=-=x=-=x=-
Trends, Support, and Resistance
The Nasdaq moved above the 13,800 and closed right just above the 50d moving average line.
The one-day and five-day trend lines and the trend line from the 3/14 low all point to a gain of around 2% on Monday if the current momentum continues.
-=x=-=x=-=x=-=x=-=x=-=x=-=x=-
Wrap-up
I thought there might be a pullback in indexes today as investors take profits and protect from war news over the weekend. The optimism and high volume from expiring derivative contracts were enough to keep the strong rally from Monday's low alive.
Stay healthy and trade safe!

Daily Market Update for 3/17Summary: All sectors rose on Thursday as investors' worries eased about interest rate hikes and the war in Ukraine. However, oil prices are on the rise again and could create more volatility to close the week.
Notes
Ideas always welcome in the comments. Errors will be amended as comments on TradingView or corrected inline in my blog.
-=x=-=x=-=x=-=x=-=x=-=x=-=x=-
Thursday, March 17, 2022
Facts: +1.33%, Volume lower, Closing Range: 98%, Body: 84% Green
Good: Closing range, support at 21d EMA, advance/decline
Bad: Lower volume
Highs/Lows: Higher high, Higher low
Candle: Mostly green body with a tiny lower wick
Advance/Decline: 2.85, almost three advancing for every declining stock
Indexes: SPX (+1.23%), DJI (+1.23%), RUT (+1.69%), VIX (-3.75%)
Sector List: Energy (XLE +3.44%) and Materials (XLB +1.92%) at the top. Consumer Staples (XLP +0.69%) and Utilities (XLU +0.42%) at the bottom.
-=x=-=x=-=x=-=x=-=x=-=x=-=x=-
Market Overview
All sectors rose on Thursday as investors' worries eased about interest rate hikes and the war in Ukraine. However, oil prices are on the rise again and could create more volatility to close the week.
The Nasdaq rose +1.33%. Volume was lower than the previous day. The candle is covered by an 84% green body. A tiny lower wick formed when the index dipped to the 21d EMA. The closing range of 98% comes after a late afternoon rally. There were nearly three advancing stocks for every declining stock.
Small-caps outperformed today with the Russell 2000 (RUT) gaining +1.69%. The S&P 500 (SPX) and the Dow Jones Industrial Average (DJI) both rose by +1.23%. The VIX Volatility Index declined by -3.75%.
All S&P 500 sectors advanced. Energy (XLE +3.44%) and Materials (XLB +1.92%) were the top two as oil prices and commodity prices rose again. Consumer Staples (XLP +0.69%) and Utilities (XLU +0.42%) were at the bottom of the sector list.
Building Permits and Housing Starts in February were higher than forecasted. The weekly Initial Jobless Claims came in less than expected. There were only 214,000 claims vs the forecast of 220,000. The Philadelphia Fed Manufacturing Index for March showed much better conditions than expected, with the index registering 27.4 vs the expectation of 15.0.
The US Dollar Index (DXY) declined by -0.39%. US Treasury yields didn't move much but all declined a bit today. High Yield (HYG) and Investment Grade (LQD) Corporate Bond prices continued to rebound higher from their low points on Monday. Brent Oil closed the day above $100 again. Silver and Gold both were higher.
The put/call ratio (PCCE) declined to 0.709. The CNN Fear & Greed index moved back into the Fear range from Extreme Fear yesterday. The NAAIM money manager exposure index rose to 46.68 from exposure of 42.58 last week.
The big six all rose but more modestly than the previous two days. Tesla (TSLA) had the biggest gain, rising by +3.73% today. Amazon (AMZN) was next with a +2.70% gain. Nvidia (NVDA) closed above its 50d moving average, gaining +1.10%, and is not above all three moving averages I track.
Tesla topped the broader mega-cap list with its gain. At the bottom of the list was Alibaba (BABA), declining -4.39% as investors take profits from yesterday's massive rise for Chinese stocks.
Lemonade (LMND) topped the Daily Update Growth List, gaining +14.54%. The Chinese stocks that topped the list yesterday, were at the bottom of the list today. Niu Technologies (NIU) declined by -6.51%, landing at the bottom of the list.
-=x=-=x=-=x=-=x=-=x=-=x=-=x=-
Looking ahead
After the market opens on Friday, we'll have the Existing Home Sales stats for February.
Friday is a quadruple witching day for the market which means that derivatives for stock index futures, stock index options, stock options, and single stock futures all expire on the same day creating more volatility than usual in the market.
-=x=-=x=-=x=-=x=-=x=-=x=-=x=-
Trends, Support, and Resistance
The Nasdaq rose in the morning but then dipped back to the 21d EMA where it got support and then rose higher for the rest of the day.
The trend line from the 3/14 low is pointing at a +2.81% advance if this current rally can continue.
The one-day trend line ends with a +1.48% gain for tomorrow.
The five-day trend line points to a -0.29% decline.
-=x=-=x=-=x=-=x=-=x=-=x=-=x=-
Wrap-up
The market seems much more optimistic over the last few days. There's a big spike in stocks that are over their 50d moving average as the gains since Tuesday were broadly shared across the market. Still, after three days of big gains and investors wanting to protect from war news over the weekend, we may see some selling to end the week.
Stay healthy and trade safe!

S&P AnalysisLet's look at the money-supply adjusted S&P. If you're not familiar with money-supply adjusted charts, just know that money supply expansion always fuels the rise in asset prices first. Historically this takes about 6-18 months to play out. Now ask yourself, how long has it been since the 2020 mega-easing policy response of the FED? It seems like those tailwinds are now behind us and fading. In 2020, it sure seemed like we were headed into a bear market, there was a sharp correction down, but at the risk of losing capital, market participants had to resort to obeying the master that is monetary policy, or risk losing capital.
Sorry for all of the lines and arrows here but stick with me for a minute :)
It's important to define what the criteria for a "decline" is in order to know what to expect. I don't believe the coercion in 2020 can be definitively described as a correction/decline for various reasons, but let's try to keep it technical here, in terms of what the chart tells us.
Before a DECLINE, there were a few things that played out together in 2001 and 2008:
1) A declining 100W SMA for 1 year or longer.
2) RSI 14 SMA 14 made a quick break to the 30s/40s area and STAYED there for longer than 6 months.
3) There was a few years of divergence in the RSI 14 SMA 14.
Before a RECOVERY, there were a few things that played out together in 2003 and 2009:
1) Price broke out above the 100W SMA.
2) RSI 14 SMA 14 made a break above 50.
3) Once #1 and #2 took place, the 100W SMA began rising.
The market is still indecisive at the moment. Our criteria of a DECLINE has not been met. At the same time, neither has our criteria for a RECOVERY, because we did not see a DECLINE.
Dip buyers are buying in with all they've got. But is that really enough to prop up a 50 trillion dollar stock market (before you account for derivatives)?
I must admit, it's really hard to be completely bullish or bearish here. I'm tending on the side of bearishness because it means that I have less to lose overall. I'd rather lose less than gain more at this point. The market isn't exactly showing raging bullish potential here with looming rising interest rates. But we haven't seen any definitive bearish signs either. Which means we could be in store for some complex correction action until our "DECLINE" criteria is finally met.
One thing is clear though, there's so many traders willing to buy the dip right now, it's safe to say that most of them have never experienced devastating losses, which is usually a sign of looming losses to come.
Thanks for reading and I hope this gives some perspective on the current risk of the assets market.
Don't forget to hedge your bets!

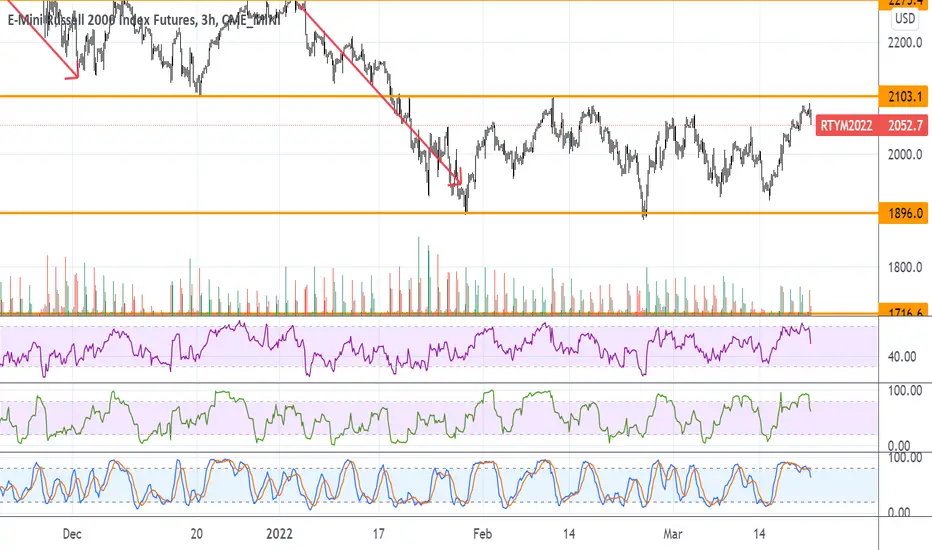
What is going on in Small Caps?After successfully predicting a 10-15% decline in Russell 2000 now we need to look at it once again..!
I think the top of the orange box could be a strong resistance level and the relief rally will be ended there..!
Also, this could be the SOW part of Wyckoff model:
Best,
Dr. Moshkelgosha M.D
DISCLAIMER
I’m not a certified financial planner/advisor, a certified financial analyst, an economist, a CPA, an accountant, or a lawyer. I’m not a finance professional through formal education. The contents on this site are for informational purposes only and do not constitute financial, accounting, or legal advice. I can’t promise that the information shared on my posts is appropriate for you or anyone else. By using this site, you agree to hold me harmless from any ramifications, financial or otherwise, that occur to you as a result of acting on information found on this site.

Daily Market Update for 3/16Summary: The Fed brought no new surprises today, but the initial reaction caused a dip in indexes that reversed into a late after rally higher. Chinese stocks took off after the government pledged to support the stock market and not penalize companies with foreign listings.
Notes
Ideas always welcome in the comments. Errors will be amended as comments on TradingView or corrected inline in my blog.
-=x=-=x=-=x=-=x=-=x=-=x=-=x=-
Wednesday, March 16, 2022
Facts: +3.77%, Volume higher, Closing Range: 99%, Body: 71% Green
Good: Closing range of 99%, higher volume
Bad: Nothing
Highs/Lows: Higher high, Higher low
Candle: Gap up, large green body over long lower wick, not upper wick
Advance/Decline: 3.34, more than three advancing for every declining stock
Indexes: SPX (+2.24%), DJI (+1.55%), RUT (+3.14%), VIX (-10.59%)
Sector List: Consumer Discretionary (XLY +3.41%) and Technology (XLK +3.25%) at the top. Utilities (XLU -0.18%) and Energy (XLE -0.46%) at the bottom.
-=x=-=x=-=x=-=x=-=x=-=x=-=x=-
Market Overview
The Fed brought no new surprises today, but the initial reaction caused a dip in indexes that reversed into a late after rally higher. Chinese stocks took off after the government pledged to support the stock market and not penalize companies with foreign listings.
The Nasdaq closed +3.77% higher for the day. The index opened with a gap up which faded as the Fed interest rate news approached. When the news hit, the Nasdaq fell -1.92% in about 30 minutes but then reversed and climbed +3.42% from the intraday low. The wild session created a long lower wick that sites below a 71% green body and a 99% closing range. There were more than three advancing stocks for every declining stock.
The Russell 2000 (RUT) advance +3.14%. The S&P 500 (SPX) climbed by +2.24%. The Dow Jones Industrial Average (DJI) rose by +1.55%. The VIX Volatility Index fell -10.59%.
Nine of the eleven S&P 500 (SPX) sectors gained for the day. Growth sectors led with Consumer Discretionary (XLY +3.41%) and Technology (XLK +3.25%) at the top of the list. Utilities (XLU -0.18%) and Energy (XLE -0.46%) were the two losing sectors.
The Fed's decision was to raise interest rates by 25 basis points, a widely anticipated level for the first-rate hike. However, the Fed also announced plans to take on inflation aggressively with up to seven more rate hikes this year to end the year with a 1.75% to 2% interest rate. That aggressive stance was likely the reason for the initial reaction from investors.
In other economic news, Retail Sales and Core Retail Sales for February were less than forecast. Export Prices were higher and Import Prices were lower than forecast. Crude Oil Inventories were higher than expected.
The US Dollar index (DXY) fell by -0.62% with most of that coming after the Fed announcement. The US 30y Treasury Yield declined while the 10y and 2y Yield rose. High Yield (HYG) and Investment Grade (LQD) Corporate Bond prices rose. Brent Oil topped $100 briefly but ended the day with a decline.
The put/call ratio (PCCE) declined to 0.795. The CNN Fear & Greed index moved closer to Neutral but remained in the Extreme Fear range.
All of the big six advanced. Microsoft (MSFT), Alphabet (GOOG), and Nvidia (NVDA) rose above their 21d EMA lines. Amazon (AMZN) closed above both its 21d EMA and 50d MA.
Alibaba (BABA) topped the mega-cap list with a massive +36.76% gain as the Chinese government vowed to support public companies. Stocks at the bottom of the mega-cap list all had less than 1% declines. Johnson & Johnson was at the bottom of the list with a -0.92% decline.
23 stocks in the Daily Update Growth List gained over 10%. The six Chinese stocks in the list gained over 25%. The top stock was Futu Holdings which soared by +39.54%. Not a single stock in the list declined. CrowdStrike (CRWD) had the smallest gain, advancing by +0.54%.
-=x=-=x=-=x=-=x=-=x=-=x=-=x=-
Looking ahead
Building Permits and Housing Starts data for February will come in the morning. We will also get the weekly Initial Jobless Claims. Just before the market opens, the Industrial Production numbers for February will be released.
-=x=-=x=-=x=-=x=-=x=-=x=-=x=-
Trends, Support, and Resistance
The index met resistance at the 21d EMA in the morning, then got support at 13,000 in the afternoon dip, and finally climbed back to close above the 21d EMA.
Because of the sharp afternoon rally, even the one-day regression trend line points to a decline tomorrow, which would be -0.96%.
If the index returns to the five-day trend line, it would mean a -2.95% decline.
The trend line from the 2/10 high points to a -4.89%.
Just for some optimism, if we followed the trend line from the 3/14 low, it points to a +2.58% gain for Thursday.
-=x=-=x=-=x=-=x=-=x=-=x=-=x=-
Wrap-up
What a wild reaction to the Fed announcement. It may take some time to sort out where investors in both equities and bonds see the impact of the more hawkish fed. We might see some more volatility over the next few days as investors react to the Fed's new plans and any developments in Ukraine.
Stay healthy and trade safe!
