RTY UpdateSmall caps getting pumptarded. Target is around 2400 around next Wed, but there's a chance it could get rejected at 2350 resistance.
Note that it's close to overbought again, but market doesn't care during a melt up.
Not posting any other indices because all I'm gonna show is a melt up.
RUSSELL 2000

Daily Market Update for 10/21Summary: Investors continued the bullish rally on positive earnings reports, sending the S&P 500 to a new record close. However, it wasn't all positive, with some companies taking a beating after disappointing results.
Notes
Ideas always welcome in the comments. Errors will be amended as comments on TradingView or corrected inline in my blog.
-=x=-=x=-=x=-=x=-=x=-=x=-=x=-
Thursday, October 21, 2021
Facts: +0.62%, Volume higher, Closing Range: 95%, Body: 87% Green
Good: Another HH/HL day, thick green body, higher volume
Bad: Advance/decline ratio
Highs/Lows: Higher high, Higher low
Candle: Thick green body with tiny upper and lower wicks
Advance/Decline: 0.72, more declining than advancing stocks
Indexes: SPX (+0.30%), DJI (-0.02%), RUT (+0.28%), VIX (-3.10%)
Sector List: Consumer Discretionary (XLY +1.47%) and Health (XLV +0.41%) at the top. Financials (XLF -0.42%) and Energy (XLE -1.85%) at the bottom.
Expectation: Sideways or Higher
-=x=-=x=-=x=-=x=-=x=-=x=-=x=-
Market Overview
Investors continued the bullish rally on positive earnings reports, sending the S&P 500 to a new record close. However, it wasn't all positive, with some companies taking a beating after disappointing results.
The Nasdaq gained +0.62% on a much higher volume than the previous day. The 87% green body covers the candle, leaving behind tiny upper and lower wicks. The closing range was 95%. Despite the bullish candle, there were more declining stocks than advancing stocks in the index.
The S&P 500 (SPX) hit a new record close, gaining +0.30% for the day. The Russell 2000 (RUT) climbed by +0.28%, while a disappointing earnings report from IBM held down the Dow Jones Industrial Average (DJI). The industrial index declined -0.02% for the day. The VIX Volatility Index fell -3.10%, ending the day with its lowest close since the start of the pandemic.
Consumer Discretionary (XLY +1.47%) and Health (XLV +0.41%) were at the top of the sector list. The cyclical sectors underperformed, with Financials (XLF -0.42%) and Energy (XLE -1.85%) losing the most for the day.
Initial Jobless Claims were at 290,000 compared to a forecast of 300,000. The Philadelphia Fed Manufacturing Index missed expectations, signaling some slowdown in demand. The index measured 23.8 against a forecast of 25.0. Existing Home Sales for September were 6.29 million compared to the forecast of 6.09 million.
The US Dollar index (DXY) rose by +0.17%. US Treasury Yields rose while the gap between long-term and short-term yields tightened. Both High Yield (HYG) and Investment Grade (LQD) corporate bond prices declined, impacted by rising yields (yields go up, prices go down). Copper and Aluminum Futures fell sharply, dropping -3.52% and -5.57%.
The put/call ratio (PCCE) remained about the same, ending the day at 0.548. The CNN Fear & Greed index is inching toward the Extreme Greed range. The NAAIM money manager exposure index rose to 98.02 from 64.46 the previous week.
Microsoft (MSFT) led the four largest mega-caps higher, gaining +1.09% for the day. Apple (AAPL), Amazon (AMZN), and Alphabet (GOOGL) all had gained, and their respective charts look healthy. Netflix (NFLX) rose +4.48%, topping the mega-cap list after the market reacted negatively to a stellar earnings report two days earlier. PayPal (PYPL) declined sharply for a second day, dropping -5.86% today and ending at the bottom of the mega-cap list.
IBM (IBM) fell -9.56% after missing expectations on earnings, weighing down the Dow for the day.
FUTU Holdings (FUTU) and UP Fintech (TIGR) topped the Daily Update Growth List as the two Chinese brokerages bounced back from a sharp sell-off last week. Fiverr (FVRR) and PayPal (PYPL) are at the bottom of the list, declining -3.91% and -5.86%.
Digital World Acquisition Corp (DWAC) rose +356.83% after revealing they would facilitate a reverse merger with Donald Trump's new media company, Trump Media & Technology Group.
-=x=-=x=-=x=-=x=-=x=-=x=-=x=-
Looking ahead
Manufacturing and Services PMI data becomes available Friday morning as the market opens. Jerome Powell is scheduled to speak later in the morning.
Honeywell (HON), American Express (AXP), and Royal Caribbean (RCL) release earnings tomorrow.
-=x=-=x=-=x=-=x=-=x=-=x=-=x=-
Trends, Support, and Resistance
The Nasdaq continued its uptrend today with another higher high and higher low.
The five-day trend line points to a +0.62% gain for Friday.
The one-day and five-day trend lines point to a +0.17% advance.
-=x=-=x=-=x=-=x=-=x=-=x=-=x=-
Wrap-up
The bullish sentiment continues as the S&P 500 (SPX) sets yet another record close for the year. While bond tapering is sure to begin in the next month, investors seem to be ready for the transition. The next deadline for the government budget and dead ceiling is in December, which allows for some more time before a potential event that will change sentiment.
The expectation continues to be Sideways or Higher until the market tells us something different.
Stay healthy and trade safe!

Daily Market Update for 10/20Summary: Positive earnings reports continue to move markets higher while big tech stocks took a breather for the day.
Notes
Ideas always welcome in the comments. Errors will be amended as comments on TradingView or corrected inline in my blog.
-=x=-=x=-=x=-=x=-=x=-=x=-=x=-
Wednesday, October 20, 2021
Facts: -0.05%, Volume lower, Closing Range: 47%, Body: 36% Red
Good: Higher high, higher low, pause within a uptrend
Bad: Lower close, otherwise nothing alarming
Highs/Lows: Higher high, Higher low
Candle: Thin body in upper half of red candle, longer lower wick
Advance/Decline: 0.99, about equal advancing and declining stocks
Indexes: SPX (+0.37%), DJI (+0.43%), RUT (+0.61%), VIX (-1.34%)
Sector List: Utilities (XLU +1.58%) and Real Estate (XLRE +1.53%) at the top. Consumer Discretionary (XLY -0.07%) and Technology (XLK -0.28%) at the bottom.
Expectation: Sideways or Higher
-=x=-=x=-=x=-=x=-=x=-=x=-=x=-
Market Overview
Positive earnings reports continue to move markets higher while big tech stocks took a breather for the day.
The tech-heavy Nasdaq declined -0.05%, a lateral move after several days of gains. Volume was lower than the previous day as the uptrend in the index remained intact with a higher high and a higher low. The 36% red body is in the upper half of the candle above a longer lower wick and a 47% closing range. There was about an equal number of advancing stocks and declining stocks.
Small-caps led the day with a +0.61% gain for the Russell 2000 (RUT). The S&P 500 (SPX) advanced +0.37%, while the Dow Jones Industrial Average (DJI) gained +0.43%. The VIX Volatility Index dropped -1.34% today.
Utilities (XLU +1.58%) and Real Estate (XLRE +1.53%) were at the top of the sector list. The defensive sectors still have some catchup to do after lagging in the recent rally. Consumer Discretionary (XLY -0.07%) and Technology (XLK -0.28%) were the only losing sectors. The action among big tech companies seemed profit-taking rather than concern from investors.
Crude Oil Inventories surprised with higher demand than expected. Inventories showed a -0.431 million barrel shortage vs. an expected 1.857 million barrel surplus. This afternoon, the Federal Reserve Governor Randal Quarles said that economic tests were met, and tapering could begin next month. He also said that inflation should recede into next year, and pulling forward interest rate hikes was unnecessary.
The US Dollar Index (DXY) dropped by -0.20%. The US 30y and 10y Treasury Yields rose, likely on Quarles confirmation that bond purchase tapering would begin soon. The 2y Treasury Yield declined. High Yield (HYG) Corporate Bond prices moved higher while Investment Grade (LQD) corporate bond prices dropped. Silver and Gold rose on the weaker dollar. Aluminum Futures are falling back from recent record highs.
The put/call ratio (PCCE) rose slightly to 0.550. The CNN Fear & Greed Index continues to move further into the Greed range.
Of the four largest mega-caps, only Apple (AAPL) gained for the day. However, the charts for all four still look good after some profit-taking today. Abbott Labs (ABT) and UnitedHealth (UNH) were the top mega-caps of the day, leading the Health Sector (XLV) higher. Abbott Labs released earnings, beating expectations on the top and bottom line and improving guidance for 2021. PayPal (PYPL) declined -4.91% after rumors stated the company is in talks to acquire Pinterest (PINS).
Pinterest (PINS) topped the Daily Update Growth List with a 12.77% gain on the PayPal acquisition rumors. Penn National Gaming (PENN) joined PayPal at the bottom of the growth list. More than half of the growth list declined for the day.
-=x=-=x=-=x=-=x=-=x=-=x=-=x=-
Looking ahead
Initial Jobless Claims and the Philadelphia Fed Manufacturing Index will be available in the morning before the market opens. After the market opens, Existing Home Sales data will be released.
PayPal (PYPL), Intel (INTC), AT&T (T), SAP (SAP), Snap (SNAP), Southwest Airlines (LUV), KeyCorp (KEY), American Airlines (AAL), Snap-on (SNA), Crocs (CROX), AutoNation (AN), Alaska Air (ALK), and Mattel (MAT) are some of the interesting earnings reports in a long list scheduled for Thursday.
-=x=-=x=-=x=-=x=-=x=-=x=-=x=-
Trends, Support, and Resistance
The Nasdaq paused after several days of gains, staying well above the 15,000 support area.
The five-day trend line points to a +1.06% gain for tomorrow.
The line from the 10/4 low points to a +0.24% gain for Thursday.
The one-day trend line would result in a -0.42% decline.
-=x=-=x=-=x=-=x=-=x=-=x=-=x=-
Wrap-up
The Nasdaq paused after several days of gains while the rest of the market took a step higher to catch up. Small-caps and defensive stocks, in particular, were lagging.
There is some room for the index to retest the 15,000 area. However, the uptrend is intact, and so I'm expecting either a Sideways or Higher move without some catalyst to cause a pullback.
Stay healthy and trade safe!

Daily Market Update for 10/19Summary: Investors remained bullish on Tuesday as earnings reports start to pick up, and analysts expect positive results. Indexes ticked higher while several sectors traded at record levels.
Notes
Ideas always welcome in the comments. Errors will be amended as comments on TradingView or corrected inline in my blog.
-=x=-=x=-=x=-=x=-=x=-=x=-=x=-
Tuesday, October 19, 2021
Facts: +0.71%, Volume higher, Closing Range: 92% (w/gap), Body: 64% Green
Good: Gap up to steady gains in morning, high closing range
Bad: Nothing
Highs/Lows: Higher high, Higher low
Candle: Gap up, mostly green body, longer lower wick
Advance/Decline: 1.19, more advancing than declining stocks
Indexes: SPX (+0.74%), DJI (+0.56%), RUT (+0.36%), VIX (-3.74%)
Sector List: Health (XLV +1.31%) and Utilities (XLU +1.26%) at the top. Consumer Staples (XLP +0.04%) and Consumer Discretionary (XLY -0.28%) at the bottom.
Expectation: Sideways or Higher
-=x=-=x=-=x=-=x=-=x=-=x=-=x=-
Market Overview
Investors remained bullish on Tuesday as earnings reports start to pick up, and analysts expect positive results. Indexes ticked higher while several sectors traded at record levels.
The Nasdaq advanced another +0.71% today, the fifth consecutive day of gains. The index opened with a gap up and made steady gains through the morning. A dip in the afternoon created a small upper wick, but the index closed with a 92% closing range with the gap. The higher volume with more advancing stocks than declining stocks makes for a constructive day.
The S&P 500 (SPX) gained +0.74%, with gains spread across most sectors. The Dow Jones Industrial Average (DJI) advanced +0.56%. The Russell 2000 (RUT) rose +0.36%. The VIX Volatility Index (VIX) closed at its lowest point since August, declining -3.74% today.
Health (XLV +1.31%) and Utilities (XLU +1.26%) were at the top of the sector list. The two defensive sectors outperformed, which could be a signal of some caution. However, it could just be some rotation into cheaper equities that need to catch up with the rest of the market. Consumer Discretionary (XLY -0.28%) was the only sector to decline for the day, but that came after an all-time high set at the open.
Building Permits and Housing Starts data released in the morning was below the forecast, but the market did not seem concerned with the miss. Fed officials speaking in the afternoon indicated inflation could last longer than previously thought and that the labor market may not return to pre-pandemic levels.
The US Dollar index (DXY) declined -0.17% today. 30y and 10y Treasury Yields rose while the 2y Treasury Yield fell. High Yield (HYG) Corporate Bonds rose for the day while Investment Grade (LQD) Corporate Bonds declined. Crude Oil Futures advanced higher, continuing to set new records. Copper and Aluminum futures fell today but remain near highs.
The put/call ratio declined to 0.538. The CNN Fear & Greed index moved well into the Greed area.
Alibaba (BABA) was the top mega-cap, advancing +6.10% after announcing new cloud server chips today. Johnson & Johnson (JNJ) missed expectations on revenue in its morning earnings release but improved the outlook for the year, sending the stock up 2.34%. Procter & Gamble (PG) beat earnings estimates but said rising costs were impacting the business, sending it to the bottom of the mega-cap list with a -1.18% decline. There were only a handful of mega-caps that declined for today.
Fastly (FSLY) gained +10.72%, topping the Daily Update Growth List. The gain came after the US granted a patent to the company for load balancing across origin services. CloudFlare (NET) broke a 12-day winning streak with a decline today, ending with a -4.36%, the worst performance in the growth list. The decline may be related to Fastly's gain as both are CDN providers, and the patent could impact Cloudflare.
-=x=-=x=-=x=-=x=-=x=-=x=-=x=-
Looking ahead
Crude Oil Inventories will be available in the morning.
Tesla (TSLA), ASML Holding (ASML), IBM (IBM) are a few of the mega-caps reporting earnings tomorrow.
-=x=-=x=-=x=-=x=-=x=-=x=-=x=-
Trends, Support, and Resistance
The Nasdaq rose further above the 15,000 support area and cleared a previous pivot high at 15,085. The next critical level is 15,200.
The five-day trend line points to a +1.19% gain for Wednesday.
The one-day trend line ends with a +0.40% gain.
If the index returns to the trend line from the 10/4 low, that will result in a -0.39% decline for tomorrow.
-=x=-=x=-=x=-=x=-=x=-=x=-=x=-
Wrap-up
The Fed's comments on drawn-out inflation could have had much more of a negative impact today. They also mentioned that the labor market might not return to pre-pandemic levels. So why didn't the market react more negatively? Despite these headwinds and low consumer sentiment, retail sales still soared last month.
Analysts likely see more resilience in the economy than previously thought. Corporations have had to innovate against the pandemic for the past year. In the face of labor shortages, that innovation needs to continue. Productivity in the labor force is rising, a clear sign of that innovation. Ultimately, innovation will be deflationary. So perhaps we are even seeing the market look past inflation, look past stagflation, and start to see the opportunity for tech and growth stocks.
The expectation for tomorrow is for Sideways or Higher. The index may need to pause after several days of gains, but we shouldn't see a move lower unless something changes.
Stay healthy and trade safe!

Daily Market Update for 10/18Summary: Weak GDP data from China wasn't enough to break optimism for investors after last week's surprise Retail Sales data. Indexes started lower but recovered with steady gains throughout the day.
Notes
Ideas always welcome in the comments. Errors will be amended as comments on TradingView or corrected inline in my blog.
-=x=-=x=-=x=-=x=-=x=-=x=-=x=-
Monday, October 18, 2021
Facts: +0.84%, Volume lower, Closing Range: 97%, Body: 94% Green
Good: Bullish engulfing candle in an uptrend, close above 15,000 support
Bad: Lower volume, low advance/decline line
Highs/Lows: Higher high, Lower low
Candle: Bullish engulfing candle, very small upper and lower wicks
Advance/Decline: 0.57, almost two declining stocks for every advancing stock
Indexes: SPX (+0.34%), DJI (-0.10%), RUT (+0.10%), VIX (+0.18%)
Sector List: Consumer Discretionary (XLY +1.22%) and Technology (XLK +0.85%) at the top. Health (XLV -0.68%) and Utilities (XLU -0.96%) at the bottom.
Expectation: Sideways or Higher
-=x=-=x=-=x=-=x=-=x=-=x=-=x=-
Market Overview
Weak GDP data from China wasn't enough to break optimism for investors after last week's surprise Retail Sales data. Indexes started lower but recovered with steady gains throughout the day.
The Nasdaq ended the day with a +0.84% gain. Volume was lower than the previous day. The candle is all green body, completely engulfing the previous day's candle and presenting very small upper and lower wicks as the index made steady gains throughout the day. Still, there were almost two declining stocks for every advancing stock.
The S&P 500 (SPX) gained +0.34%, carried higher by big tech stocks in the Consumer Discretionary and Technology sectors. The Russell 2000 (RUT) gained only +0.10%, while the Dow Jones Industrial Average (DJI) ended the day with a -0.10% decline.
Consumer Discretionary (XLY +1.22%) and Technology (XLK +0.85%) were the top sectors for the day. Defensive sectors, including Health (XLV -0.68%) and Utilities (XLU -0.96%), were at the bottom of the sector list.
GDP growth in China was lower than expected, causing the indexes to open with losses. Industrial Production growth for the US was also lower than expected, but investors were more focused on Friday's surprise Retail Sales data.
The US Dollar remained flat for the day, losing only -0.01% in the index (DXY). The US 30y Treasury Yield declined while the 10y and 2y yields advanced. High Yield (HYG) and Investment Grade (LQD) Corporate Bond prices fell. Crude Oil, Copper, and Aluminum futures remained at record highs while the Timber declined for the day.
The put/call ratio declined to 0.558. The CNN Fear & Greed index moved back to the Greed side but remained near Neutral.
Apple (AAPL) led the four largest mega-caps with gains for the day. The company announced new notebook products, advancing +1.18% for the day, stopping just short of the 50d MA line. The other three are trading above their key moving average lines.
Facebook (FB) was the top mega-cap for the day, followed by Tesla (TSLA). Facebook rose after revealing plans to build out the Metaverse, hiring over 10,000 works in Europe. Tesla rose on analyst predictions that they would beat revenue projections in Q3. They both gained over +3% today. Walt Disney (DIS) was at the bottom of the mega-cap list, losing more than -3% after a downgrade from Barclays.
Cloudflare (NET) rose another +7.80% today, topping the Daily Update Growth List again. The company announced a partnership with Microsoft to improve website search results. The stock is on its 12th straight positive session and has gained more than 60% in October. Upwork (UPWK) was at the bottom of the growth list, declining -3.14% today, pulling back from the recent rally.
-=x=-=x=-=x=-=x=-=x=-=x=-=x=-
Looking ahead
Tomorrow will kick-off with Building Permits, and Housing Starts data for September. Three Fed officials (Daly, Bowman, and Bostic) are scheduled to speak tomorrow. Crude Oil Inventories will be available after the market close.
Johnson & Johnson (JNJ), Netflix (NFLX), Philip Morris (PM), Fifth Third (FITB), and Proctor & Gamble (PG) will release earnings tomorrow.
-=x=-=x=-=x=-=x=-=x=-=x=-=x=-
Trends, Support, and Resistance
The Nasdaq moved above the 15,000 support/resistance area today. The next critical level is at 15,085, the previous peak in late September before the index dropped lower.
The one-day and five-day trend lines point at a +1.02% gain for Tuesday.
The trend line from the 10/4 low ends with a -0.47% decline for tomorrow.
-=x=-=x=-=x=-=x=-=x=-=x=-=x=-
Wrap-up
It seems today's bullishness among investors is a carry-over from last week's surprise Retail Sales data. The data showed that inflation was not keeping consumers away from spending and pushed off stagflation fears, at least for now. Despite slower job growth, consumers have plenty of money to spend after record savings during the pandemic.
After four days of gains, it certainly would be OK for the index to move sideways for tomorrow, but I believe support will hold at 15,00. The expectation for tomorrow is Sideways or Higher.
Stay healthy and trade safe!

Daily Market Update for 10/15Summary: Retail Sales jumped 0.7% in September compared to analysts' expectation for a decline. That gave a massive boost to Consumer Discretionary stocks while the Financial sector topped a week of positive earnings reports with a huge beat from Goldman Sachs.
Notes
Ideas always welcome in the comments. Errors will be amended as comments on TradingView or corrected inline in my blog.
-=x=-=x=-=x=-=x=-=x=-=x=-=x=-
Friday, October 15, 2021
Facts: +0.50%, Volume higher, Closing Range: 90% (w/gap), Body: 11% Green
Good: Move above 50d MA on higher volume, high closing range
Bad: Nothing
Highs/Lows: Higher high, Higher low
Candle: Gap up, long lower wick didn't fill gap, thin body
Advance/Decline: 0.52, two declining stocks for every advancing stock
Indexes: SPX (+0.75%), DJI (+1.09%), RUT (-0.37%), VIX (-3.32%)
Sector List: Consumer Discretionary (XLY +1.53%) and Financials (XLF +1.49%) at the top. Consumer Staples (XLP -0.24%) and Utilities (XLU -0.29%) at the bottom.
Expectation: Sideways or Higher
-=x=-=x=-=x=-=x=-=x=-=x=-=x=-
Market Overview
Retail Sales jumped 0.7% in September compared to analysts' expectation for a decline. That gave a massive boost to Consumer Discretionary stocks while the Financial sector topped a week of positive earnings reports with a huge beat from Goldman Sachs.
The Nasdaq climbed above its 50d moving average with a +0.50% advance today on higher volume. The candle has a thin green body, covering just 11% in the upper half of the stick. The long lower wick wasn't enough to fill a gap at open. Despite the gain on higher volume, there were two declining stocks for every advancing stock as small-caps struggled today.
The Russell 2000 (RUT) started the day with a +1.41% gain but lost support and ended with a -0.37% decline. The S&P 500 (SPX) and Dow Jones Industrial Average (DJI) gained +0.75% and +1.09%. The VIX Volatility Index receded -3.32% as investors relaxed from stagflation fears.
Consumer Discretionary (XLY +1.53%) and Financials (XLF +1.49%) were at the top. Consumer Discretionary got a boost from retail sales, while Financials gained on an excellent earnings week. Both sector ETFs set new all-time highs. Consumer Staples (XLP -0.24%) and Utilities (XLU -0.29%) were at the bottom of the list as investors moved to higher-risk equities in growth and cyclical sectors.
Retail Sales grew 0.7% in September compared to the forecast for a -0.2% decline. However, the impact of higher prices at the cash register has weighed on the consumer. Consumer Expectations and Consumer Sentiment data came in lower than expected, and both remain near low levels set back in August. The NY Empire State Manufacturing Index also came in lower than expected, registering 19.8 compared to a forecast of 27.0.
The US Dollar declined slightly (DXY -0.03%) while US Treasury yields moved higher. The yield curve continues to flatten as the gap between long-term and short-term yields tightens. High Yield (HYG) And Investment Grade (LQD) Corporate Bonds declined after two days of sharp increases. Gold retreated -1.62%. Copper is nearing a record high while Aluminum continues to set new records.
The put/call ratio rose to 0.684. The CNN Fear & Greed index moved back to Neutral after hitting Extreme Fear several times in October. The NAAIM money manager exposure index declined to 64.46 from 68.6 the previous week.
Amazon (AMZN) gained +3.31% on the retail sales data today, leading the four largest mega-caps higher and shooting past both the 21d EMA and 50d MA lines. All four largest mega-caps ended the day with gains. Only Apple (AAPL) remains below its 50d MA.
Mastercard (MA) was the top mega-cap for the day, matching Amazon's +3.31% and benefiting from expected higher transaction fees that go along with a rise in retail sales. Tesla (TSLA) also topped +3.02%, making a list of China's top 15 EV manufacturers by deliveries. There were not many decliners in the mega-cap list, but Facebook found itself at the bottom with a -1.15% decline as the Communications sector also declined today.
It was mixed results for the Daily Update Growth List. NIO (NIO) topped the list with a +3.94% gain. NIO did not make the list of the top 15 EV manufacturers in China but announced doubling its manufacturing capacity. FUTU Holdings and UP Fintech continued to sell-off on regulatory fears, with FUTU at the bottom of the growth list, declining -13.66% today.
-=x=-=x=-=x=-=x=-=x=-=x=-=x=-
Looking ahead
Industrial Production data will be available Monday morning, and an update to the Federal Budget Balance will come in the afternoon.
Although next week will be another busy earnings week, none are significant for the Daily Update on Monday.
-=x=-=x=-=x=-=x=-=x=-=x=-=x=-
Trends, Support, and Resistance
The Nasdaq rose above the 50d MA today and is approaching the 15,000 support/resistance area.
The one-day and five-day trend lines show a similar result, approximately a +0.28% gain for Monday.
If the index returns to the trend line from the 10/4 low, expect a -0.32% decline which would be a move below the 50d MA.
-=x=-=x=-=x=-=x=-=x=-=x=-=x=-
Wrap-up
Friday marked the end of a constructive week for the market. Investors set aside fears of stagflation and looked at improving retail activity as an indicator consumers are getting back out and spending despite higher prices at the cash register. Key sectors are leading indexes higher.
While the Nasdaq, S&P 500, and Dow Jones heads back toward new highs, the small-caps in the Russell 2000 continue to chop up and down. That may change once the Fed begins tapering bond purchases, sending the USD higher, and weighing on valuations for large multinational corporations.
Communications was the only sector to decline for the week. Facebook continues to face scrutiny over social media policies which could turn into regulation for the sector.
With the increasing volume as the index moves higher, it's reasonable to expect more gains for next week. Resistance levels will come at 15,000, 15,085, and 15,200 before the index can attempt a new high. The expectation for Monday is Sideways or Higher.
Stay healthy and trade safe!

RUT LongWe have bounced off the 200 EMA on the daily chart . We are at support of the 34 ema on the weekly chart. We have had a long period of consolidation now. Corrections can happen with time or price. This has been a correction of time. The candle lows have been making higher lows and have been forming hammers on the daily chart . The higher lows on the daily chart combined with the support of the EMA’s is what makes me bullish . We also have a symmetrical triangle formation on the daily chart which we broke out of and retested intraday today. The S&P and NASDAQ have had huge run ups and some of the money may be rotating out of those indexes into the Russel. BTC is breaking out and looking to retest all time highs. If it starts making new all time highs I expect there to be an easier environment for the Russel to rise. The stop is below the low of the consolidation. If we break that I am no longer bullish and will have to re-evaluate. I would try and take an entry off a smaller time frame with a much higher stop to increase the RR on the trade. Another way to go about this is waiting for the Russel to start trending higher and confirming the analysis and then buying the first large enough pull back. Waiting for this will allow for confirmation of the trade idea and give a better RR as well.

Daily Market Update for 10/14Summary: Even today's worst-performing sector gained over one percent, marking a very bullish day with gains broad across the market. The Nasdaq had a 1.4 advance/decline ratio, while the New York Stock Exchange recorded a ratio of 3.6 advancers to decliners.
Notes
Ideas always welcome in the comments. Errors will be amended as comments on TradingView or corrected inline in my blog.
-=x=-=x=-=x=-=x=-=x=-=x=-=x=-
Thursday, October 14, 2021
Facts: +1.73%, Volume lower, Closing Range: 98% (w/gap), Body: 83% Green
Good: Very bullish day with very few declines, high closing range, higher volume
Bad: Gap may need to be revisited
Highs/Lows: Higher high, Higher low
Candle: Gap up at open, mostly green body
Advance/Decline: 1.38, more advancing stocks than declining stocks
Indexes: SPX (+1.71%), DJI (+1.56%), RUT (+1.44%), VIX (-9.55%)
Sector List: Materials (XLB +2.43%) and Technology (XLK +2.25%) at the top. Consumer Staples (XLP +1.13%) and Consumer Discretionary (XLY +1.05%) at the bottom.
Expectation: Higher
-=x=-=x=-=x=-=x=-=x=-=x=-=x=-
Market Overview
Even today's worst-performing sector gained over one percent, marking a very bullish day with gains broad across the market. The Nasdaq had a 1.4 advance/decline ratio, while the New York Stock Exchange recorded a ratio of 3.6 advancers to decliners.
The Nasdaq ended the day with a +1.73% after gapping up in the morning. Volume was higher than the previous day, and the candle is mostly green body with a 98% closing range, including the gap. There were more advancing stocks than declining stocks.
The S&P 500 (SPX) was the next best-performing index with a +1.71% advance. The Dow Jones Industrial Average (DJI) climbed by +1.56%, and the Russell 2000 (RUT) advanced by +1.44%. The VIX Volatility Index (VIX) fell back to its lowest level since mid-September with a -9.55% decline today.
All S&P 500 sectors gained for the day. Materials (XLB +2.43%) and Technology (XLK +2.25%) are at the top of the list. Consumer Staples (XLP +1.13%) and Consumer Discretionary (XLY +1.05%) were at the bottom, both still gaining over one percent.
Producer Price Index data came in lower than expected. Core PPI, which excludes food and energy, was at 0.2% month-over-month compared to 0.5%. Total PPI came in at 0.5% against the 0.6% expectation. While a miss in PPI is typically bearish for the US Dollar, it’s a welcome sight in this year's market since it is a leading indicator of inflation.
Initial Jobless Claims came in at 293,000 against a forecast of 319,000, showing strength in the labor market recovery. Crude Oil Inventories were much higher than expected at 6.1 million barrels compared to a forecast of 0.7 million barrels.
The US Dollar declined only -0.02% for the day. US 30y and 10y Treasury Yields fell while the 2y yield advanced. High Yield (HYG) and Investment Grade (LQD) Corporate Bond prices both sharply increased. Silver and Gold both advanced. Timber, Copper, and Aluminum all advanced.
The put/call ratio declined to 0.590. The CNN Fear & Greed index is still in the Fear range but moving closer to Neutral. The NAAIM money manager exposure index declined to 64.46 from 68.6 the previous week.
Things are looking much better for the four largest mega-caps. Microsoft (MSFT) and Alphabet (GOOGL) ad over 2% advances to close higher than the 21d EMA and 50d MA lines. Apple (AAPL) and Amazon (AMZN) also advanced today but have some work before clearing the moving averages.
ASML Holding (ASML), Bank of America (BAC), and United Health (UNH) all soared over 4% to top the mega-cap list. Both Bank of America and United Health beat earnings expectations before the market opened. Overall earnings releases for big banks have been very positive this week. There were only four decliners in the list, with Oracle (ORCL) losing -1.16% to end up at the bottom.
GrowGeneration (GRWG) bounced back from yesterday's loss to climb +5.21% today and top the daily update growth list. UP Fintech (TIGER) and FUTU Holdings (FUTU) were at the bottom of the list, declining -21.19% and -12.41%. Investors turned very bearish on the two companies after new privacy laws in China could restrict investors from using the platforms for international investments.
-=x=-=x=-=x=-=x=-=x=-=x=-=x=-
Looking ahead
Retail Sales data is due on Friday morning before the market opens. In addition, Export/Import price indexes, the NY Empire State Manufacturing Index, Business Inventories, and Michigan Consumer Sentiment/Expectations data will all be available in the morning.
Tomorrow's premarket earnings reports include Goldman Sachs (GS).
-=x=-=x=-=x=-=x=-=x=-=x=-=x=-
Trends, Support, and Resistance
The Nasdaq soared above its 21d EMA today but closed below the 50d MA.
If the one-day trend line continues into Friday, that will mean a +0.61% advance.
After today's huge gain, a return to the five-day trend line and the trend line from the 10/4 low points to a -0.67% decline for tomorrow.
-=x=-=x=-=x=-=x=-=x=-=x=-=x=-
Wrap-up
Relief on inflation and a strong labor report was just what investors needed to put off stagflation fears and get back into equity positions. It also helped that earnings reports from the financial sector have mainly been positive this week.
Based on today's bullish action, the expectation for tomorrow is higher. There is the chance for a decline to fill today's gap, which may happen if any surprises come in the morning economic data. But I'd still expect today's bullish outlook to overcome any dip.
Stay healthy and trade safe!

Daily Market Update for 10/13Summary: Investors moved past inflation data to mark a day of gains in the market, but caution was present with defensive sectors outperforming. There were no surprises in the Fed's meeting minutes that confirmed a start to bond purchase tapering in November.
Notes
Ideas always welcome in the comments. Errors will be amended as comments on TradingView or corrected inline in my blog.
-=x=-=x=-=x=-=x=-=x=-=x=-=x=-
Wednesday, October 13, 2021
Facts: +0.73%, Volume lower, Closing Range: 85%, Body: 29% Green
Good: Green body almost entire above previous candle body, long lower wick
Bad: Nothing
Highs/Lows: Higher high, Higher low
Candle: Long lower wick under a short Green body
Advance/Decline: 1.01, one advancing stock for every declining stock
Indexes: SPX (+0.30%), DJI (-0.00%), RUT (+0.34%), VIX (-6.10%)
Sector List: Utilities (XLU +1.17%) and Materials (XLB +0.75%) at the top. Energy (XLE -0.09%) and Financials (XLF -0.57%) at the bottom.
Expectation: Sideways or Higher
-=x=-=x=-=x=-=x=-=x=-=x=-=x=-
Market Overview
Investors moved past inflation data to mark a day of gains in the market, but caution was present with defensive sectors outperforming. There were no surprises in the Fed's meeting minutes that confirmed a start to bond purchase tapering in November.
The Nasdaq closed the day with a +0.73% gain. Volume was slightly lower than the previous day. The 29% green body sits in the upper half of the candle, above a long lower wick formed in the first hour of trading. The index rebounded from the morning decline to end the day with an 85% closing range. There was an equal number of advancing and declining stocks.
The Russell 2000 (RUT) advanced +0.34%. The S&P 500 (SPX) rose +0.30%. The Dow Jones Industrial Average (DJI) remained flat for the day but regained losses from the morning. The VIX Volatility Index (VIX) declined -6.10%.
Utilities (XLU +1.17%) led the sector list, signaling caution among investors. Materials (XLB +0.75%) was in the second spot at the top of the sector list. Financials (XLF -0.57%) was the worst sector for the day despite several positive earnings reports in the morning. Although JP Morgan (JPM) beat predictions on revenues and earnings, they missed Net Interest Margin, a key indicator of business performance in big banks.
Core CPI came in at 4.0% year-over-year and 0.2% month-over-month as expected by analysts. However, the total CPI, which includes food and energy, rose 0.4% month-over-month compared to an expectation of 0.3%. API Weekly Crude Oil Stock was higher than expected, signaling less demand.
The US Dollar Index (DXY) declined -0.54%. The yield gap tightened more with 30y and 10y Treasury Yields dropping while the 2y Treasury yield rose. Both High Yield (HYG) and Investment Grade (LQD) Corporate Bond Prices moved higher. Silver and Gold both rose sharply. Timber and Copper also had significant gains for the day while Aluminum pulled back from record highs.
The put/call ratio (PCCE) climbed to 0.669. The CNN Fear & Greed index remained in the Fear range.
Apple (AAPL) was the only of the largest four mega-caps to decline for the day after news broke yesterday of iPhone 13 orders being reduced due to the chip shortage. Microsoft (MSFT) gained +1.17%, moving above its 21d exponential and 50d moving average line.
Novo Nordisk (NVO) was the top mega-cap for the day. Nobo, Alibaba (BABA), and ASML Holding (ASML) all had gains of over 2.5%. At the bottom of the mega-cap list was JP Morgan Chase (JPM), declining -2.64%.
Sea Limited (SE), DataDog (DDOG), and Crowdstrike (CRWD) topped the Daily Update Growth List, each gaining over 7% today. GrowGeneration (GRWG) declined -11.92% after canceling an acquisition, putting the stock at the bottom of the list.
-=x=-=x=-=x=-=x=-=x=-=x=-=x=-
Looking ahead
Tomorrow's economic calendar includes the Producer Price Index data and Initial Jobless Claims. Crude Oil Inventories comes later in the morning. In the afternoon, the Federal Budget Balance will be available.
Important earnings reports for tomorrow include Taiwan Semiconductor (TSM), United Health (UNG), Bank of America (BAC), Wells Fargo (WFC), Morgan Stanley (MS), Citigroup (C ), US Bancorp (USB), Walgreens Boots (WBA), and Domino's Pizza (DPZ).
-=x=-=x=-=x=-=x=-=x=-=x=-=x=-
Trends, Support, and Resistance
The Nasdaq moved back above the 14,500 support area but remained below its 50 moving average and 21d exponential moving average lines.
The continuation of the one-day trend line would result in a +0.34% gain for tomorrow.
The five-day trend line points to a -1.05% decline.
If the index returns to the trend line from the 9/7 high, that will result in a -1.73% decline for Thursday.
-=x=-=x=-=x=-=x=-=x=-=x=-=x=-
Wrap-up
Investors seemed to grow a bit more comfortable with inflation numbers today. Although there is plenty of caution in the market, there were no severe reactions to today's higher-than-expected price data. The worry remains that inflation is not transitory as the Fed has stated in the past and that the stalling labor market will lead to a case of stagflation.
On the chart, there was good support above yesterday's close, and the green body is almost entirely above the red body of yesterday. Overall, a bullish day for the index. Tomorrow, we'll look for more volume with continued breadth (high advance/decline ratio). The expectation is for sideways or higher.
Stay healthy and trade safe!

Daily Market Update for 10/12Summary: Soaring oil prices, supply chain disruptions, and bond tapering have investors buying up the US dollar while causing downward pressure on mega-caps stocks. Small caps led on Tuesday while big technology stocks declined.
Notes
I missed yesterday's update. First time in over a year to miss one, but I had a great two-day vacation with my kids. :)
Ideas always welcome in the comments. Errors will be amended as comments on TradingView or corrected inline in my blog.
-=x=-=x=-=x=-=x=-=x=-=x=-=x=-
Tuesday, October 12, 2021
Facts: -0.14%, Volume higher, Closing Range: 22%, Body: 66% Red
Good: Advance/decline ratio
Bad: Decline on higher volume, low closing range
Highs/Lows: Lower high, Lower low
Candle: Mostly red body with a longer lower wick
Advance/Decline: 1.09, more advancing than declining stocks
Indexes: SPX (-0.24%), DJI (-0.34%), RUT (+0.05%), VIX (-0.75%)
Sector List: Real Estate (XLRE +1.34%) and Consumer Discretionary (XLY +0.79%) at the top. Technology (XLK -0.52%) and Communications (XLC -0.93%) at the bottom.
Expectation: Sideways or Lower
-=x=-=x=-=x=-=x=-=x=-=x=-=x=-
Market Overview
Soaring oil prices, supply chain disruptions, and bond tapering have investors buying up the US dollar while causing downward pressure on mega-caps stocks. Small caps led on Tuesday while big technology stocks declined.
The Nasdaq declined -0.14% after several intraday rallies above 14,500 failed to get support. Volume was higher than the previous day. The red body covers 66% of the candle, which has a closing range of 22%. Despite the decline, there were more advancing stocks than declining stocks. The decrease in the index came primarily from large mega-caps.
The Russell 2000 (RUT) advanced +0.05%, with small-caps having better relative performance in the context of a stronger USD. The S&P 500 (SPX) declined -0.24%. The Dow Jones Industrial Average (DJI) fell -0.24%. The VIX Volatility Index (VIX) declined -0.75%.
Real Estate (XLRE +1.34%) and Consumer Discretionary (XLY +0.79%) were at the top of the sector list. The Real Estate sector is a place investors can protect against inflation. Consumer Discretionary got a boost from Tesla, which rose with other renewable energy stocks on fears of an oil crisis. Technology (XLK -0.52%) and Communications (XLC -0.93%) were at the bottom of the sector list, brought down by big tech stocks.
JOLTs Job Openings were at 10.4 million, lower than the forecast of 10.9 million. Fed members reiterated that the central bank is on track to start bond tapering next month.
The US Dollar strengthened, with the index (DXY) gaining +0.16% on higher demand. US 30y, 10y, and 2y yields all declined for the day. High Yield (HYG) and Investment Grade (LQD) Corporate Bond Prices bounced up after several days of sharp declines. Crude Oil Futures declined a bit but are still near all-time highs. Aluminum Futures are also near all-time highs after a massive gain on Monday.
The put/call ratio (PCCE) fell to 0.581. The CNN Fear & Greed index remained in the middle of the Fear range.
Of the four largest mega-caps, only Amazon (AMZN) held onto a gain for the day, advancing +0.03%. Apple (AAPL) declined -0.91% after Bloomberg reported the company would slash iPhone 13 production due to the chip crunch. Alphabet (GOOGL) fell -1.77%, taking the Communications sector lower.
There are more declining stocks than advancing stocks in the mega-cap list. The top-performing mega-cap for the day was Nike (NKE). At the bottom of the mega-cap list is Intel (INTC).
The daily update growth list has more advancing stocks than declining stocks. Renewable energy stocks topped the list, with Solar Edge (SEDG) and Enphase (ENPH) advancing +7.80% and +5.32%. Etsy (ETSY) also exceeded a 5% gain, rising +5.34%. Robinhood (HOOD), UP Fintech (TIGR), and FUTU Holding (FUTU) were at the bottom of the growth list, all declining more than -3%.
-=x=-=x=-=x=-=x=-=x=-=x=-=x=-
Looking ahead
A look at inflation comes in two forms on Wednesday. First, the OPEC monthly report will show how oil producers respond to shortages as demand spikes and supply chains choke. Second, Consumer Price Index data will be available before the market opens.
Later in the day, investors will closely look at the Fed's minutes from their most recent meeting, looking for more clues on a tightening of monetary policy.
Tomorrow's market will also open with the first significant earnings reports for this quarter. JP Morgan (JPM), BlackRock (BLK), Wipro (WIT), Delta Air Lines (DAL) all report earnings before the market opens.
-=x=-=x=-=x=-=x=-=x=-=x=-=x=-
Trends, Support, and Resistance
The Nasdaq attempted to rise above the 14,500 area three times today but did not get support and closed below the line.
If the index rejoins the five-day trend line, that will mean a +0.75% gain for Wednesday.
The one-day trend line points to a lateral move of a +0.03% gain.
The trend line from the 9/7 high ends with a -0.94% decline for tomorrow.
-=x=-=x=-=x=-=x=-=x=-=x=-=x=-
Wrap-up
Fears around the impact of inflation amongst higher oil prices and tighter monetary policy, while employment growth is slowing, are now turning investors' worries toward stagflation. As employment growth stalls, wages remain stagnant or decline while the prices of goods rise. After the JOLTs job openings report today showed fewer than expected jobs, the inflation numbers become even more critical tomorrow.
The expectation is for sideways or lower tomorrow.
Stay healthy and trade safe!

Market Pulse.. today $ making movers Hi Volatility stocks trading 15 min
Market Posture
SPX
NDX
RUT
HI VOL
GOOGL
AMZN
TSLA
ISRG
MSTR
SHOP
NFLX
ROKU
NVDA
MELI
AAPL
OIH

RUT is kind of cornered pretty tight, 3 symmetric triangles !What Is a Triangle?
A triangle is a chart pattern, depicted by drawing trendlines along a converging price range, that connotes a pause in the prevailing trend. Technical analysts categorize triangles as continuation patterns.
KEY TAKEAWAYS
In technical analysis, a triangle is a continuation pattern on a chart that forms a triangle-like shape.
Triangles are similar to wedges and pennants and can be either a continuation pattern, if validated, or a powerful reversal pattern, in the event of failure.
There are three potential triangle variations that can develop as price action carves out a holding pattern, namely ascending, descending, and symmetrical triangles.
Type of Triangles
1/ Ascending Triangle: An ascending triangle is a breakout pattern that forms when the price breaches the upper horizontal trendline with rising volume. It is a bullish formation. The upper trendline must be horizontal, indicating nearly identical highs, which form a resistance level. The lower trendline is rising diagonally, indicating higher lows as buyers patiently step up their bids. Eventually, the buyers lose patience and rush into the security above the resistance price, which triggers more buying as the uptrend resumes. The upper trendline, which was formerly a resistance level, now becomes support.
2/ Descending Triangle: A descending triangle is an inverted version of the ascending triangle and considered a breakdown pattern. The lower trendline should be horizontal, connecting near identical lows. The upper trendline declines diagonally toward the apex. The breakdown occurs when the price collapses through the lower horizontal trendline support as a downtrend resumes. The lower trendline, which was support, now becomes resistance.
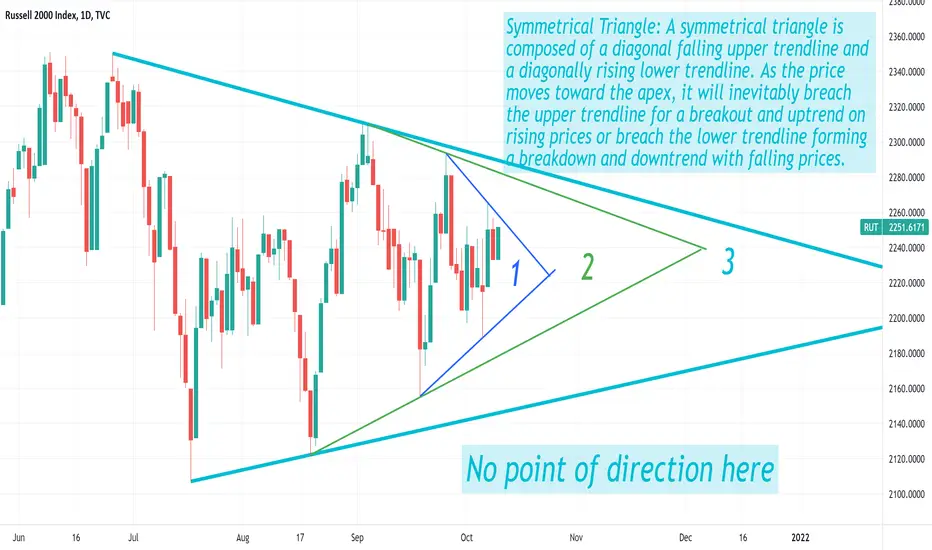
3/ Symmetrical Triangle: A symmetrical triangle is composed of a diagonal falling upper trendline and a diagonally rising lower trendline. As the price moves toward the apex, it will inevitably breach the upper trendline for a breakout and uptrend on rising prices or breach the lower trendline forming a breakdown and downtrend with falling prices.Traders should watch for a volume spike and at least two closes beyond the trendline to confirm the break is valid and not a head fake. Symmetrical triangles tend to be continuation break patterns, meaning that they tend to break in the direction of the initial move before the triangle formed. For example, if an uptrend precedes a symmetrical triangle, traders would expect the price to break to the upside.
Daily Market Update for 10/8Summary: Markets moved lower after payrolls data missed expectations. Energy stocks led the day following Crude Oil Futures higher, while Financial stocks did well on rising interest rates.
Notes
Ideas always welcome in the comments. Errors will be amended as comments on TradingView or corrected inline in my blog.
-=x=-=x=-=x=-=x=-=x=-=x=-=x=-
Friday, October 8, 2021
Facts: -0.51%, Volume lower, Closing Range: 8%, Body: 88% Red
Good: Decline on lower volume, stayed above 14,500 support area
Bad: Lower high, lower low, selling most of day
Highs/Lows: Lower high, Lower low
Candle: Mostly red body, with tiny upper and lower wicks
Advance/Decline: 0.49, two declining stocks for every advancing stock
Indexes: SPX (-0.19%), DJI (-0.03%), RUT (-0.76%), VIX (-3.94%)
Sector List: Energy (XLE +3.08%) and Financials (XLF +0.49%) at the top. Utilities (XLU -0.74%) and Real Estate (XLRE -1.09%) at the bottom.
Expectation: Sideways
-=x=-=x=-=x=-=x=-=x=-=x=-=x=-
Market Overview
Markets moved lower after payrolls data missed expectations. Energy stocks led the day following Crude Oil Futures higher, while Financial stocks did well on rising interest rates.
The Nasdaq lost -0.51% for the day. Volume was lower than the previous day. The candle is almost entirely red body, with tiny upper and lower wicks. The 88% Red body is above an awful 8% closing range. There were two declining stocks for every advancing stock.
The Dow Jones Industrial Average (DJI) lost only -0.03% for the day while leading the major indexes in gains for the week. The S&P 500 (SPX) declined -0.19%. The Russell 2000 (RUT) was the only index to decline for the week, losing -0.76% today. Despite selling across the market, the VIX Volatility Index declined -3.94%, continuing to fall from its elevated level earlier in the week.
Energy (XLE +3.08%) and Financials (XLF +0.49%) were the only gaining sectors today and performed the best for the week. Energy is rising on higher oil prices while Financials is getting the benefit of higher interest rates. Next week kicks of earnings season for the big banks. Utilities (XLU -0.74%) and Real Estate (XLRE -1.09%) were at the bottom of today's sector list.
The labor market added only 194,000 payrolls in September against a forecast of 500,000. However, the Unemployment Rate dropped to 4.8%, while analysts expected 5.1%. Average Hourly Earnings grew faster than expected.
The US Dollar weakened for the day, with the dollar index (DXY) declining -0.10%. US Treasury yields rose for another day. High Yield (HYG) and Investment Grade (LQD) Corporate Bond prices continue to fall along with Treasury prices (prices fall, yields rise). Crude Oil Futures soared back to record highs. Timber fell, but Copper and Aluminum rose.
The put/call ratio fell to 0.734. The CNN Fear & Greed Index remains in the middle of the fear range. The NAAIM money manager exposure index climbed to 68.6 after declining to 55.02 the previous week.
Of the four largest mega-caps, only Alphabet (GOOGL) gained today, closing above its 50d moving average line. Microsoft (MSFT) closed flat after climbing mid-day. Alibaba (BABA) topped the mega-cap list again with a +3.54% gain. Exxon Mobile (XOM) and Chevron (CVX) were also in the top four, carrying the Energy sector higher.
Upwork (UPWK) was the top performer in the daily update growth list. The list contains mostly decliners today, with MongoDB (MDB) dropping the most at -5.05%.
-=x=-=x=-=x=-=x=-=x=-=x=-=x=-
Looking ahead
There are no significant economic events scheduled for Monday. Next week will kick-off earnings season for big banks, but none are on the schedule for Monday.
-=x=-=x=-=x=-=x=-=x=-=x=-=x=-
Trends, Support, and Resistance
The Nasdaq steadily declined from the 21d EMA throughout the day but closed above the 14,500 support area.
The five-day trend line points to a +1.64% gain for Monday.
The one-day trend line ends with a -0.38% decline.
The trend line from the 9/7 high points to a -1.60% loss to start the week.
-=x=-=x=-=x=-=x=-=x=-=x=-=x=-
Wrap-up
It doesn't take much to cause declines in this skittish market. The lack of new payrolls, while the unemployment rate dropped in September, is a head-scratcher. Add that to the research list for this weekend.
The expectation for Monday is sideways.
Stay healthy and trade safe!

Head And Shoulders Part #4Follow up of Head and Shoulders development
Look for Key levels and news. We need positive news to go up...
Risk on into the weekend? Possible.

Daily Market Update for 10/7Summary: A deal over raising the debt-ceiling eased investor worries and sent markets higher on Thursday. The rally included broad gains across the market, with small caps and growth stocks leading the way.
Notes
Ideas always welcome in the comments. Errors will be amended as comments on TradingView or corrected inline in my blog.
-=x=-=x=-=x=-=x=-=x=-=x=-=x=-
Thursday, October 7, 2021
Facts: +1.05%, Volume lower, Closing Range: 59% (w/gap), Body: 16% Green
Good: Gap up at open and rally in morning, high advance/decline ratio
Bad: Resistance at 21d EMA, lost momentum in afternoon
Highs/Lows: Higher high, Higher low
Candle: Thin green body at bottom of the candle after a gap up
Advance/Decline: 1.8, almost two advancing for every declining stock
Indexes: SPX (+0.83%), DJI (+0.98%), RUT (+1.59%), VIX (-6.95%)
Sector List: Consumer Discretionary (XLY +1.56%) and Health (XLV +1.33%) at the top. Real Estate (XLRE +0.11%) and Utilities (XLU -0.53%) at the bottom.
Expectation: Sideways or Higher
-=x=-=x=-=x=-=x=-=x=-=x=-=x=-
Market Overview
A deal over raising the debt-ceiling eased investor worries and sent markets higher on Thursday. The rally included broad gains across the market, with small caps and growth stocks leading the way.
The Nasdaq ended the day with a +1.05%. After a gap-up at open, the morning rally led to a +1.75% advance. The advance met resistance at the 21d EMA and fell back from the intraday high. The candle has a thin 16% green body resting under a long upper wick. The closing range is 59%, including the gap at open. Almost two stocks advanced for every declining stock.
Small-caps did very well, advancing the Russell 2000 (RUT) +1.59% for the day. The Dow Jones Industrial Average (DJI) gained +0.98%, and the S&P 500 (SPX) was up +0.83%. The VIX Volatility Index (VIX) declined -6.95%.
Ten of the eleven SPDR sectors advanced today. Consumer Discretionary (XLY +1.56%) and Health (XLV +1.33%) were at the top. The defensive sectors of Real Estate (XLRE +0.11%) and Utilities (XLU -0.53%) were at the bottom of the sector list.
Initial Jobless Claims came in at 326,000 against an expectation of 348,000. The recovery for the labor market seems to be back on track.
The US Dollar index (DXY) rose +0.27%. Treasury Yields rose as well, climbing in the afternoon, which may explain the fallback from intraday highs in the Nasdaq. High Yield (HYG) Corporate Bond prices ticked slightly higher while Investment Grade (LQD) Corporate Bond prices moved lower. Timber, Copper, and Aluminum all rose or the day.
The put/call ratio dropped to 0.739 after hitting its highest point in a year yesterday. The CNN Fear & Greed index is still in Fear but moved further toward Neutral. The NAAIM money manager exposure index climbed to 68.6 after declining to 55.02 the previous week.
All four largest mega-caps gained for the day. Alphabet (GOOGL) joined Microsoft (MSFT) in moving above its 21d EMA, and Microsoft (MSFT) closed above its 50d MA. Alibaba (BABA) topped the mega-cap list with a +8.26% gain. Investors are hoping a meeting between Biden and Xi will ease US-China tensions. Only a handful of mega-caps declined today, with Facebook (FB) sitting at the bottom of the list.
Chinese stocks dominated the top of the Daily Update Growth List. Alibaba (BABA), NIO (NIO), UP Fintech (TIGR), and JD.com (JD) were the top four. Like the mega-cap list, only five stocks declined for the day, with Facebook (FB) being the worst performer.
-=x=-=x=-=x=-=x=-=x=-=x=-=x=-
Looking ahead
Additional employment data will be available on Friday. The data will include Hourly Earnings, Nonfarm Payrolls, Employment Change, and the Unemployment rate.
-=x=-=x=-=x=-=x=-=x=-=x=-=x=-
Trends, Support, and Resistance
The Nasdaq blasted through the 14,500 resistance area and climbed to meet resistance at its 21d EMA line.
The one-day and five-day trend lines are moving in opposite directions but meet up at a +0.10% gain for Friday.
If the rally loses steam and the index returns to the trend line from the 9/7 top, that would mean a -2.11% gain for tomorrow.
-=x=-=x=-=x=-=x=-=x=-=x=-=x=-
Wrap-up
This year, we've endured multiple cases of pending doom turned into optimistic rallies when the worries ease. Supply chain woes, Inflation, Interest Rates, Employment, the Debt-ceiling are just a few of the big ones that we've pushed through.
Given the resistance at the 21d EMA, perhaps tomorrow will be Sideways. Otherwise, I'd expect Higher unless something looks wrong in the employment data.
Stay healthy and trade safe!

Market Pulse How I made MONEY today Money Makers today
Potential Setups
Hi Volatility stocks trading 15 min
Market Posture
SPX
NDX
RUT
HI VOL
GOOGL
AMZN
TSLA
ISRG
CMG

Daily Market Update for 10/6Summary: Markets rebounded from early morning losses after a deal to lift the debt ceiling until December made investors more optimistic. Defensive sectors led the day, indicating some nervousness still exists in the market.
Notes
Ideas always welcome in the comments. Errors will be amended as comments on TradingView or corrected inline in my blog.
-=x=-=x=-=x=-=x=-=x=-=x=-=x=-
Wednesday, October 06, 2021
Facts: +0.47%, Volume higher, Closing Range: 97%, Body: 85% Green
Good: Higher high, thick green body, high closing range
Bad: Lower low, advance/decline ratio
Highs/Lows: Higher high, Lower low
Candle: Bullish engulfing candle, Mostly green body with a small lower wick
Advance/Decline: 0.46, two declining stocks for every advancing stock
Indexes: SPX (+0.41%), DJI (+0.30%), RUT (-0.60%), VIX (-1.41%)
Sector List: Utilities (XLU +1.55%) and Consumer Staples (XLP +0.97%) at the top. Materials (XLB -0.19%) and Energy (XLE -1.05%) at the bottom.
Expectation:
-=x=-=x=-=x=-=x=-=x=-=x=-=x=-
Market Overview
Markets rebounded from early morning losses after a deal to lift the debt ceiling until December made investors more optimistic. Defensive sectors led the day, indicating some nervousness still exists in the market.
The Nasdaq ended the day with a +0.47% gain. Volume was higher than the previous day. The 97% closing range came at the end of a bullish afternoon, creating a candle with an 85% green body. The lower wick is short, while the upper wick is almost invisible. There were two declining stocks for every advancing stock.
The S&P 500 (SPX) gained +0.41%, and the Dow Jones Industrial Average (DJI) gained +0.30%. Small-caps could not fully recover from the morning losses, and the Russell 2000 (RUT) closed with a -0.60% decline. The VIX Volatility Index (VIX) remained elevated despite a -1.41% decline today.
Defensive sectors topped the sector list with Utilities (XLU +1.55%) and Consumer Staples (XLP +0.97%) leading the way up. Eight of the eleven SPDR sectors gained for the day. Materials (XLB -0.19%) and Energy (XLE -1.05%) are at the bottom of the list.
ADP Nonfarm Employment Change came in higher than expected, providing a positive outlook for the labor market. Crude Oil Inventories showed less demand than forecast. Today, US Republican Senator Mitch McConnell revealed that Republicans could agree to a short-term lifting of the debt ceiling until December.
The US Dollar Index (DXY) advanced by +0.27% for the day. US 30y and 10y yields started the day with a sharp rise but ended with a slight decline while the 2y yield rose steadily throughout the day. High Yield (HYG) Corporate Bond prices continue to fall. Investment Grade (LQD) Corporate Bond prices advanced slightly for the day.
Crude Oil Futures pulled back from record highs after inventories were higher than expected. Timber, Copper, Aluminum all declined.
The put/call ratio soared to its highest intraday level in a year but came back down to end the day at 0.919. The high ratio shows a bearish sentiment in investors. The CNN Fear & Greed index moved further into the Fear range from Extreme Fear earlier this week.
All four largest mega-caps gained today. Microsoft (MSFT) overtook its 21d EMA again with a +1.51% gain. PepsiCo (PEP) was the best mega-cap of the day after pleasing investors with an earnings beat and improved outlook for this year. Toyota Motor (TM ) was at the bottom of the mega-cap list with a -3% decline.
The stocks in the Daily Update Growth List had another positive day. CloudFlare (NET) topped the list for a second day, gaining 15% over the two days. Ehang Holdings (EH) was at the bottom of the list.
www.tradingview.com
-=x=-=x=-=x=-=x=-=x=-=x=-=x=-
Looking ahead
Initial Jobless Claims data will be available before the market opens on Thursday.
-=x=-=x=-=x=-=x=-=x=-=x=-=x=-
Trends, Support, and Resistance
The Nasdaq closed at the 14,500 resistance area after the morning dip turned into an afternoon rally.
The one-day trend line points to a +1.01% gain for Thursday.
The trend line from the 9/7 high and the five-day trend line end with a -1.16% gain.
-=x=-=x=-=x=-=x=-=x=-=x=-=x=-
Wrap-up
The willingness of Republicans to temporarily extend the debt ceiling until December is a positive for wary investors who were positioning for the worst. It's still not a done deal and also just pushes the deadline out for two months. But in the meantime, it shows the Republicans don't want to force the issue to catastrophe.
Based on the bullish engulfing candle and the move higher on higher volume, the expectation is for Sideways or Higher. There would be more conviction in a move higher if the advance/decline ratio showed more gains broadly across the market.
Stay healthy and trade safe!

OCT 6 MARKET PULSEHi Volatility stocks trading 15 min
Market Posture
SPX
NDX
RUT
HI VOL
GOOGL
AMZN
TSLA
ISRG
CMG

Daily Market Update for 10/5Summary: Stocks bounced higher following days of selling in big tech and growth stocks. While economic indicators are looking positive, fears still loom over the debt ceiling debate in Washington.
Notes
Ideas always welcome in the comments. Errors will be amended as comments on TradingView or corrected inline in my blog.
-=x=-=x=-=x=-=x=-=x=-=x=-=x=-
Tuesday, October 05, 2021
Facts: +1.25%, Volume lower, Closing Range: 64%, Body: 58% Green
Good: Higher high, higher low
Bad: Later afternoon fade from intraday high
Highs/Lows: Higher high, Higher low
Candle: Long upper wick over a green body covering half the candle
Advance/Decline: 1.04, about the same number of advancing and declining stocks
Indexes: SPX (+1.05%), DJI (+0.92%), RUT (+0.49%), VIX (-7.23%)
Sector List: Financials (XLF +1.96%) and Communications (XLC +1.49%) at the top. Utilities (XLU -0.25%) and Real Estate (XLRE -0.78%) at the bottom.
Expectation: Sideways or Higher
-=x=-=x=-=x=-=x=-=x=-=x=-=x=-
Market Overview
Stocks bounced higher following days of selling in big tech and growth stocks. While economic indicators are looking positive, fears still loom over the debt ceiling debate in Washington.
The Nasdaq advanced +1.25% today. Volume was lower than the previous day. The candle has a green body covering the lower half of the range, leaving a long upper wick formed from selling right before close. The body is 58% of the candle, while the closing range is at 64%. There were about the same number of advancing and declining stocks.
The S&P 500 (SPX) gained +1.05% for the day. The Dow Jones Industrial Average (DJI) climbed by +0.92%. The Russell 2000 (RUT) advanced +0.49%. The VIX Volatility Index declined -7.23% but remained elevated.
Financials (XLF +1.96%) and Communications (XLC +1.49%) led the sector list. Only two sectors declined, Utilities (XLU -0.25%) and Real Estate (XLRE -0.78%). Energy (XLE +0.58%) led in the morning, opening with a +2.43% gain before fading to end the day with a +0.58% gain. Technology (XLK +1.43%) was in close third place for the day.
While Trade Balance data was not super positive, domestic measures of the economy in the form of Services and Non-Manufacturing Purchasing activity were higher than expected.
The US Dollar strengthened, with the index (DXY) gaining + 0.19% for the day. US Treasury yields gained for the day but do not seem to be on an out-of-control ascent that we feared late last week. High Yield (HYG) and Investment Grade (LQD) prices declined. Crude Oil Futures continue to soar higher.
The put/call ratio (PCCE) declined to 0.627. The CNN Fear & Greed index moved back into the Fear range after hitting Extreme Fear yesterday.
All four largest mega-caps gained for the day. Microsoft (MSFT) and Alphabet (GOOGL) seem to be forming a base that could take them higher as they attempt to move back above key moving average lines. Netflix (NFLX) was the best mega-cap for the day, gaining over 5% and hitting a new all-time high. Merck (MRK) was the worst-performing mega-cap for the day as investors took profits from recent gains.
CloudFlare (NET) and Digital Turbine (APPS) topped the daily update growth list with +8.52% and +6.06% gains. Most of the stocks on the list did well today. The biggest losers at the bottom of the list were Zoom Video (ZM) and Penn National Gaming (PENN).
PepsiCo (PEP) gained +0.59% for the day after beating expectations and improving their outlook for the year in a pre-market earnings release.
-=x=-=x=-=x=-=x=-=x=-=x=-=x=-
Looking ahead
ADP Nonfarm Employment Change tomorrow morning will show any progress in the labor market recovery. Crude Oil Inventories will be available after the market opens.
A planned vote for tomorrow on raising the debt ceiling is likely to be rejected by Republicans and could cause more volatility in the market.
-=x=-=x=-=x=-=x=-=x=-=x=-=x=-
Trends, Support, and Resistance
The Nasdaq support at 14,200 in yesterday's session turned into gains today before the index met resistance at 14,500.
If the one-day trend line continues into tomorrow, we can expect a +1.16% gain and move above the 14,500 support/resistance area.
The trend line from the 9/7 high points to a -0.47% decline for Wednesday.
The five-day trend line ends in a -0.99% decline.
-=x=-=x=-=x=-=x=-=x=-=x=-=x=-
Wrap-up
The debt ceiling vote tomorrow seems already decided, with Republicans publicly rejecting the measure. Nonetheless, the drama playing out in Washington will cause volatility in the market. Based on the chart, the expectation is Sideways or Higher but prepare for a wild ride.
Stay healthy and trade safe!

Mid-Day Pulse Money Makers Hi Volatility stocks trading 15 min..
All road lead back to 50
Market Posture
SPX
NDX
RUT
VIX
HI VOL
Googl
Amzn
Tsla
Isrg
Cmg

Daily Market Update for 10/4Summary: Rising Treasury Yields in the morning had investors exiting positions in Big Tech and Growth stocks, sending indexes lower for another day. However, OPEC held its position on a gradual increase in output despite an energy crunch, and they are still predicting higher demand in the coming months.
Notes
Ideas always welcome in the comments. Errors will be amended as comments on TradingView or corrected inline in my blog.
-=x=-=x=-=x=-=x=-=x=-=x=-=x=-
Monday, October 04, 2021
Facts: -2.14%, Volume lower, Closing Range: 23%, Body: 75% Red
Good: Nothing
Bad: Large decline, low advance/decline ratio, low closing range
Highs/Lows: Lower high, Lower low
Candle: Mostly red body with tiny upper wick, longer lower wick
Advance/Decline: 0.29, three declining stocks for every advancing stock
Indexes: SPX (-1.30%), DJI (-0.94%), RUT (-1.08%), VIX (+8.82%)
Sector List: Energy (XLE +1.63%) and Utilities (XLU +1.38%) at the top. Communications (XLC -2.16%) and Technology (XLK -2.32%) at the bottom.
Expectation: Sideways or Lower
-=x=-=x=-=x=-=x=-=x=-=x=-=x=-
Market Overview
Rising Treasury Yields in the morning had investors exiting positions in Big Tech and Growth stocks, sending indexes lower for another day. However, OPEC held its position on a gradual increase in output despite an energy crunch, and they are still predicting higher demand in the coming months.
The Nasdaq closed the day with a -2.14% decline. The selling started right at the market open and continued through the morning, creating a large red body covering 75% of the candle. The lower wick formed from a slight gain in the afternoon. The closing range was 23%. There were more than three declining stocks for every advancing stock.
The Dow Jones Industrial Average (DJI) fared better, only losing -0.94% for the day as the Energy sector helped the index. The S&P 500 (SPX) declined -1.30%. The small-cap Russell 2000 (RUT) lost -1.08%. The VIX Volatility Index rose +8.56% for the day.
Energy (XLE +1.63%) topped the sector list thanks to Monday morning's OPEC meeting news. The only other two sectors to gain for the day were Utilities (XLU +1.38%) and Real Estate (XLRE +0.11%), both defensive sectors. Two growth sectors, Communications (XLC -2.16%) and Technology (XLK -2.32%) were at the bottom of the sector list.
OPEC decided to hold output at current levels, predicting higher demand in the next several months. Factory Orders data released in the morning showed 1.2% month-over-month growth compared to the forecast of 1.0%.
The US dollar index (DXY) declined -0.29%. US Treasury Yields were up for the day but settled back from a morning spike that panicked investors. High Yield (HYG) Corporate Bond prices were down sharply. Investment Grade (LQD) Corporate Bond prices also fell for the day.
Crude Oil Futures was up +3.72% today. Copper and Aluminum futures also gained on the day, likely because of the higher-than-expected Factory Orders data.
The put/call ratio (PCCE) rose to 0.759. The CNN Fear & Greed Index dropped back into Extreme Fear.
All four of the largest mega-caps had significant declines for the day. Microsoft (MSFT) and Alphabet (GOOGL) seem to be getting some support at their current level, while Apple (AAPL) and Amazon (AMZN) are still in free-fall. Merck (MRK) was the top mega-cap for the day, followed by Exxon Mobil (XOM). At the bottom of the mega-cap list was Facebook (FB), which dealt with a multi-hour outage across its large social platforms.
Only two stocks in the Daily Update Growth List advanced for the day. Tesla (TSLA) and CloudFlare (NET) ended the day with gains. The worst stocks on the list were Ehang Holdings (EH), Fastly (FSLY), and FUTU Holding (FUTU), all with more than 7% declines.
-=x=-=x=-=x=-=x=-=x=-=x=-=x=-
Looking ahead
Trade Balance data will be available Tuesday morning before the market opens, and the Non-Manufacturing PMI data will come after the opening bell.
PepsiCo (PEP) releases earnings before the market open.
-=x=-=x=-=x=-=x=-=x=-=x=-=x=-
Trends, Support, and Resistance
The Nasdaq found support at a previous support/resistance level of 14,200.
If the index can regain the trend-line from the 9/7 high, that will be a +1.04% advance for Tuesday.
The five-day trend line points to a -0.26% decline.
A continuation of today's one-day trend line ends with another -1.23% decline for tomorrow.
-=x=-=x=-=x=-=x=-=x=-=x=-=x=-
Wrap-up
Fear continues to grow over the debt ceiling discussion in Washington while mini-disasters play out worldwide, from the Evergrande challenge in China to the Energy crunch in the UK. Rising yields and higher inflation are bad news for Big Tech and Growth stocks.
The expectation for tomorrow is Sideways or Lower.
Stay healthy and trade safe!

Mid-Day Market Pulse Money makersTrading the Hi Vol stocks on 15 min time frame
SPX
RUT
NDX
GOOGL
AMZN
CMG
ISRG
TSLA

RUT (Russell 2000 ETF) - Resistance, Support, Trend - 09/05/21RUT has been consolidating between $2123.55 and $2348.03, for this year 2021.
Bullish scenario:
-RUT price breaks up above resistances to new all-time-highs.
-Resistance levels: $2348.03, $2392.66.
Bearish scenario:
-RUT price pulls back down to test supports below (horizontal and trendline supports).
-Support levels: $2240, $2123.55, $2060.54.
Note: On the Weekly chart, RUT price has always been consolidating sideways for 2021.
