Daily Market Update for 1/14Trend lines drawn from the 10/30 bottom (52d), 1/8 (5d) and today 1/14 (1d).
Ideas always welcome in the comments. Errors will be amended as comments on TradingView or and corrected inline in my blog.
I'm working to condense this daily update over the next few weeks. I need to reduce it for both brevity and preparation time.
-=x=-=x=-=x=-=x=-=x=-=x=-=x=-
Thursday, January 14, 2021
Facts: -0.12%, Volume lower, Closing range: 12%, Body: 51%
Good: New all-time high, higher low
Bad: Closing range, sell-off to close after morning all-time high
Highs/Lows: Higher high, Higher low
Candle: Thick red body in lower half of the candle, longer upper wick
Advance/Decline: 2.50, five advancing stocks for every two declining stocks.
Indexes: SPX (-0.38%), DJI (-0.22%), RUT (+2.05%), VIX (+4.68%)
Sectors: Energy (XLE +2.96%) and Real Estate (XLRE +0.62%) were top. Consumer Discretionary (XLY -0.64%) and Technology (XLK -0.88%) were bottom.
Expectation: Sideways
-=x=-=x=-=x=-=x=-=x=-=x=-=x=-
Market Overview
Investors shook off bad employment news in the morning to drive indexes to all-time highs before an afternoon session of selling. There were plenty of gains across a breadth of stocks, but the losses in the mega-caps weighed down the major indexes. The exception was the small-cap Russell 2000 which gained +2.05% in a solidly upwards session.
The Nasdaq closed with a -0.12% loss after setting a new all-time high. The closing range of 12% with a large 51% red body is sign of weakness, but volume was lower so would not count as a distribution day. The losses were focused in the larger caps which is why the overall index is down even though there were far more advancing stocks than declining stocks. As we did yesterday, you can also see the imbalance by looking at the QQQ which is down -0.53% while the equal weight QQQE is up +0.12%.
The S&P 500 (SPX) lost -0.38% while the Dow Jones Industrial average (DJI) lost -0.22%. The VIX Volatility index rose +4.68%.
Energy (XLE +2.96%) was the top sector after OPEC released their monthly report with a mix of messages around oil demand and shale output. Real Estate (XLRE +0.62%) was the second best sector. Consumer Discretionary (XLY -0.64%) and Technology (XLK -0.88%) were the worst performing sectors.
-=x=-=x=-=x=-=x=-=x=-=x=-=x=-
Economic Indicators
The US Dollar (DXY) dropped for the day. US Treasury 30y (US30Y), 10y (US10Y) and 2y (US02Y) bond yields all rose for the day as investors expect more stimulus from President-elect Biden. Corporate Bonds (HYG) prices remained about even.
Silver (SILVER) and Gold (GOLD) both gained today and seem to have found an area of support. Crude Oil (CRUDEOIL1!) futures advanced. Timber (WOOD) and Copper (COPPER1!) gained while and Aluminum (ALI1!) all declined for the day.
-=x=-=x=-=x=-=x=-=x=-=x=-=x=-
Investor Sentiment
The put/call ratio took a big dip to 0.474, an extreme level of optimism for investors. The put/call ratio (PCCE) is a contrarian indicator that shows overly bullish or overly bearish investor behavior. The 0.7 level is considered normal. As it approaches 0.60 (overly bullish) and below, watch for a possible pullback in the market.
The CNN Fear & Greed index is on the greed side, but still within reasonable range.
-=x=-=x=-=x=-=x=-=x=-=x=-=x=-
Market Leaders
All four of the biggest mega-caps lost for the day. They have been going back and forth between gains and losses the past several days. Microsoft (MSFT), Amazon (AMZN) and Alphabet (GOOGL) area all trading at or below their 50d MA and 21d EMA. Apple (AAPL) is trading just below the 21d EMA. The question remains on whether the mega-caps will join the market rally on new stimulus, or will they continue to weigh down the major indexes.
Taiwan Semiconductor (TSM) gained 6.06% on strong earnings and the increasing demand coming from the automobile industry. ASML Holding (ASML), Intel (INTC) and Exxon Mobil (XON) were other big mega-cap gainers for the day. Mastercard (M) and Visa (V) were at the bottom of the list losing -5.60% and -3.58% respectively.
Beyond Meat (BYND) was a top growth stock for the day, gaining 13.66%. Fiverr (FVRR), FUTU (FUTU) and SUMO Logic (SUMO) were other big gainers for the day. Twitter (TWTR), SNAP (SNAP) and PINS (PINS) joined other communications sector stocks with losses.
Bed Bath & Beyond (BBBY) joined the short-squeeze mania with a +18.77% gain while Gamespot (GME) continued a second day of short-squeeze gains with a 27.10% gain. That's a 100% gain in two days for the brick-and-mortar game store.
-=x=-=x=-=x=-=x=-=x=-=x=-=x=-
Looking ahead
Producer Price Index data and Retail Sales data will be release before market open on Wednesday. Industrial Production numbers will add to data highlighting current economic activity.
Consumer Sentiment numbers for January will be release just after the market opens.
JP Morgan Chase (JPM), Citigroup (C), Wells Fargo (WFC) and PNC Financial Services (PNC) will report earnings before market opens on Friday.
-=x=-=x=-=x=-=x=-=x=-=x=-=x=-
Trends, Support and Resistance
The long trend line from the 10/30 bottom point to a +1.23% gain. The five day trend line points to a more modest gain of +0.28%.
The one-day trend line points to a -0.36% loss.
If there is further downside, 13,000 seems to be holding up well for the index. The 21d EMA is nearly 2% below the index which should be an area of support if there's a further downside move. The index also held the 12,550 area recently. If it passes that area, the next support area is 12,250.
-=x=-=x=-=x=-=x=-=x=-=x=-=x=-
Wrap-up
The last few days makes it seem like investors don't know what they want. Tuesday we saw rotation out of mega-caps. Yesterday, we saw rotation into mega-caps. And today we see rotation out again. Among the rotations, Energy and Financials continue to lead the sector list for the week while Communications has been at the bottom.
Stay healthy and take care!
RUSSELL 2000

Daily Market Update for 1/13Trend lines drawn from the 10/30 bottom (51d), 1/7 (5d) and today 1/13 (1d).
Ideas always welcome in the comments. Errors will be amended as comments on TradingView or and corrected inline in my blog.
I'm working to condense this daily update over the next few weeks. I need to reduce it for both brevity and preparation time.
-=x=-=x=-=x=-=x=-=x=-=x=-=x=-
Wednesday, January 13, 2021
Facts: +0.43%, Volume lower, Closing range: 65%, Body: 34%
Good: Never revisited morning low, close in upper half of candle
Bad: Nothing, just not exciting
Highs/Lows: Higher high, Higher low
Candle: Medium to small body with longer upper wick than lower wick
Advance/Decline: 0.85, more declining stocks than advancing stocks
Indexes: SPX (+0.04%), DJI (+0.19%), RUT (+1.77%), VIX (-3.11%)
Sectors: Utilities (XLU +1.95%) and Real Estate (XLRE +1.37%) were top. Industrials (XLI -0.86%) and Materials (XLB -1.02%) were bottom.
Expectation: Sideways
-=x=-=x=-=x=-=x=-=x=-=x=-=x=-
Market Overview
It was not a very exciting session for the Nasdaq today, but there were certainly pockets of excitement in parts of the market. The brief climb in the morning for Nasdaq turned to a sideways movement for the rest of the day. The good news is that the index never went back down towards the morning low. However, the gains for mega-caps and some growth stocks were not broadly shared across the market, keeping the index from closing closer to the intraday highs.
The index closed with a +0.43% gain on lower volume. The closing range was 65% with a green body covering 34% of the candle. More stocks declined than advanced on the Nasdaq. Another way to see the influence of the mega caps today is to look at the cap weighted QQQ (+0.68%) vs the equal weight QQQE (-0.01%).
The S&P 500 (SPX) gained +0.23% while the Dow Jones Industrial lost (DJI) -0.10%. The Russell 2000 (RUT) lost -0.75% as money rotated into larger cap stocks today.
Utilities (XLU +1.95%) and Real Estate (XLRE +1.37%) were the top sectors. Often these sectors are at the top when investors get a bit nervous, but don't want to exit the equities market. The worst performing sectors were Utilities (XLU +1.95%) and Real Estate (XLRE +1.37%).
-=x=-=x=-=x=-=x=-=x=-=x=-=x=-
Economic Indicators
The US Dollar (DXY) rose for the day. Likewise, US Treasury 30y (US30Y), 10y (US10Y) bond yields continued to pull back from recent gains. Corporate Bonds (HYG) prices gained for a second day.
Silver (SILVER) and Gold (GOLD) both dropped today, but have seemed to hit a support area after the declines last week. Crude Oil (CRUDEOIL1!) pulled back just a bit. Timber (WOOD), Copper (COPPER1!) and Aluminum (ALI1!) all declined for the day.
-=x=-=x=-=x=-=x=-=x=-=x=-=x=-
Investor Sentiment
The put/call ratio rose considerably to 0.738, a move toward bearish sentiment. The put/call ratio (PCCE) is a contrarian indicator that shows overly bullish or overly bearish investor behavior. The 0.7 level is considered normal. As it approaches 0.60 (overly bullish) and below, watch for a possible pullback in the market.
-=x=-=x=-=x=-=x=-=x=-=x=-=x=-
Market Leaders
All four of the biggest mega-caps gained for the day. Microsoft (MSFT), Amazon (AMZN) and Alphabet (GOOGL) area all trading at or below their 50d MA. Apple (AAPL) is trading above both the key moving averages that I track which are 21d EMA and 50d MA. In recent memory, having the mega-caps participate in a sustained rally was critical. Bulls will be looking for these four to continue gains.
Intel (INTC) topped the mega-cap high performers after announcing a new CEO. Alibaba (BABA), PayPal (PYPL) and Netflix (NFLX) round out the top four performing mega-caps for the day. The majority of mega-caps gained for the day.
Many mid-cap Growth stocks did well. Peloton (PTON) gained +7.29% on analyst upgrades. Chewy (CHWY) gained +7.98%. Chewy co-founder Ryan Cohen was among three activist investors added to Gamestop (GME) which gained 57.39% in a massive short-squeeze fueled by the news.
-=x=-=x=-=x=-=x=-=x=-=x=-=x=-
Looking ahead
Before market opens on Thursday, Export/Import price index data for December will be released. Initial Jobless Claims will also be announced with the expectation that it's slightly lower than previous weeks.
In the early afternoon, Jerome Powell will speak. His comments can impact Treasury Bonds and the value of the US Dollar. In turn, those impacts will be translated into equity market moves.
Taiwan Semiconductor (TSM), Delta Air Lines (DAL), Blackrock (BLK) will announce earnings before market opens. All three will be initial looks into performance of influential stocks in their respective industry groups.
-=x=-=x=-=x=-=x=-=x=-=x=-=x=-
Trends, Support and Resistance
The long trend line from the 10/30 bottom point to a +0.89% gain.
The five day trend line points to a +0.09% gain, while the one-day trend is in-between the other two pointing to a +0.60% gain.
On the downside, 13,000 seems to be holding up well for the index. The 21d EMA is nearly 2.5% below the index which should be an area of support if there's a further downside move. The index also held the 12,550 area recently. If it passes that area, the next support area is 12,250.
-=x=-=x=-=x=-=x=-=x=-=x=-=x=-
Wrap-up
A bit of rotation and a bit of nervousness was mixed into today's session. The movement back into mega-caps and mid-cap growth stocks was apparent. But nervousness showed itself with Utilities and Real Estate topping the sector list. Corporate bonds were bought on confidence while Treasury bonds were bought on caution. The Put/Call ratio rose above 0.700 for the first time since early December.
Some caution can be constructive for building a base of support in the market. It does not signal a need to be overly defensive, but certainly offers a chance to double check your plan for multiple possibilities as we head into the last two days of the trading week.
Expect some more caution heading into the three-day weekend before inauguration day.
Stay healthy and take care!

RTY MFI OverboughtNQ oversold, RTY overbought. Looks like more whipsaw, lol, possible sector rotation again.

Daily Market Update for 1/12Trend lines drawn from the 10/30 bottom (50d), 1/6 (5d) and today 1/12 (1d).
Ideas always welcome in the comments. Errors will be amended as comments on TradingView or and corrected inline in my blog.
I'm working to condense this daily update over the next few weeks. I need to reduce it for both brevity and preparation time.
-=x=-=x=-=x=-=x=-=x=-=x=-=x=-
Tuesday, January 12, 2021
Facts: +0.28%, Volume higher, Closing range: 77%, Body: 7%
Good: Close in upper side of range, dipped just briefly below 13,000
Bad: Thin body, second indecisive day, LH/LL
Highs/Lows: Lower high, lower low
Candle: An indecisive candle with close just above open, long lower shadow
Advance/Decline: 2.23, more than two advancing for every declining stock
Indexes: SPX (+0.04%), DJI (+0.19%), RUT (+1.77%), VIX (-3.11%)
Sectors: Energy (XLE +3.49%) and Consumer Discretionary (XLY +1.53%) were top. Communications (XLC -1.61%) and Health Services (XLV -1.09%)
Expectation: Sideways
-=x=-=x=-=x=-=x=-=x=-=x=-=x=-
Market Overview
If you are invested in growth stocks and small caps you are probably delighted, but it may be a bit confusing to look at the indexes. The growth and small cap segments did exceptionally well, but the major indexes show an indecisive day. The Nasdaq dipped mid-day but finished just above its open.
The index closed up +0.28% on higher volume. The closing range of 77% is a positive, but the 7% body displays the indecisiveness. However, the advance/decline number of 2.23 shows a much more bullish picture, raising questions whether the broader market can continue to advance without the bigger players advancing.
Another way to see the power of the small-caps is the Russell 2000 (RUT) index that soared above the other indexes with a +1.77% gain and a fat green candle with no lower wick and a tiny upper wick. The S&P 500 (SPX) and Dow Jones Industrial (DJI) had smaller gains than the Nasdaq, all show indecisive candles.
Energy (XLE +3.49%) and Consumer Discretionary (XLY +1.53%) were the top sectors of the day. Communications (XLC -1.61%) and Health Services (XLV -1.09%) were at the bottom.
-=x=-=x=-=x=-=x=-=x=-=x=-=x=-
Economic Indicators
The US Dollar (DXY) declined for the day after several days of gains. Likewise, US Treasury 30y (US30Y), 10y (US10Y) bond yields pulled back from recent gains. Corporate Bonds (HYG) prices gained slightly for the day.
Silver (SILVER) and Gold (GOLD) both gained today, after their declines since the start of the new year. Crude Oil (CRUDEOIL1!) advanced for another day. Timber (WOOD), Copper (COPPER1!) and Aluminum (ALI1!) all advanced for the day.
-=x=-=x=-=x=-=x=-=x=-=x=-=x=-
Investor Sentiment
The put/call ratio declined to 0.542 as investor optimism remains very bullish. The put/call ratio (PCCE) is a contrarian indicator that shows overly bullish or overly bearish investor behavior. The 0.7 level is considered normal. As it approaches 0.60 (overly bullish) and below, watch for a possible pullback in the market.
-=x=-=x=-=x=-=x=-=x=-=x=-=x=-
Market Leaders
Of the four biggest mega-caps, only Amazon (AMZN) advanced for the day, but still set a lower high and a lower low. Apple (AAPL), Microsoft (MSFT), Alphabet (GOOGL) all declined. Only Apple remains above the 50d MA while the others are below the key 21d EMA and 50d MA. The big question for the big mega-caps is can the broader market rally without them.
Tesla (TSLA) regained some of the previous day's losses. Intel (INTC), Exxon Mobile (XOM) and Home Depot (HD) round out the top four performing mega-caps. But overall, six of the largest 10 mega-caps delivered losses for the day. Very different than the broader market.
Growth stocks were very strong for the day. Top stocks included FUTU Holdings (FUTU +15.27%), Etsy (ETSY +12.08%), Fiverr (FVRR +9.33%) and SUMO Logic (SUMO +9.31%).
Twitter (TWTR -2.24%) and Facebook (FB -2.24%) continue to suffer from the past week's events.
-=x=-=x=-=x=-=x=-=x=-=x=-=x=-
Looking ahead
Consumer price index data will be released tomorrow, giving a view on inflation. After today's remarks from Esther George on the possibility of surprise inflation, investors will be watching these numbers closely.
Crude Oil inventories will also be updated tomorrow after market open.
No notable earnings reports for this update are scheduled for Wednesday.
-=x=-=x=-=x=-=x=-=x=-=x=-=x=-
Trends, Support and Resistance
The five-day trend and long trend line from the 10/30 bottom point to a +1.06% gain.
The one-day trend points to a -0.17% loss.
The 21d EMA is about 2% below the index which should be an area of support if there's further downside. The index also held the 12,550 area recently. If it passes that area, the next support area is 12,250.
-=x=-=x=-=x=-=x=-=x=-=x=-=x=-
Wrap-up
Today the small-caps and growth stocks shined. The major indexes didn't show it as large-cap and mega-caps held back the Nasdaq and S&P 500. The question is whether the Russell 2000 and small-caps can continue to rally without the big players advancing too.
Stay healthy and take care!

Small Caps are not OverboughtWhile small caps have been one of the best performers lately, they are still far from being overstretched on a relative performance basis . Reopening of the economy in the 1H of 2020 can reaccelerate the outperformance of the cyclical components while stocks that have been leading during coronavirus will lag behind.

Daily Market Update for 1/11Trend lines drawn from the 10/30 bottom (49d), 1/5 (5d) and today 1/11 (1d).
Ideas always welcome in the comments. Errors will be amended as comments on TradingView or and corrected inline in my blog.
I'm working to condense this daily update over the next few weeks. I need to reduce it for both brevity and preparation time.
-=x=-=x=-=x=-=x=-=x=-=x=-=x=-
Monday, January 11, 2021
Facts: -1.25%, Volume lower, Closing range: 27%, Body: 9%
Good: Lower volume, stayed above 13k
Bad: Morning gains turn to a new intraday low before close
Highs/Lows: Lower high, lower low
Candle: Bearish inside day, thing body at bottom of candle
Advance/Decline: 0.83, more declining than advancing
Indexes: SPX (-0.66%), DJI (-0.29%), RUT (-0.03%), VIX (+11.69%)
Sectors: Energy (XLE +1.57%) and Health Services (XLV +0.47%) were top. Communications (XLC -1.78%) and Consumer Discretionary (XLY -1.87%) were bottom.
Expectation: Sideways or Lower
-=x=-=x=-=x=-=x=-=x=-=x=-=x=-
Market Overview
It was tough to have any expectation coming into today's trading session. Nervousness about what will happen in DC on top of continuing pandemic pressures over the weekend resulted in a low start to the day. Confidence grew as buyers came in but ultimately the bears ruled the day, bringing the index back down to a new intraday low before close.
The index closed with a -1.25% loss on lower volume. The bearish day resulted in a 27% closing range where the close is just under the open. The 9% body and long upper wick show the morning buying turning to afternoon selling. More stocks declined than advanced.
The S&P 500 (SPX) and Dow Jones Industrial (DJI) had similar patterns, but closed the day with smaller losses. The Russell 2000 (RUT) also had a loss but with a more bullish look and the smallest loss of the four indexes. The VIX volatility Index rose +11.69%.
Energy (XLE +1.57%) and Health Services (XLV +0.47%) were the top sectors for the day. Crude Oil prices continuing to rise helped Energy take the top spot after a morning dip. Financials (XLF +0.32%) was the only other sector to gain for the day. Communications (XLC -1.78%) and Consumer Discretionary (XLY -1.87%) were bottom.
-=x=-=x=-=x=-=x=-=x=-=x=-=x=-
Economic Indicators
The US Dollar (DXY) continues to gain at the beginning of this new year. US Treasury 30y (US30Y), 10y (US10Y), and 2y (US02Y) bond yields all gained for the day. Spread on the 10y and 2y is widening while the spread on the 30y and 10y is tightening. Corporate Bonds (HYG) prices dropped for the day, signaling some nervousness from investors.
Silver (SILVER) and Gold (GOLD) both continue to drop. Crude Oil (CRUDEOIL1!) advanced for another day. Timber (WOOD), Copper (COPPER1!) and Aluminum (ALI1!) all dropped for the day.
-=x=-=x=-=x=-=x=-=x=-=x=-=x=-
Investor Sentiment
The put/call ratio rose to 0.603 as investor optimism remains very bullish. The put/call ratio (PCCE) is a contrarian indicator that shows overly bullish or overly bearish investor behavior. The 0.7 level is considered normal. As it approaches 0.60 (overly bullish) and below, watch for a possible pullback in the market.
-=x=-=x=-=x=-=x=-=x=-=x=-=x=-
Market Leaders
The biggest four mega-caps all declined for the day. Apple (AAPL) and Alphabet (GOOGL) remain above the key 21d EMA and 50d MA lines. Microsoft (MSFT) closed below the 21d EMA while Amazon (AMZN) is below both lines. The relative strength of these big mega-caps compared to the market is at low levels. The has been a bearish sign in the past, but may just be representative of the focus on small caps in recent months.
Taiwan Semiconductor (TSM) and Nvidia (NVDA) topped the mega-cap list, giving a pop for semiconductor stocks. The majority of mega-caps were down for the day.
Growth stocks had a mix of results. Grow Generation (GRWG) and Lemonade (LMND) led with 13.77% and 14.01% gains respectively. Chinese EV manufacturer NIO (NIO) gained after releasing their new car model over the weekend. Tesla (TSLA) declined for the first time in 12 sessions, losing -7.82%.
-=x=-=x=-=x=-=x=-=x=-=x=-=x=-
Looking ahead
Economic news tomorrow will include the EIA Short-Term Energy outlook before market open. Several FOMC members will make comments throughout the day. Lots of attention will be paid to the JOLTs Job Openings number to understand how the labor market is doing.
No notable earnings reports for this update are scheduled for Tuesday.
-=x=-=x=-=x=-=x=-=x=-=x=-=x=-
Trends, Support and Resistance
The five-day trend points to a +1.95% gain.
The long trend line from the 10/30 bottom points to a gain of +1.15%.
The one-day trend points to a -0.22% loss.
The 21d EMA is about 2% below the index which should be an area of support if there's further downside. The index also held the 12,550 area recently. If it passes that area, the next support area is 12,250.
-=x=-=x=-=x=-=x=-=x=-=x=-=x=-
Wrap-up
It wasn't a particularly decisive day. The expectation from Friday's action was higher for today, so that expectation was broken and we need to watch closely over the next few days to see what the market wants to do.
Investors remain positive on the possibility of more stimulus, resulting in the higher yields in treasury bonds. But the lowered prices on corporate bonds sends the opposite signal. Small caps continue to outperform heading into the new year.
I'll continue to watch the mega-caps as their relative strength to the rest of the market continues to weaken.
Stay healthy and take care!

Market Week In Review - 1/4/2021 - 1/8/2021The Market Week in Review is my weekend homework where I look over what happened in the previous week and what might come in the next week. It helps me evaluate my observations, recognize new data points, and create a plan for possible scenarios in the future.
I do occasionally have some errors or typos and will correct them in my blog or in the comments on TradingView. I do not have an editor and do this in my free time.
If you find this helpful, please let me know in the comments. I am also more than happy to add new perspectives and data points if you have ideas.
The structure is the following:
A recap of the daily updates that I do here on TradingView.
The Meaning of Life, a view on the past week
What's coming in the next week
The Bullish View, The Bearish View
Key index levels to watch out for
Wrap-up
If you have been following my daily updates, you can skip down to the “The Meaning of Life”. If not, then this first part is a great play-by-play recap for the week. Click the original charts for more detail each day.
-=x=-=x=-=x=-=x=-=x=-=x=-=x=-
Monday, January 4, 2021
Lately things, they don't seem the same
Facts: -1.47%, Volume higher, Closing range: 37%, Body: 63%
Good: Held support around 12,550, some recovery off lows
Bad: Thick red body, no upper wick
Highs/Lows: Higher high, lower low
Candle: Bearish engulfing candle with thick body over long lower wick
Expectation: Sideways or Lower
It was not a great start to 2021 with the equity markets selling off significantly throughout the day after making morning highs. The Nasdaq nearly reach its all-time high before selling off sharply in the morning. Recovery in the afternoon was not nearly enough to be seen as a positive. The index closed down -1.45% with a closing range of 37% and a thick red body of 63%. The higher high and lower low than the previous day represents a bearish engulfing candle that can indicate bearish sentiment in the market. There were more declining stocks than advancing stocks.
-=x=-=x=-=x=-=x=-=x=-=x=-=x=-
Tuesday, January 5, 2021
There must be some kind of way outta here
Facts: +0.95%, Volume higher, Closing range: 94%, Body: 94%
Good: Solid day of gains, no lower wick
Bad: Nothing
Highs/Lows: Lower high, higher low
Candle: Inside day, bullish green body with no lower wick and tiny upper wick
Expectation: Sideways or Higher
The Nasdaq followed yesterday's bearish session with a bullish rebound today. There is still work to do to get back to all-time highs, but the gains were steady throughout the day as the index never revisited the morning low. The index closed the day with a +0.95% gain on higher volume, closing range of 94% and a thick green body of 94%. The lower wick doesn't exist and the upper wick is very tiny. More than two stocks advanced for every declining stock.
-=x=-=x=-=x=-=x=-=x=-=x=-=x=-
Wednesday, January 6, 2021
Bold as Love
Facts: -0.61%, Volume higher, Closing range: 35%, Body: 29%
Good: Stayed above opening low, held support at around yesterday's low
Bad: Sell-off in late afternoon
Highs/Lows: Higher high, lower low
Candle: Inverted hammer that signals buyers held support despite selling pressure
Expectation: Sideways or Higher
It was a wild day for the markets as unbelievable events unfolded in the US capitol. The Georgia run-off elections resulted in Democrats taking control of the Senate, realizing the blue wave that was original anticipated with the November elections. The Nasdaq shook off the initial rotation and rose to gains by mid-afternoon, but would sell-off as rioters stormed the US Capitol in protest of election outcomes. The index closed -0.61% on higher volume with a closing range of 35% and a body of 29%. More stocks advanced than declined.
-=x=-=x=-=x=-=x=-=x=-=x=-=x=-
Thursday, January 7, 2021
Ain't no telling, baby
When you will see me again, but I pray
It will be tomorrow
Facts: +2.56%, Volume lower, Closing range: 90%, Body: 90%
Good: Everything, bullish candle following the inverted hammer
Bad: Nothing
Highs/Lows: Higher high, higher low
Candle: No lower wick, very small upper wick, thick green body
Expectation: Higher
Finally, everything is finalized and seems we can put the tumultuous election behind us. On top of that, jobless claims data was better than expected and economic activity represented by the Purchasing Managers Index was very positive. The markets responded with a huge gain and new all-time highs among the indexes.
The Nasdaq closed with a +2.56% on lower volume, and with a very bullish candle. The closing range of 90% was over a 90% body, resulting in zero lower wick as the index never revisited the low from open. There were nearly three advancing stocks for every declining stock. Over 300 Nasdaq stocks made new highs.
-=x=-=x=-=x=-=x=-=x=-=x=-=x=-
Friday, January 8, 2021
Might even raise a little sand
Facts: +1.03%, Volume higher, Closing range: 96%, Body: 24%
Good: Bulls win the day, despite selling pressure
Bad: Mid-day sell-off
Highs/Lows: Higher high, higher low
Candle: Smallish green body in upper part of candle, long lower wick
Expectation: Higher
It was a wild ride for traders today as a Democratic senator seemed to state he'd block new stimulus and then later say he's still considering his decision. That resulted in a mid-day sell-off and looked like the bears would win, but then the Nasdaq turned and closed at new all-time highs.
The index closed the day with a +1.03% gain on higher volume. The closing range of 96% and 24% green body over a long lower wick represent the mid-day selling pressure that was eventually overcome by the bulls. There were about the same number of advancing stocks as declining stocks. 275 new highs is less than the previous day, but still a very large number.
-=x=-=x=-=x=-=x=-=x=-=x=-=x=-
The Meaning of Life (View on the Week)
The first week of 2021 for the markets was filled with twists and turns but ended with gains across all the major indexes. The Nasdaq ended the week with a +2.43% gain; not a bad start to the year. Volume was higher as investors came back from the holidays. The index has a weekly closing range of 99% with a green body of 36.7% at the top of the candle.
The Russell 2000 (RUT) was back on top of the major indexes, gaining another +5.91% for the week. The S&P 500 gained +1.83% while the Dow Jones Industrial average gained +1.61%. The VIX closed down -5.23% after spiking at the beginning of the week.
The week started on a bearish note as investors came back from the holidays fearing the worst for the pandemic. The UK had announced new lockdowns to control a more contagious mutant of the COVID-19 virus. The index dropped below the 21d EMA, a key indicator line that can show a break down in support. Things recovered in the afternoon, but not nearly enough to look bullish. The VIX volatility index spiked more than 20% before receding.
Tuesday was a positive expectation breaker. There was positive news in the manufacturing purchase data that shows economic activity is picking up. The indexes had bullish inside days.
Wednesday was the pivotal day of the week. The market aside, the day will be written into American history. Although the day was a loss for markets, it would prove pivotal to the upside for the week. We can hope it will also be pivotal to the upside for United States democracy, and most importantly it's citizens.
For the Nasdaq, the day would start with selling as the Georgia run-off elections resulted in Democrats taking control of the senate and a blue wave government was now confirmed. However, investors quickly shrugged off the news and began to buy back discounted tech stocks. That would halt in the afternoon when a siege on the US Capitol hit the news. As rioters broke thru the capitol doors, causing evacuations of politicians and their staff, markets quickly began selling.
It really looked dismal for stocks, but it was worth taking a step back. It could have been a lot worse, and what you see in the candle is an inverted hammer. An inverted hammer signals the selling pressure, but that buyers came in to hold the index above the day's lows. That candle is a signal, but only confirmed if the following days were bullish. And Thursday and Friday brought us the confirmation.
Thursday would be a big day for markets. Brave members of the US Congress, on both sides of the aisle, reconvened late Wednesday and worked through the night to count and confirm the electoral votes. Friday showed there was still a bit of nervousness when one Democratic senator seemed to oppose the stimulus, causing stocks to briefly sell off. However, he corrected his stance later in the day and markets ended the week at new all-time highs.
The weekly chart shows the continued strong momentum in the Nasdaq, despite the pressures on big tech that may come from a Democratic controlled government. The average closing range over the past 10 weeks is 75% as the index has consistently either a higher high or a higher low, both positive signs of support and growth. Volume on positive weeks is much higher than volume on negative weeks. Accumulation continues to outweigh distribution.
Energy ( XLE ) finds itself back at the top of the sector list for the first week of 2021. It's not something you might expect as the blue wave hit US politics. The democratic clean energy platform doesn't bode well for traditional energy stocks. However, crude oil is over $50 a barrel for the first time since April after Saudi Arabia surprisingly cut output.
The blue wave did have some expected sector impact this week. After the Georgia run-off results showed Democrats would take control of the senate, US Treasury Bond yields took off as investors expect more stimulus that would further impact the US Dollar . That caused Financials ( XLF ), especially big banks, to have big gains on Wednesday and Thursday.
Materials ( XLB ) benefited from the blue wave news, as we can expect big investments in US infrastructure with the new administration.
Industrials ( XLI ) also had a boost on Wednesday, with some benefit from infrastructure spend, but also several segments like airlines likely to benefit from further stimulus. However, Industrials did not continue the rise and ended the week behind the S&P 500 .
Consumer Discretionary ( XLY ) got a boost on Friday, perhaps from higher than expected Consumer credit numbers on top of the promise of new stimulus. Quite a few people had a good Christmas it seems.
At the bottom of the list is Real Estate ( XLRE ) which is likely to suffer in the bottom line from the higher interest rates.
Technology ( XLK ) had the expected negative reaction to the blue wave on Wednesday but regained from losses on Thursday and Friday to end the week just behind Industrials .
Also notable is Utilities ( XLU ) which lost for the week, but had gains on Friday as a defensive move heading into a likely emotion filled weekend for the United States.
US Treasury Bond Yields rose significantly for the week as investors reacted to the Democrats winning the senate. Democrats are likely to pass much more stimulus which will further drive investors out of bonds and into other asset classes. The spread between US 10y and US 2y bond yields widened. This had a positive impact on the Financials sector as big banks will benefit from the higher interest rates driven by treasury bond yields.
Prices for corporate bonds (HYG) rose while the prices for short-term treasury bonds (IEI) dropped. This represents investors' confidence in corporations ability to pay back debt. That is important since many companies incurred larger than normal debt to weather the pandemic. If companies begin to default on loans, you can bet these bonds will sell-off before we know there's a problem.
The US Dollar (DXY) rose +0.19% for the week.
The put/call ratio (PCCE) ended the week at 0.563. That is an overly bullish level, but not as low as we've seen preceding recent pullbacks in the market. A contrarian indicator, when the put/call ratio is below 0.7, it signals overly bullish sentiment which typically proceeds a pullback in the market. The indicator was at 0.458 just before the September correction and it was at 0.489 just before the short October correction.
Silver (SILVER) was down -3.54% and Gold (GOLD) was down -2.61% as investors moved from the safe-haven back into assets that will benefit from new stimulus. Crude Oil futures was up +7.80% after the surprise cut back in output from Saudi Arabia.
Timber (WOOD) was up +3.97%. Copper (COPPER!1) rose +4.59% while Aluminum (ALI1!) rose +1.62%. These increases align with expectations that Democrats will increase spend on infrastructure. It's consistent also with the gains in the Materials and Industrials sectors.
It's important to keep an eye on the four biggest mega-caps and how they react to market changes. Apple (AAPL), Microsoft (MSFT) and Amazon (AMZN) all ended the week with losses, but are trading above the 10w moving average lines. Microsoft and Amazon briefly dipped below the line, but found support and closed the week above. Alphabet (GOOGL) ended the week with gains. It also dropped below the 10w MA line, but found support.
The cannabis industry is certain to benefit from legislature that will more easily pass through congress and be signed by the new administration. Stocks (including the MJ ETF) gapped up on Wednesday.
Clean Energy, Electric Vehicles, Financials and Materials were among other stocks that also soared on Wednesday.
-=x=-=x=-=x=-=x=-=x=-=x=-=x=-
The Week Ahead
Next week will bring several economic updates. JOLT Job Openings (Nov) on Tuesday and updates on Initial Jobless Claims on Thursday will provide more insight into the jobs market. Consumer price index data and Producer price index data will show any impact the weakened US Dollar is having on inflation. Friday will also bring an update on core retail sales data for December.
Traders will closely listen to Jerome Powell who is scheduled to speak on Thursday at 12:30p.
The frequency and relative importance of earnings reports will start to pick up next week. Carnival Corp (CCL) and Delta Airlines (DAL) will be among companies reporting who were impacted by the pandemic. Blackrock (BLK), Citigroup (C), JPMorgan Chase (JPM) and Wells Fargo (WFC) will report later in the week.
-=x=-=x=-=x=-=x=-=x=-=x=-=x=-
The Bullish Side
This week tested the market. We've been watching for a catalyst for the market to lose support and drop below key support areas. The riots on the US capitol could have been that catalyst. But it wasn't. Even as seller pressure increased on Wednesday, buyers came in and showed this market is not yet ready to become bearish. The inverted hammer on Wednesday was an indicator of support holding and was confirmed with the bullish days on Thursday and Friday.
30y and 10y US Treasury Bond yields rose as investors sold off the safe-haven instrument in favor of other asset classes. That was in anticipation of further stimulus coming from a Democratic controlled congress. That anticipation was confirmed when investors were briefly shaken on Friday by a Democratic senator stating he might not approve the stimulus, reversing some of the actions taken earlier in the week. The senator clarified the comment as he was still deciding and that brought investors back to equities.
So the markets continue to rise. The index has closed above the 21d EMA for 45 days. That's 10 weeks of rally, that hasn't yet shown signs of backing down. Certainly there will be pullbacks like we saw on Monday, but we have to follow the market vs worry about an eminent crash that may be months away...
-=x=-=x=-=x=-=x=-=x=-=x=-=x=-
The Bearish Side
…or it could be tomorrow. Investor sentiment continues to remain overly bullish with NAAIM exposure index heading back to highs. The Put/Call ratio remains below 0.600 The CNN Fear & Greed index is rising again. All of that could be the kind of overly bullish sentiment that precedes a much more severe pullback.
The pandemic continues to worsen even as vaccines are becoming more and more available around the world. New lockdowns seem to be popping up with frequency.
But the biggest worry for the coming weeks is the transition of power between administrations. The riots at the US Capitol have seemed to only fuel more verbal attacks from the right and the left. If those turn into more than verbal attacks, it could be that start of a very dark time in US history. It seems ominous and unbelievable, but I think the point here is that investors will be on nerves and any hint of worsening conditions could be a catalyst.
-=x=-=x=-=x=-=x=-=x=-=x=-=x=-
Key Nasdaq Levels to Watch
There are several key levels in the Nasdaq to keep an eye out for and respond accordingly. First on the positive side:
The high of Friday at 13.208.09. It's not far above the close, so I think what we want here is for the index to close above that high early in the week and then stay above that close.
The index is pausing about every 300-400 points, so expect some resistance around 13,350 - 13,400 area.
On the downside, there are several key levels to raise caution flags:
12,733.04 is the 21d EMA. The index tested that line twice last week and was able to close above it each time.
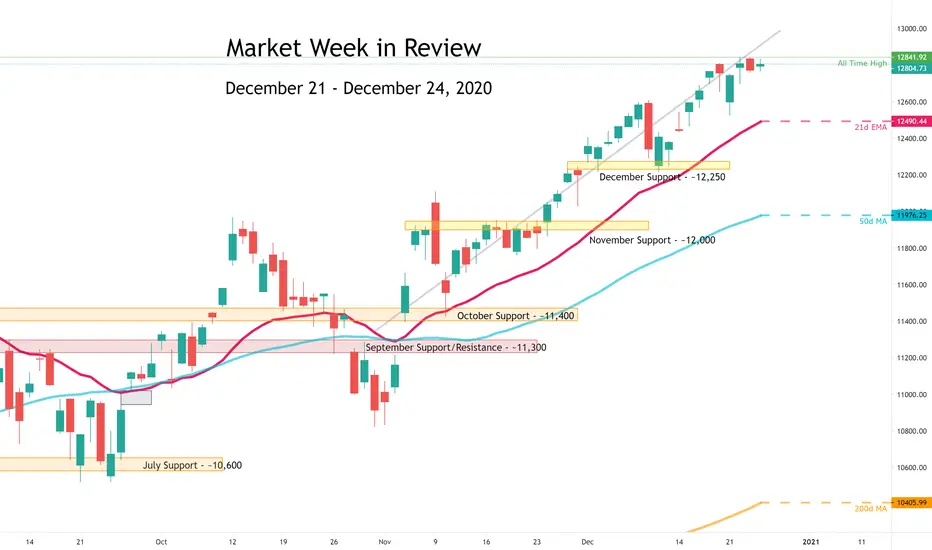
12,550 had shown as a support area, helped by the 21d EMA.
The low of last week is 12,543.24 and is just below the 12,550 support area.
The support area of 12,250 is the next area. Hopefully, that area will hold the index above that price level.
The 50d MA is at 12,222.76. That is ~7.4% below Thursday's close. The gap with the 50d MA continues to widen.
November support area is at 12,000 and a round-number point. A drop to that area would be a certainly correction level.
-=x=-=x=-=x=-=x=-=x=-=x=-=x=-
Wrap-up
It was a rough week. Lots going on. The market survived it and that’s good news for investors. Looking forward, it will be good to remain cautious while not disengaging too much. More rally could be in front of us.
With all the changes, take some time to evaluate your stocks. Look at weekly action vs daily action. Rank the stocks and determine where some additions and some trimming should be based on the changes this week. Most of all, keep in mind your risk plans and update stops as necessary.
Good luck, stay healthy and trade safe!

Daily Market Update for 1/8Trend lines drawn from the 10/30 bottom (48d), 1/4 (5d) and today 1/8 (1d).
Ideas always welcome in the comments. Errors will be amended as comments on TradingView or and corrected inline in my blog.
I'm working to condense this daily update over the next few weeks. I need to reduce it for both brevity and preparation time.
-=x=-=x=-=x=-=x=-=x=-=x=-=x=-
Friday, January 8, 2021
Might even raise a little sand
Facts: +1.03%, Volume higher, Closing range: 96%, Body: 24%
Good: Bulls win the day, despite selling pressure
Bad: Mid-day sell-off
Highs/Lows: Higher high, higher low
Candle: Smallish green body in upper part of candle, long lower wick
Advance/Decline: 1.11, about even advancing and declining stocks
Indexes: SPX (+0.55%), DJI (+0.18%), RUT (-0.99%), VIX (-3.62%)
Sectors: Consumer Discretionary (XLY +2.06%) and Real Estate (XLRE +1.08%) were top. Industrials (XLI -0.24%) and Materials (XLB -0.48%) were the bottom.
Expectation: Higher
-=x=-=x=-=x=-=x=-=x=-=x=-=x=-
Market Overview
It was a wild ride for traders today as a Democratic senator seemed to state he'd block new stimulus and then later say he's still considering his decision. That resulted in a mid-day sell-off and looked like the bears would win, but then the Nasdaq turned and closed at new all-time highs.
The index closed the day with a +1.03% gain on higher volume. The closing range of 96% and 24% green body over a long lower wick represent the mid-day selling pressure that was eventually overcome by the bulls. There were about the same number of advancing stocks as declining stocks. 275 new highs is less than the previous day, but still a very large number.
The S&P 500 (SPX) and Dow Jones Industrial (DJI) had smaller gains of +0.55% and +0.18% respectively. The Russell 2000 (RUT) showed a bearish candle that tops out at the same high as yesterday, and closes for a loss of -0.99%. The VIX declined by -3.62%.
Consumer Discretionary (XLY +2.06%) and Real Estate (XLRE +1.08%) were top sectors for the day. Industrials (XLI -0.24%) and Materials (XLB -0.48%) were the bottom. It's also worth noting Utilities (XLU +0.84%) near the top of the list, signaling some defensive plays in the mix. Also, the four losing sectors for the day, are the leaders for the week and it's likely those sectors just needed to cool off from their heated advances on Wednesday and Thursday.
-=x=-=x=-=x=-=x=-=x=-=x=-=x=-
Economic Indicators
The US Dollar (DXY) advanced for a third day. US Treasury 30y (US30Y), 10y (US10Y) had another day of big gains while the 2y (US02Y) bond yield remained flat. The yield spread for US10Y to US2Y widened again with the US10Y yield advancing over 22% for the week. Corporate Bonds (HYG) prices increased while short term treasury bond (IEI) prices dropped.
Silver (SILVER) and Gold (GOLD) both dropped -6.26% and -3.38% respectively. Crude Oil (CRUDEOIL1!) continues to advance to levels not seen since February 2020. Timber (WOOD) moved sideways after a few days of gains. Copper (COPPER1!) and Aluminum (ALI1!) retreated around -0.80% each.
-=x=-=x=-=x=-=x=-=x=-=x=-=x=-
Investor Sentiment
The put/call ratio rose slightly to 0.563 as investor optimism remains very bullish. The put/call ratio (PCCE) is a contrarian indicator that shows overly bullish or overly bearish investor behavior. The 0.7 level is considered normal. As it approaches 0.60 (overly bullish) and below, watch for a possible pullback in the market.
-=x=-=x=-=x=-=x=-=x=-=x=-=x=-
Market Leaders
The biggest four mega-caps all advanced for the day. Apple (AAPL), Microsoft (MSFT), Alphabet (GOOGL) are trading above the key 21d EMA and 50d MA lines. Amazon (AMZN) had closed above its 50d MA, but below its 21d EMA.
Tesla (TSLA) tops the mega-cap charts with a +7.84% gain, continuing its spectacular rise. Alibaba (BABA), PayPal (PYPL) and Thermo Fisher Scientific (TMO) are other top mega-caps for the day.
Growth stocks did well. In addition to Tesla, FUTU Holdings (FUTU +12.36%) and NIO (NIO +8.55%) topped the list. Penn National Gaming (PENN +7.14%) and Draft Kings (DKNG +4.48%) also did very well. Twitter (TWTR -1.62%) continued a second day of losses.
-=x=-=x=-=x=-=x=-=x=-=x=-=x=-
Looking ahead
The only scheduled big economic news for Monday is FOMC Member Bostic making remarks. However, it is expected that the House will bring new impeachment charges against the president.
No notable earnings reports are scheduled for Monday.
-=x=-=x=-=x=-=x=-=x=-=x=-=x=-
Trends, Support and Resistance
The long-term trend line from the 10/30 bottom points to a gain of +0.55%.
The one-day trend points to a -0.56% loss.
The five-day line points to a smaller loss of -0.30%.
The index is well above the 21d EMA which has acted as support recently. That's -3.53% below the close. The index also held the 12,550 area this week. If it passes that area, the next support area is 12,250.
-=x=-=x=-=x=-=x=-=x=-=x=-=x=-
Wrap-up
I thought the turmoil was behind us once elections were resolved and the capitol clear of rioters. Thursday was super bullish and with stimulus on the way, the market could have nothing but strength. However, investors are still very sensitive to anything popping in the news, as we saw with the comments today from a Democratic senator possibly blocking the stimulus.
Looking at the action mid-day, you might have wanted to panic sell, thinking this was the end of a rally. But that would have been quickly proven the wrong action. It's one of those days that reminds us to have a plan and stick to the plan, and don't give too much weight to broad reactions to media.
Stay healthy and take care!

Daily Market Update for 1/7Trend lines drawn from the 10/30 bottom (47d), 12/31 (5d) and today 1/7 (1d).
Ideas always welcome in the comments. Errors will be amended as comments on TradingView or and corrected inline in my blog.
I'm working to condense this daily update over the next few weeks. I need to reduce it for both brevity and preparation time.
-=x=-=x=-=x=-=x=-=x=-=x=-=x=-
Thursday, January 7, 2021
Ain't no telling, baby
When you will see me again, but I pray
It will be tomorrow
Facts: +2.56%, Volume lower, Closing range: 90%, Body: 90%
Good: Everything, bullish candle following the inverted hammer
Bad: Nothing
Highs/Lows: Higher high, higher low
Candle: No lower wick, very small upper wick, thick green body
Advance/Decline: 2.89, Nearly three advancing stocks for every declining stock
Indexes: SPX (+1.48%), DJI (+0.69%), RUT (+1.89%), VIX (-10.77%)
Sectors: Technology (XLK +2.70%) and Consumer Discretionary (XLY +1.93%) were top. Consumer Staples (XLP -0.30%) and Utilities (XLU -1.31%) were the bottom.
Expectation: Higher
-=x=-=x=-=x=-=x=-=x=-=x=-=x=-
Market Overview
Finally, everything is finalized and seems we can put the tumultuous election behind us. On top of that, jobless claims data was better than expected and economic activity represented by the Purchasing Managers Index was very positive. The markets responded with a huge gain and new all-time highs among the indexes.
The Nasdaq closed with a +2.56% on lower volume, and with a very bullish candle. The closing range of 90% was over a 90% body, resulting in zero lower wick as the index never revisited the low from open. There were nearly three advancing stocks for every declining stock. Over 300 Nasdaq stocks made new highs.
The other major indexes also set new all-time highs with very bullish candles. All lows came within the highs of the previous day, so no gap ups to worry about. The VIX declined by -10.77%.
-=x=-=x=-=x=-=x=-=x=-=x=-=x=-
Economic Indicators
The US Dollar (DXY) advanced for a second day. US Treasury 30y (US30Y), 10y (US10Y) had another day of big gains while the 2y (US02Y) bond yield stayed flat. The yield spread widened again. Corporate Bonds (HYG) prices increased while short term treasury bond (IEI) prices dropped.
Silver (SILVER) and Gold (GOLD) both declined for a second day. Crude Oil (CRUDEOIL1!) futures advanced to the highest since February 2020. Timber (WOOD) continued the breakout from a recent base. Copper (COPPER1!) advanced while Aluminum (ALI1!) remained near flat.
-=x=-=x=-=x=-=x=-=x=-=x=-=x=-
Investor Sentiment
The put/call ratio dropped to 0.552 as investor optimism gets very bullish. The put/call ratio (PCCE) is a contrarian indicator that shows overly bullish or overly bearish investor behavior. The 0.7 level is considered normal. As it approaches 0.60 (overly bullish) and below, watch for a possible pullback in the market.
-=x=-=x=-=x=-=x=-=x=-=x=-=x=-
Market Leaders
The biggest four mega-caps all advanced for the day. Apple (AAPL), Microsoft (MSFT), Alphabet (GOOGL) regained losses from the previous day. Amazon (AMZN) had gains early in the day, but then sold off to close below its 21d EMA and 50d MA. Microsoft closed below its 21d EMA.
Nvidia (NVDA) is near the top of the mega-caps list, gaining +5.78% after being at the bottom yesterday. Tesla (TSLA) gained +7.94% while Taiwan Semiconductor (TSM) gained +5.03%. PayPal (PYPL) also reversed losses with a +3.62% gain.
Most growth stocks did very well for the day with NIO (NIO +7.49%), Cloudflare (NET +7.85%) and Peloton (7.12%) joining Tesla at the top of the list. Twitter (TWTR -1.75%) had losses, possibly due to the turmoil around Trump's twitter account (seen as a boost to twitter's traffic in recent years).
Bed Bath & Beyond (BBY) missed quarterly revenue estimates and dropped 10%. They announced before market open. Semiconductor stock Micron Technology beating earnings and is up 1.45% in afterhours trading.
-=x=-=x=-=x=-=x=-=x=-=x=-=x=-
Looking ahead
Friday will bring more updates on the labor market with Hourly Earnings, Nonfarm Payrolls and the Unemployment Rate data being released before market open. Later in the morning FOMC member Clarida will speak.
No notable earnings reports are scheduled for Friday.
-=x=-=x=-=x=-=x=-=x=-=x=-=x=-
Trends, Support and Resistance
The one-day trend points to a +1.38% gain.
The long-term trend line from the 10/30 bottom points to a more modest gain of +0.41%.
The five-day line points to a -0.61% loss.
The index is well above the 21d EMA which has acted as support recently. That's -2.89% below the close. The index also held the 12,550 area this week. If it passes that area, the next support area is 12,250.
-=x=-=x=-=x=-=x=-=x=-=x=-=x=-
Wrap-up
The market seems favorable to get past the volatility of the election drama, and that's understandable. Of course, there is probably some price discovery to happen across sectors as investors understand better the impact of a Democratic majority in Congress and a Democratic president in the White House.
Stay healthy and take care!

Daily Market Update for 1/6Trend lines drawn from the 10/30 bottom (46d), 12/30 (5d) and today 1/6 (1d).
Ideas always welcome in the comments. Errors will be amended as comments on TradingView or and corrected inline in my blog.
I'm working to condense this daily update over the next few weeks. I need to reduce it for both brevity and preparation time.
-=x=-=x=-=x=-=x=-=x=-=x=-=x=-
Wednesday, January 6, 2021
Bold as Love
Facts: -0.61%, Volume higher, Closing range: 35%, Body: 29%
Good: Stayed above opening low, held support at around yesterday's low
Bad: Sell-off in late afternoon
Highs/Lows: Higher high, lower low
Candle: Inverted hammer that signals buyers held support despite selling pressure
Advance/Decline: 1.64, Three advancing stocks for every two declining stocks
Indexes: SPX (+0.57%), DJI (+1.44%), RUT (+3.98%), VIX (-1.07%)
Sectors: Financials (XLF +4.42%) and Materials (XLB +4.09%) were top. Communications (XLC -0.48%) and Technology (XLK -1.72%) were bottom.
Expectation: Sideways or Higher
-=x=-=x=-=x=-=x=-=x=-=x=-=x=-
Market Overview
It was a wild day for the markets as unbelievable events unfolded in the US capitol. The Georgia run-off elections resulted in Democrats taking control of the Senate, realizing the blue wave that was original anticipated with the November elections. The Nasdaq shook off the initial rotation and rose to gains by mid-afternoon, but would sell-off as rioters stormed the US Capitol in protest of election outcomes. The index closed -0.61% on higher volume with a closing range of 35% and a body of 29%. More stocks advanced than declined.
The other major indexes set new all-time highs before the afternoon sell-off. The rotation was moving investors back into Financials, Materials and Industrials as well as small-cap stocks. The Russell 2000 performed the best among the indexes, rising over 5% before settling back to just below 4% at close. The VIX declined by -1.07%.
-=x=-=x=-=x=-=x=-=x=-=x=-=x=-
Economic Indicators
The US Dollar (DXY) advanced for the day. US Treasury 30y (US30Y), 10y (US10Y)and 2y (US02Y) bond yields all gained for the day. The yield curves expanded significantly. Corporate Bonds (HYG) price declined but were outpaced by the decline in short term treasury bond (IEI) prices.
Silver (SILVER) and Gold (GOLD) both declined. Crude Oil (CRUDEOIL1!) futures advanced to the highest since February 2020. Timber (WOOD) broke out of a recent base. Copper (COPPER1!) advanced while Aluminum (ALI1!) declined.
-=x=-=x=-=x=-=x=-=x=-=x=-=x=-
Investor Sentiment
The put/call ratio dropped to 0.570. The put/call ratio (PCCE) is a contrarian indicator that shows overly bullish or overly bearish investor behavior. The 0.7 level is considered normal. As it approaches 0.60 (overly bullish) and below, watch for a possible pullback in the market.
-=x=-=x=-=x=-=x=-=x=-=x=-=x=-
Market Leaders
The biggest four mega-caps all declined sharply for the day as investors rotated away from big tech firms. Apple (AAPL), Microsoft (MSFT), Amazon (AMZN), Alphabet (GOOGL) all closed below their 21d EMA. Only Apple closed above its 30d MA.
The financial mega-caps performed best for the day. Bank of America (BAC) and JP Morgan Chase (JPM) advanced 6.26% and 4.70% respectively. The anticipated stimulus from a blue wave government will raise yield prices, increasing interest rate income that benefits banks. Nvidia (NVDA) was among the big tech companies with a significant losses, dropping -5.90% for the day.
Popular growth stocks were also impacted by the day's events. New energy stocks including Solar Edge (SEDG) did well. Gaming stocks Draft Kings and Penn National Gaming also closed the day with gains. Many other growth stocks closed with 5-6% losses.
-=x=-=x=-=x=-=x=-=x=-=x=-=x=-
Looking ahead
Thursday will bring an update on Initial Jobless Claims before market open. Later in the morning, an update on non-manufacturing PMI data will be released indicating economic activity in service sectors. Two FOMC board members will speak tomorrow.
Several retail companies will release earnings tomorrow including Walgreen Boots Alliance (WBA), Bed Bath & Beyond (BBBY) and Helen of Troy (HELE). Micron Technology (MU) will be the first of large semiconductors to announce earnings this year.
-=x=-=x=-=x=-=x=-=x=-=x=-=x=-
Trends, Support and Resistance
The long-term trend line from the 10/30 bottom points to a +2.37% gain.
The one-day trend points to a +0.71% gain.
The five-day line points to a -0.06% loss.
The index held the 12,550 area this week. If it passes that area, the next support area is 12,250.
-=x=-=x=-=x=-=x=-=x=-=x=-=x=-
Wrap-up
It was a tough day. Not only was it tough as a trader, but it was tough to deal with what occurred in the US capitol. As a trader, give yourself time to reflect and observe and center yourself on your own trading system before making a plan for the rest of this week.
The inverted hammer signals there was seller pressure in the afternoon, but buyers held support above the morning lows which was a positive sign heading into close.
Stay healthy and take care!

RTY Update 1/6The market celebrating the end of capitalism because of stimulus, lol.
Stayed out of the market the last couple of weeks to go duck hunting, this crap is absolutely hilarious. In any case, RTY and ES MFI overbought, YM and NQ aren;t quite there yet.

Daily Market Update for 1/5Trend lines drawn from the 10/30 bottom (45d), 12/29 (5d) and today 1/5 (1d).
Ideas always welcome in the comments. Errors will be amended as comments on TradingView or and corrected inline in my blog.
I'm working to condense this daily update over the next few weeks. I need to reduce it for both brevity and preparation time.
-=x=-=x=-=x=-=x=-=x=-=x=-=x=-
Tuesday, January 5, 2021
There must be some kind of way outta here
Facts: +0.95%, Volume higher, Closing range: 94%, Body: 94%
Good: Solid day of gains, no lower wick
Bad: Nothing
Highs/Lows: Lower high, higher low
Candle: Inside day, bullish green body with no lower wick and tiny upper wick
Advance/Decline: 2.39, More than two advancing stocks for every declining stock
Indexes: SPX (+0.71%), DJI (+0.55%), RUT (+1.71%), VIX (-6.04%)
Sectors: Energy (XLE +4.48%) and Materials (XLB +2.25%) were top. Utilities (XLU -0.02%) and Real Estate (XLRE -0.11%) were worst performing
Expectation: Sideways or Higher
-=x=-=x=-=x=-=x=-=x=-=x=-=x=-
Market Overview
The Nasdaq followed yesterday's bearish session with a bullish rebound today. There is still work to do to get back to all-time highs, but the gains were steady throughout the day as the index never revisited the morning low. The index closed the day with a +0.95% gain on higher volume, closing range of 94% and a thick green body of 94%. The lower wick doesn't exist and the upper wick is very tiny. More than two stocks advanced for every declining stock.
All major indexes had gains for the day. The S&P 500, Dow Jones Industrial and Russell 200 had similar bullish inside days. The VIX dropped back -6.04%, but still at an elevated level.
-=x=-=x=-=x=-=x=-=x=-=x=-=x=-
Economic Indicators
The US Dollar (DXY) declined for another day as it sits within a support range from early 2018. US Treasury 30y (US30Y), 10y (US10Y)and 2y (US02Y) bond yields all gained for the day. Corporate Bonds (HYG) prices stayed about the same while short term treasury bond (IEI) prices dropped.
Silver (SILVER) and Gold (GOLD) both increased for a second day. Crude Oil (CRUDEOIL1!) futures advanced. Timber (WOOD) is up but moving in a sideways trend. Copper (COPPER1!) and Aluminum (ALI1!) advanced.
-=x=-=x=-=x=-=x=-=x=-=x=-=x=-
Investor Sentiment
The put/call ratio dropped to 0.592. The put/call ratio (PCCE) is a contrarian indicator that shows overly bullish or overly bearish investor behavior. The 0.7 level is considered normal. As it approaches 0.60 (overly bullish) and below, watch for a possible pullback in the market.
-=x=-=x=-=x=-=x=-=x=-=x=-=x=-
Market Leaders
The biggest four mega-caps all advanced for the day. Apple (AAPL) and Amazon (AMZN) closed above its 21d EMA. Microsoft (MSFT) and Alphabet (GOOGL)closed below the 21d EMA but above the 50d MA.
Alibaba (BABA) was one of the top mega-cap gainers with a 5.51% advance. Nvidia, Intel and PayPal were the other large mega-caps with top gains for the day. Visa (V) and Mastercard (M) were at the bottom of the mega-cap list with >1% losses.
Many growth stocks advanced for the day with Chinese stocks FUTU Holdings (FUTU) and JD.Com (JD) topping the list at 19.76% and 10.62% gains respectively. Several others including FVRR, PENN and DKNG all had huge gains.
-=x=-=x=-=x=-=x=-=x=-=x=-=x=-
Looking ahead
Tomorrow morning, ADP Nonfarm Employment data for December will be released before market open. Additional pricing index data will be released just after open. Crude Oil Inventories will be updated at 10:30. Finally, the FOMC Meeting minutes from the December meeting will be released in the afternoon.
No notable earnings announcements are scheduled for Wednesday.
-=x=-=x=-=x=-=x=-=x=-=x=-=x=-
Trends, Support and Resistance
The long-term trend line from the 10/30 bottom points to a +1.97% gain.
The one-day trend points to a +0.66% gain.
The five-day line points to a -0.99% loss.
The index held the 12,550 area today. If it passes that area, the next support area is 12,250.
-=x=-=x=-=x=-=x=-=x=-=x=-=x=-
Wrap-up
The bullish reversal from yesterday's bearish day was a pleasant surprise today. Possibly buoyed by positive Manufacturing data that shows growth in economic activity. Additional data released tomorrow could strengthen that positive outlook.
All eyes will be on the Senate race as Georgia is starting to count votes as I write this. The outcome could have an impact on how investors position themselves for the next year. With Biden in the Whitehouse, a Democratic controlled Senate would have a very different impact on the markets than a Republican controlled Senate.
Stay healthy and take care!

Daily Market Update for 1/4Trend lines drawn from the 10/30 bottom (44d), 12/28 (5d) and today 1/4 (1d).
Ideas always welcome in the comments. Errors will be amended as comments on TradingView or and corrected inline in my blog.
I'm working to condense this daily update over the next few weeks. I need to reduce it for both brevity and preparation time.
-=x=-=x=-=x=-=x=-=x=-=x=-=x=-
Monday, January 4, 2021
Lately things, they don't seem the same
Facts: -1.47%, Volume higher, Closing range: 37%, Body: 63%
Good: Held support around 12,550, some recovery off lows
Bad: Thick red body, no upper wick
Highs/Lows: Higher high, lower low
Candle: Bearish engulfing candle with thick body over long lower wick
Advance/Decline: 0.84, more declining than advancing stocks
Indexes: SPX (-1.48%), DJI (-1.25%), RUT (-1.47%), VIX (+18.55%)
Sectors: Energy (XLE +0.16%) was the only gaining sector. Utilities (XLU -2.52%) and Real Estate (XLRE -3.23%) were worst performing
Expectation: Sideways or Lower
-=x=-=x=-=x=-=x=-=x=-=x=-=x=-
Market Overview
It was not a great start to 2021 with the equity markets selling off significantly throughout the day after making morning highs. The Nasdaq nearly reach its all-time high before selling off sharply in the morning. Recovery in the afternoon was not nearly enough to be seen as a positive. The index closed down -1.45% with a closing range of 37% and a thick red body of 63%. The higher high and lower low than the previous day represents a bearish engulfing candle that can indicate bearish sentiment in the market. There were more declining stocks than advancing stocks.
All major indexes had similar bearish days. Each took a trip below the 21d EMA line but all were able to close above the key support line. Closing above the 21d EMA is a positive. However, the VIX spiked over 28% before settling down to an 18.55% gain for the day. That is the second such spike over 20% in the last 9 trading sessions. Those spikes are not a good sign for the markets health.
The VIX closed at this same level on September 2nd, just before a big correction. It stayed around this level throughout September and October, before finally coming down in November and December.
-=x=-=x=-=x=-=x=-=x=-=x=-=x=-
Economic Indicators
The US Dollar (DXY) declined into the new year. US Treasury 30y (US30Y) Bond yields rose while the shorter term 10y (US10Y)and 2y (US02Y) bond yields dropped. Corporate Bonds (HYG) prices declined as investors sold the riskier bonds for safer bets in short term treasury bonds (IEI).
Silver (SILVER) and Gold (GOLD) both increased significantly for the day. Crude Oil (CRUDEOIL1!) futures declined. Timber (WOOD) is moving sideways. Copper (COPPER1!) and Aluminum (ALI1!) advanced.
-=x=-=x=-=x=-=x=-=x=-=x=-=x=-
Investor Sentiment
Despite a drop in market prices, the put/call ratio dropped to 0.659. The put/call ratio (PCCE) is a contrarian indicator that shows overly bullish or overly bearish investor behavior. The 0.7 level is considered normal. As it approaches 0.60 (overly bullish) and below, watch for a possible pullback in the market.
-=x=-=x=-=x=-=x=-=x=-=x=-=x=-
Market Leaders
The biggest for mega-caps all declined for the day. Apple (AAPL) was the only to close above its 21d EMA. Microsoft (MSFT) and Amazon (AMZN) dipped below both the 21d EMA and 50d MA but closed above the 50d MA. Alphabet (GOOGL) closed below its 21d EMA and 50d MA. This action signals weakness in the mega-caps that have a huge influence over the rest of the market.
Tesla (TSLA) had a positive day gaining 3.42%. Taiwan Semiconductor (TSM) and Nvidia (NVDA) also had gains for the days. AT&T (T) and Walmart (WMT) were other mega-caps that did well.
Electric Vehicle stock NIO (NIO) gained +9.75%. Zoom Video (ZM) had a huge gain on fears of new lock downs in the US and Europe. Pinterest (PINS) also did well. Many other growth stocks did not fare well for the day. Digital Turbine (APPS), DataDog (DDOG) and Sumo Logic (SUMO) all lost over 7%.
-=x=-=x=-=x=-=x=-=x=-=x=-=x=-
Looking ahead
Tuesday will bring Manufacturing PMI data for December mid-morning. FOMC Member Williams will speak in the afternoon. However, all eyes will be on election news in Georgia as voters will determine which party controls the Senate.
No notable earnings announcements are scheduled for Tuesday.
-=x=-=x=-=x=-=x=-=x=-=x=-=x=-
Trends, Support and Resistance
The long-term trend line from the 10/30 bottom points to a +2.90% gain.
The five-day trend points to a sideways move with no gain/loss.
The one-day line points to a -2.13% loss.
The index held the 12,550 area today. If it passes that area, the next support area is 12,250.
-=x=-=x=-=x=-=x=-=x=-=x=-=x=-
Wrap-up
It was not a great start to the year. However, it's no abnormal for some price discovery in the first week of January. Things could be turned upside down based on the election results in Georgia. We then have another day of tension to get past the certification of the electoral votes in Congress. On top of all that is new pandemic lockdowns in Europe and the possibility for new lockdowns in the US.
It could be a another rough week, keep an eye on your stop loss orders and look for more stability later in January.
Stay healthy and take care!

Market Week In Review - 12/28/2020 - 12/31/2020The Market Week in Review is my weekend homework where I look over what happened in the previous week and what might come in the next week. It helps me evaluate my observations, recognize new data points, and create a plan for possible scenarios in the future.
I do occasionally have some errors or typos and will correct them in my blog or in the comments on TradingView. I do not have an editor and do this in my free time.
If you find this helpful, please let me know in the comments. I am also more than happy to add new perspectives and data points if you have ideas.
The structure is the following:
A recap of the daily updates that I do here on TradingView.
The Meaning of Life, a view on the past week
What's coming in the next week
The Bullish View, The Bearish View
Key index levels to watch out for
Wrap-up
If you have been following my daily updates, you can skip down to the “The Meaning of Life”. If not, then this first part is a great play-by-play recap for the week. Click the original charts for more detail each day.
-=x=-=x=-=x=-=x=-=x=-=x=-=x=-
Monday, December 28, 2020
Oh I bet you think you're John Wayne
Facts: +0.74%, Volume higher, Closing range: 70%, Body: 15%
Good: New all-time high, filled morning gap, closed in upper half
Bad: Could not close above open
Highs/Lows: Higher high, higher low
Candle: Dip in morning caused long lower wick, thin body in upper half
Advance/Decline: 1.08, about even advancing and declining stocks
Sectors: Communications (XLC +1.80%), Consumer Discretionary (XLY +1.14%), Technology (XLK +1.13%) were top. Energy (XLE -0.63%) was the worst performing, the only losing sector.
Expectation: Sideways or Higher
The Nasdaq came back from a long weekend with a gap-up on stimulus news that quickly sold-off to fill the gap. It then rose into the afternoon to set a new all-time high and then finish with a bit of selling late in the session. The index closed with a +0.74% gain. The closing range was 70% with a thin body of 15% in the upper half of the candle. Volume was higher, but only compared to a short session on Thursday. There were just a bit more advancing stocks than declining stocks.
-=x=-=x=-=x=-=x=-=x=-=x=-=x=-
Tuesday, December 29, 2020
It's coming down on me
Water like misery
Facts: -0.38%, Volume lower, Closing range: 19%, Body: 76%
Good: New all-time high, held support above 12,800
Bad: Long red body, selling from open to close
Highs/Lows: Higher high, lower low
Candle: Long red body, short upper and lower wick
Advance/Decline: 0.41, more than two declining for every advancing stock
Sectors: Health (XLV +0.47%) and Consumer Discretionary (XLY +0.03%) are top. Real Estate (XLRE -0.77%) was bottom.
Expectation: Lower
The Nasdaq started the day by setting a new all-time high but quickly reversed downward and sold off the rest of the day. Still, it held above the 12,800 area which seems to be new support. The index closed with a -0.38% loss on lower volume. The closing range of 19% and 76% red body show the high open and intraday move to close near the low. Over two stocks declined for every advancing stock on the Nasdaq.
-=x=-=x=-=x=-=x=-=x=-=x=-=x=-
Wednesday, December 30, 2020
It took me so long getting back to my right mind.
Facts: +0.15%, Volume higher, Closing range: 18%, Body: 54%
Good: Stayed above yesterday's low
Bad: Longer upper wick, closing range near bottom
Highs/Lows: Lower high, higher low
Candle: Outside day, >50% red body, longer upper wick
Advance/Decline: 2.24, more than two advancing stocks for every declining stock
Sectors: Energy (XLE +1.57%) and Materials (XLB +1.38%) are top. Communications (XLC -0.67%) was bottom.
Expectation: Lower
It's been a third day of rotation in the market as the money that supported a move from smaller-caps to larger-caps on Monday transitioned back to smaller-caps today (small and mid-caps). The result was a larger breadth of stocks advancing, but a bearish looking inside day for the Nasdaq. The index closed up +0.15% on higher volume. That was the good news. The closing range of 18% and 54% red body point to a more bearish view of the day. More than two stocks advanced for every declining stock.
-=x=-=x=-=x=-=x=-=x=-=x=-=x=-
Thursday, December 31, 2020
Sun, sun, sun, here it comes
Facts: +0.14%, Volume higher, Closing range: 83%, Body: 14%
Good: Close high in the day's range
Bad: LH/LL, spent long time near lows
Highs/Lows: Lower high, lower low
Candle: Indecisive candle with a longer lower wick
Advance/Decline: 0.86, more declining than advancing stocks
Sectors: Utilities (XLU +1.49%), Financials (XLF +1.24%) at the top. Energy (XLE -0.84%) is the only losing sector.
Expectation: Sideways or Higher
The last trading day of 2020, finished a week of sideways movement in the market with an indecisive day. The body of only 14% shows the close is not very far above the open. The index closed with a 0.14% gain and a closing range of 83%. Volume was slightly higher than the previous day. There were more declining stocks than advancing stocks.
-=x=-=x=-=x=-=x=-=x=-=x=-=x=-
The Meaning of Life (View on the Week)
Happy New Year!
The last week of trading in the Nasdaq resulted a pop on Monday that then moved sideways the rest of the week. The index did manage to set a new all-time high and close with a +0.65% for the week. But the close is just below the open, resulting in a spinning top style candle that marks some indecision. The lower closing range of 44% is still a positive as we like to see it above 40%.
The Russell 2000 (RUT) ended its eight week winning streak by losing -0.26% for this week, after setting another new all-time high. The S&P 500 (SPX) and Dow Jones Industrial (DJI) both had bullish weeks with +0.64% and +0.65% gains respectively.
For the Nasdaq, Monday started with a gap-up on positive stimulus news, but quickly filled the gap during morning selling. Even with the selling, the index could stay above the previous Friday's close and end the day in the upper range of the candle. Growth stocks gave up recent gains as investors moved money back into larger-cap stocks. That would be the story for most of the week.
Tuesday brought a very bearish day of trading as the Nasdaq lost for the day, opening with a new all-time high, but closing below Monday's close. The bearish candle was representative of over two declining stocks for every advancing stock on the index.
Wednesday would be the one bright spot for small caps as the Russell 2000 had its only positive day of the week. Breadth seemed to come back into the market as small-caps and several growth stocks made gains. But Thursday finally ended the week with expected defensive moves into Utilities and Value (see VTV and IUSV as examples) stocks as investors prepared for a long weekend and also a turnover to the new year.
The weekly chart shows the spinning top candle with a bit of bearishness to it, despite the index ending the week in the positive. On the positive side, the candle shows a higher high and a higher low. The closing range of 44% is not great, but also not bad, since we look for a closing range above 40%.
Communications ( XLC ) and Consumer Discretionary ( XLY ) spent about half the week each at the top of the sector list.
But it was Utilities ( XLU ) that would rise at the end of the week as the winner. No doubt a defensive play going into the long weekend and a turn of the clock to a new year.
Energy ( XLE ) had a very short-lived time at that top on Monday morning, but ended the week as the worst performing sector. Energy was the only sector to end the week with a loss.
US Treasury Bond Yields dropped for a second week. The spreads between long term and short term bonds tightened slightly. The US 30y and US 10y yields are both in uptrends as investors are not interested in the long term bonds. The US 2y yield is in a sideways to downward trend.
Prices for corporate bonds (HYG) continues to trend upward while short-term treasury bond prices (IEI) trend sideways, signaling confidence in the economy from investors.
The US dollar (DXY) declined -0.32% for the week. The dollar is at a support/resistance area formed in the first quarter of 2018.
The put/call ratio (PCCE) ended the week at 0.688. The level is more comfortable than the overly bullish levels seen in recent weeks. A contrarian indicator, when the put/call ratio is below 0.7, it signals overly bullish sentiment which typically proceeds a pullback in the market. The indicator was at 0.458 just before the September correction and it was at 0.489 just before the short October correction.
Silver (SILVER) was up +2.08% for the week while Gold (GOLD) rose +1.01%. Crude Oil was down -0.76%. Timber (WOOD) was up +0.61%. Copper (COPPER!1) pulled back with a -1.92% loss while Aluminum (ALI1!) declined -2.12%.
Of the four largest mega-caps, only Microsoft (MSFT) closed the week with a loss, declining -0.15% for the week. Amazon (AMZN) had the largest gain moving +2.66%. Alphabet (GOOGLE) was up +1.07% for the week, and closed above its 10w MA line. Apple (AAPL) gained +0.55%.
Interesting chart of Growth vs Value stocks on a monthly basis. Value stocks still have a ways to catch up to Growth stocks in 2021.
-=x=-=x=-=x=-=x=-=x=-=x=-=x=-
The Week Ahead
The first week of the year will kick-off with an OPEC meeting on Monday morning. Manufacturing PMI data for December earlier in the week will give an update on manufacturing data. Crude Oil inventories and updated employment data will come later in the week.
FOMC meeting minutes from a few weeks ago will be released on Wednesday providing more insight into policy decisions.
It will be a light week for earnings reports. Some retailers including Bed Bath & Beyond (BBBY), Walgreen Boots Alliance (WBA) and Helen of Troy (HELE) will release earnings on Thursday.
-=x=-=x=-=x=-=x=-=x=-=x=-=x=-
The Bullish Side
The last week of the 2021 year was a bit rough with rotations from smaller caps to larger caps, several industry sectors, and a big move at the end of the week into Utilities sector. That may have felt bearish for some investors and bullish for others. Looking at the Nasdaq chart, we see a higher high and a lower low on top of a decent gain. Confirmed by the bullish SPX and DJI charts.
Although investors moved into defensive positions at the end of the week, the money stayed within equity markets with relatively little movement to treasury bonds. The demand for corporate bonds also shows that investors are bullish on the recovery for US companies.
The stimulus that was signed into law early last week will start to filter into areas of the economy most in need, including checks for individuals. There was a spike in demand for Oil as travelers put pandemic worries aside and hit the road for the holidays.
Europeans signed a huge trade deal with China while tensions between the UK and Europe should start to ease as the Brexit deal was finally agreed. As vaccines continue to be distributed across Europe, the end to lockdowns should be near, just in time for the increased economic opportunities.
-=x=-=x=-=x=-=x=-=x=-=x=-=x=-
The Bearish Side
Next week will bring the Georgia run-off elections which will determine if the Republicans or Democrats will control the Senate. A win for the Democrats will mean another shift back toward Blue Wave investments. The shift will no doubt benefit some while catching others off guard.
The meteoric rise in Bitcoin over the last few weeks brings with it lots of questions. Is it speculative investors jumping in at new all-time highs? More likely is smart money buying up bitcoin as a hedge against the devaluation of world currencies, one of the well-known advantages of bitcoin. That, and some speculative investment. The smart money moving in could be a warning signal for the economy just as any other indicator based on treasury bonds, currency movements or commodities.
After several weeks of higher highs and higher lows, the market could be due for more of a pullback. The 50d moving average line is about 6.5% below Thursday's close.
-=x=-=x=-=x=-=x=-=x=-=x=-=x=-
Key Nasdaq Levels to Watch
There are several key levels in the Nasdaq to keep an eye out for and respond accordingly. First on the positive side:
The high of Tuesday at 12,973.33 will be the first test. A new high to start the week would be a positive sign to continue the current rally.
The index is just below the round number of 13,000. Round-number resistance is caused by traders’ tendency to put in sell orders at round numbers.
On the downside, there are several key levels to raise caution flags:
12,821.23 is the low of this week. Staying above the low would put in another week of higher lows.
12,800 is the next support area. The index has traded around that area the last few weeks.
The 21d EMA is at 12,612.94. The index has closed above this moving average line for the last 40 trading days.
The support area of 12,250 is the next support area. Hopefully, that area will hold the index above that price level.
The 50d MA is at 12,078.79. That is ~6.5% below Thursday's close. Testing the 50d MA will make a lot of investors nervous, already causing a big hit to portfolios.
November support area is at 12,000 and a round-number point. A move below this line would raise more flags for investors.
September Support line is at 11,300. Dropping to this level would be a sure sign of correction.
-=x=-=x=-=x=-=x=-=x=-=x=-=x=-
Wrap-up
I hope you have a great start to the New Year and wish you many great successes in 2021!
Good luck, stay healthy and trade safe!

Daily Market Update for 12/31Trend lines drawn from the 10/30 bottom (43d), 12/24 (5d) and today 12/31 (1d).
Ideas always welcome in the comments. Errors will be amended as comments on TradingView or and corrected inline in my blog.
-=x=-=x=-=x=-=x=-=x=-=x=-=x=-
Thursday, December 31, 2020
Sun, sun, sun, here it comes
Facts: +0.14%, Volume higher, Closing range: 83%, Body: 14%
Good: Close high in the day's range
Bad: LH/LL, spent long time near lows
Highs/Lows: Lower high, lower low
Candle: Indecisive candle with a longer lower wick
Advance/Decline: 0.86, more declining than advancing stocks
Sectors: Utilities (XLU +1.49%), Financials (XLF +1.24%) at the top. Energy (XLE -0.84%) is the only losing sector.
Expectation: Sideways or Higher
-=x=-=x=-=x=-=x=-=x=-=x=-=x=-
Market Overview
The last trading day of 2020, finished a week of sideways movement in the market with an indecisive day. The body of only 14% shows the close is not very far above the open. The index closed with a 0.14% gain and a closing range of 83%. Volume was slightly higher than the previous day. There were more declining stocks than advancing stocks.
-=x=-=x=-=x=-=x=-=x=-=x=-=x=-
Indexes and Sectors
The S&P 500 (SPX +0.64%) and Dow Jones Industrial (DJI +0.65%) set new all-time highs to end the year while the Russell 2000 (RUT -0.26%) continued a year-end pullback.
Utilities (XLU +1.49%) and Financials (XLF +1.24%) led the sectors, with Utilities getting a big boost at the end of the day as a defensive play going into a long weekend. Energy (XLE -0.84%) was the only losing sector for the day.
The VIX volatility index declined by -0.09%.
-=x=-=x=-=x=-=x=-=x=-=x=-=x=-
Market Indicators
Yields declined on US 30y, 10y and 2y treasury bonds. The spread between long term and short term bonds tightened slightly.
Corporate bond prices (HYG +0.08%) rose for the day, tightening the yield spread with short term bonds (IEI +0.04%).
The US dollar (DXY +0.29%) rose for the day.
Silver (SILVER -0.99%) declined while Gold (GOLD +0.19%) advanced for the day. Crude Oil futures (CRUDEOIL1! +0.17%) rose. Timber (WOOD -0.53%) declined. Copper (COPPER1! -0.88%) and Aluminum (ALI1! -1.70%) declined.
The put/call ratio rose to 0.688. The put/call ratio (PCCE) is a contrarian indicator that shows overly bullish or overly bearish investor behavior. The 0.7 level is considered normal. As it approaches 0.60 (overly bullish) and below, watch for a possible pullback in the market.
-=x=-=x=-=x=-=x=-=x=-=x=-=x=-
Market Leaders
Microsoft (MSFT +0.33%) and Alphabet (GOOGL +0.94%) advanced for the day while Apple (AAPL -0.77%) and Amazon (AMZN -0.88%) declined. Alphabet closed above its 21d EMA. All four biggest mega-caps are trading above the key moving averages.
Top performing mega-caps included Netflix (NFLX +3.08%), Comcast (CMCSA +2.32%), Intel (INTC +2.19%) and UnitedHealth Group (UNH +0.44%).
Some growth stocks did well on the last day of the year, but most had declines. Tesla (TSLA +1.57%), Zynga (ZNGA +1.54%), SNAP (SNAP +1.46%) and PayPal (PYPL +1.16%) were among the top performers. Fastly (FSLY -3.38%), Zoom Video (ZM -4.55%), Draft Kings (DKNG -4.88%) and Fiverr (FVRR -5.02%) had big declines.
-=x=-=x=-=x=-=x=-=x=-=x=-=x=-
Looking ahead
Monday will be the first trading day of 2021. An OPEC meeting will open the week. Manufacturing PMI data will be released just after markets open. Later in the morning, FOMC Member Bostic will make public comments. The afternoon will bring updates on speculative positions for several commodities.
No notable earnings announcements are scheduled for Monday.
-=x=-=x=-=x=-=x=-=x=-=x=-=x=-
Trends, Support and Resistance
The long-term trend line from the 10/30 bottom points to a +1.20% gain
The five-day trend and one-day trend lines point to a small loss of -0.13%.
As the calendar turns over to the new year, market sentiment may change as well. If the index moves down, there seems to be a support level from 12,750 to 12,800 where the index can pause during a pullback. The previous support level is around 12,500.
-=x=-=x=-=x=-=x=-=x=-=x=-=x=-
Wrap-up
The market did not really move much this week. The weekly candle is an indecisive spinning top where the top and bottom wicks are similar in length, while the body is thin with the closing price for the week being very near the open.
The next week will bring some uncertainty around the elections in Georgia and the drama of the electoral vote confirmation in congress. Keep to your trading rules to avoid overreacting to news.
The index will pass 200 trading days since the March bottom this week. That will soon bring the popular 200d moving average much closer to current prices. It's currently 18% below the index. Having the 200d moving average in play, will be another area of support/resistance as the market moves into 2021.
Stay healthy and take care!

THE WEEK AHEAD: BBBY, MU EARNINGS; ICLN, SLV, XLE, IWM/RUTEARNINGS:
I've culled down all of next week's earnings announcements to options highly liquid underlyings where the 30-day is >50% and am left with two potential candidates for volatility contraction plays: BBBY (23/99/26.3%)* and MU (23/53/14.0%).
BBBY announces on Thursday before market open, so look to put on a play in the waning hours of Wednesdays session; MU, announces on Thursday after market close.
Pictured here is a delta neutral short strangle in the February cycle (49 days), which was paying 1.27 at the mid price as of Friday close with break evens wide of two times the expected move on the call side and slightly above the 2x on the put and delta/theta of -1.07/3.12. Naturally, you can see the call side skew here, with the similarly-delta'd short put 3.76 away from current price, but the call 7.24 away, so the underlying may merit a look at alternative plays that take advantage of this.
In contrast, the shorter duration January 15th 15/22.5 (14 days) was paying 1.02, with delta/theta metrics of .21/7.91, with the natural trade-off's being less room to be wrong, but a quicker resolution of the trade should you be right.
With MU, I'd look at a Plain Jane 2x expected move short strangle, which here would be the January 15th 68.5/85, paying 1.71 or the February 19th 62.5/90, paying 2.30.
EXCHANGE-TRADED FUNDS RANKED BY PERCENTAGE THE FEBRUARY 19TH AT-THE-MONEY SHORT STRADDLE PAYS AS A FUNCTION OF STOCK PRICE:
ICLN (9/51/15.0%)
SLV (33/48/13.6%)
XLE (23/41/11.4%)
XBI (27/39/11.2%)
EWZ (14/39/11.1%)
GDX (15/38/11.1%)
XME (14/38/10.7%)
BROAD MARKET:
IWM (25/31/8.1%)
QQQ (19/27/7.1%)
SPY (15/22/5.4%)
EFA (20/21/5.2%)
BOND FUNDS:
TLT (16/18/4.4%) (Yield: 1.609%)
HYG (7/13/2.0%) (Yield: 4.917%)
EMB (4/7/2.0%) (Yield: 4.024%)
AGG (28/8/1.7%) (Yield: 2.252%)
* -- The first number is the implied volatility rank or percentile (i.e., where 30-day implied is relative to where it's been over the last 52 weeks); the second, 30-day implied; and the third, what the February 19th at-the-money short straddle is paying as a function of stock price.

Daily Market Update for 12/30Trend lines drawn from the 10/30 bottom (42d), 12/23 (5d) and today 12/30 (1d).
Ideas always welcome in the comments. Errors will be amended as comments on TradingView or and corrected inline in my blog.
-=x=-=x=-=x=-=x=-=x=-=x=-=x=-
Wednesday, December 30, 2020
It took me so long getting back to my right mind.
Facts: +0.15%, Volume higher, Closing range: 18%, Body: 54%
Good: Stayed above yesterday's low
Bad: Longer upper wick, closing range near bottom
Highs/Lows: Lower high, higher low
Candle: Outside day, >50% red body, longer upper wick
Advance/Decline: 2.24, more than two advancing stocks for every declining stock
Sectors: Energy (XLE +1.57%) and Materials (XLB +1.38%) are top. Communications (XLC -0.67%) was bottom.
Expectation: Lower
-=x=-=x=-=x=-=x=-=x=-=x=-=x=-
Market Overview
It's been a third day of rotation in the market as the money that supported a move from smaller-caps to larger-caps on Monday transitioned back to smaller-caps today (small and mid-caps). The result was a larger breadth of stocks advancing, but a bearish looking inside day for the Nasdaq. The index closed up +0.15% on higher volume. That was the good news. The closing range of 18% and 54% red body point to a more bearish view of the day. More than two stocks advanced for every declining stock.
-=x=-=x=-=x=-=x=-=x=-=x=-=x=-
Indexes and Sectors
All major indexes were up for the day with the Russell 2000 (RUT +1.05%) leading with the biggest gain. The S&P 500 (SPX +0.13%) and the Dow Jones Industrial (DJI +0.24%) also had gains. Each of the indexes had inside days where the low was higher than the previous day's low, but the high is lower than the previous day's high. The RUT is the only index that showed a bullish character in the candle.
Energy (XLE +1.57%) and Materials (XLB +1.38%) were the leading sectors, likely given a boost by the Crude Oil Inventories data, which was lower than expected, revealing a surprising level of demand. Communications (XLC -0.67%) was the bottom sector, a change from the past two days where the sector has done well.
The VIX volatility index declined by -1.34%.
-=x=-=x=-=x=-=x=-=x=-=x=-=x=-
Market Indicators
Yields declined on US 30y, 10y and 2y treasury bonds. The spread between long term and short term bonds tightened slightly. The bond market has been up and down slightly, but acting fairly consistent the past two weeks.
Corporate bond prices (HYG +0.21%) rose for the day, widening the yield spread with short term bonds (IEI +0.08%).
The US dollar (DXY -0.35%) dropped for the day. It's again testing the support level from early 2018.
Silver (SILVER +1.54%) and Gold (GOLD +0.86%) advanced for the day. Crude Oil futures (CRUDEOIL1! -0.26%) declined, despite the positive inventories data. Timber (WOOD +0.69%) advanced, continuing a week-long uptrend. Copper (COPPER1! -0.39%) declined while Aluminum (ALI1! +0.60%) advanced.
The put/call ratio rose to 0.629. The put/call ratio (PCCE) is a contrarian indicator that shows overly bullish or overly bearish investor behavior. The 0.7 level is considered normal. As it approaches 0.60 (overly bullish) and below, watch for a possible pullback in the market.
-=x=-=x=-=x=-=x=-=x=-=x=-=x=-
Market Leaders
The biggest four mega-caps all declined for the day. Apple (AAPL -0.85%), Microsoft (MSFT -1.1%), Amazon (AMZN -1.09%), and Alphabet (GOOGL -1.22%) dropped back from recent gains. Alphabet closed back below its 21d EMA but remains above its 50d MA.
Several mega-caps did very well. Tesla (TSLA +4.32%) set a new all-time high before falling back just beneath the previous all-time high. Taiwan Semiconductor (TSM +3.16%) and Walt Disney (DIS +2.18%) also had great gains. Mastercard (MA +2.56%) and Visa (V +1.86%) both had very positive days. Facebook (FB -1.77%) and Netflix (NFLX -1.18%) led the Communications sector lower.
Several growth stocks reversed the weeks earlier declines. Digital Turbine (APPS +7.55%), Fiverr (FVRR +3.75%) and Solar Edge (SEDG +3.61%) were among the top gainers. Also NIO (NIO +4.85%) and JD.com (JD +3.92%) are among Chinese stocks that have done well in the past two sessions, perhaps due to trade agreements between the European Union and China.
-=x=-=x=-=x=-=x=-=x=-=x=-=x=-
Looking ahead
Thursday will be the last trading session of the year. New Years Eve!
New employment data will be released prior to market open on Thursday.
No notable earnings announcements are scheduled for Thursday.
-=x=-=x=-=x=-=x=-=x=-=x=-=x=-
Trends, Support and Resistance
The long-term trend line from the 10/30 bottom points to a +1.19% gain, while the five-day trend points to a smaller gain of +0.42%.
If the market follows the one-day trend it would be a sideways move that results in a -0.06% loss.
It seems the market is actually holding up well, despite the series of red candles. However, if the index moves down, there seems to be a support level from 12,450 to 12,550 (has not been tested much) where the index can pause during a pullback. The previous support level is around 12,250.
-=x=-=x=-=x=-=x=-=x=-=x=-=x=-
Wrap-up
The three red candles for the week are a bit tricky to figure out. They look bearish, but keep in mind that the low of this week is above the close of the previous week. The candles are more representative of the heavy rotation among small and large cap segments.
I've set the expectation for Lower the past two days. That is based on the candles and not so much a bearish view of the market.
There is no concerning level of defensive plays within the equity markets or in safe havens such as treasury bonds. In fact, investors are buying up corporate bonds as they see economic recovery coming.
The US dollar is still weakening and that is something to watch for as some weakening is good, but excessive weakening would likely cause corrective actions that would put pressure on equity markets.
I'm looking for the market to confirm my bullish view by breaking the expectation of Lower in today's analysis. At the same time, a Lower move that doesn't breakthrough support levels is certainly acceptable.
Stay healthy and take care!

Russell 2000 index is fighting against 3 major resistanceslet's see what happens the next week maybe a correction is coming, what do you think?

Daily Market Update for 12/29Trend lines drawn from the 10/30 bottom (41d), 12/22 (5d) and today 12/29 (1d).
Ideas always welcome in the comments. Errors will be amended as comments on TradingView or and corrected inline in my blog.
-=x=-=x=-=x=-=x=-=x=-=x=-=x=-
Tuesday, December 29, 2020
It's coming down on me
Water like misery
Facts: -0.38%, Volume lower, Closing range: 19%, Body: 76%
Good: New all-time high, held support above 12,800
Bad: Long red body, selling from open to close
Highs/Lows: Higher high, lower low
Candle: Long red body, short upper and lower wick
Advance/Decline: 0.41, more than two declining for every advancing stock
Sectors: Health (XLV +0.47%) and Consumer Discretionary (XLY +0.03%) are top. Real Estate (XLRE -0.77%) was bottom.
Expectation: Lower
-=x=-=x=-=x=-=x=-=x=-=x=-=x=-
Market Overview
The Nasdaq started the day by setting a new all-time high but quickly reversed downward and sold off the rest of the day. Still, it held above the 12,800 area which seems to be new support. The index closed with a -0.38% loss on lower volume. The closing range of 19% and 76% red body show the high open and intraday move to close near the low. Over two stocks declined for every advancing stock on the Nasdaq.
-=x=-=x=-=x=-=x=-=x=-=x=-=x=-
Indexes and Sectors
The S&P 500 (SPX -0.22%) and Dow Jones Industrial (DJI -0.22%) also declined while the Russell 2000 (RUT -1.85%) had the biggest decline among the major indexes. There is lots of speculation on the declines with a popular opinion that investors are taking profits in the 2020 tax year vs waiting for the new tax code under Biden's administration, which is expected to be higher.
Health (XLV +0.47%) and Consumer Discretionary (XLY +0.03%) were the only sectors that had gains for the day. All other sectors lost with Real Estate (XLRE -0.77%) and Energy (XLE -0.77%) ending the day with the worst performance.
The VIX volatility index rose +6.36%.
-=x=-=x=-=x=-=x=-=x=-=x=-=x=-
Market Indicators
Yields rose on US 30y, 10y and 2y treasury bonds. The spread between long term and short term bonds widened slightly.
Corporate bond prices fell slightly, widening the yield spread with short term bonds.
The US dollar (DXY -0.38%) dropped for the day.
Silver (SILVER -0.02%) stayed about even while Gold (GOLD +0.26%) advanced for the day. Crude Oil futures (CRUDEOIL1! -0.37%) declined. Timber (WOOD 0.09%) declined slightly. Copper (COPPER1! -0.60%) and Aluminum (ALI1! -1.01%) both declined.
The put/call ratio rose to 0.629. The put/call ratio (PCCE) is a contrarian indicator that shows overly bullish or overly bearish investor behavior. The 0.7 level is considered normal. As it approaches 0.60 (overly bullish) and below, watch for a possible pullback in the market.
-=x=-=x=-=x=-=x=-=x=-=x=-=x=-
Market Leaders
Only Amazon (AMZN +1.16%) advanced of the four biggest mega-caps. Apple (AAPL -1.33%), Microsoft (MSFT -0.36%) and Alphabet (-0.91%) all declined for the day. It's worth noting that each of these mega-caps put in a higher high and a higher low for the day, continuing uptrends. Alphabet retested its 21d EMA, but closed above the key support line.
Overall, it wasn't a bad day for mega-caps. There were big gains like Alibaba (BABA +6.25%), Intel (INTC +4.93%) and Netflix (NFLX +2.26%). Losses included Salesforce.com (CRM -0.97%), Home Depot (HD -1.14%) and PayPal (PYPL -1.99%).
Growth stocks had another day of selling as a rotation continues from smaller-cap to larger-cap segments. Sumo Logic (SUMO -5.37%), Digital Turbine (APPS -4.98%) and Square (SQ -4.18%) were among the bigger losses. On positive side, SNAP (SNAP +6.15%) rose on a price target increase from Goldman Sachs. Chinese stocks JD.com (JD +5.55%) and NIO (NIO +4.72%) joined Alibaba in good gains for the day.
-=x=-=x=-=x=-=x=-=x=-=x=-=x=-
Looking ahead
Several releases of economic data will come tomorrow. Goods Trade Balance and Retail Inventories for November will be released ahead of market. Pending Homes Sales for November and Crude Oil Inventories will be released after market open.
No notable earnings announcements are scheduled for Wednesday.
-=x=-=x=-=x=-=x=-=x=-=x=-=x=-
Trends, Support and Resistance
The long-term trend line from the 10/30 bottom points to a +1.13% gain. The five-day trend is just below that line at a +0.64% gain.
If the market follows the one-day trend it would mean a -0.58% loss.
It seems the market is actually holding up well, despite how it may feel for growth investors. If the index moves down, there seems to be a support level from 12,450 to 12,550 (has not been tested much) where the index can pause during a pullback. The previous support level is around 12,250.
-=x=-=x=-=x=-=x=-=x=-=x=-=x=-
Wrap-up
It was a second day of selling off stocks that have done exceptionally well in 2020. It could be investors taking profits to be taxed in this year vs waiting for the Biden administration to change the tax code in 2021. It does not seem to be any nervousness of investors, since all indications are that money is staying in equities, but moving between cap segments and industry sectors.
Stay healthy and take care!

Daily Market Update for 12/28Trend lines drawn from the 10/30 bottom (40d), 12/21 (5d) and today 12/28 (1d).
Ideas always welcome in the comments. Errors will be amended as comments on TradingView or and corrected inline in my blog.
-=x=-=x=-=x=-=x=-=x=-=x=-=x=-
Monday, December 28, 2020
Oh I bet you think you're John Wayne
Facts: +0.74%, Volume higher, Closing range: 70%, Body: 15%
Good: New all-time high, filled morning gap, closed in upper half
Bad: Could not close above open
Highs/Lows: Higher high, higher low
Candle: Dip in morning caused long lower wick, thin body in upper half
Advance/Decline: 1.08, about even advancing and declining stocks
Sectors: Communications (XLC +1.80%), Consumer Discretionary (XLY +1.14%), Technology (XLK +1.13%) were top. Energy (XLE -0.63%) was the worst performing, the only losing sector.
Expectation: Sideways or Higher
-=x=-=x=-=x=-=x=-=x=-=x=-=x=-
Market Overview
The Nasdaq came back from a long weekend with a gap-up on stimulus news that quickly sold-off to fill the gap. It then rose into the afternoon to set a new all-time high and then finish with a bit of selling late in the session. The index closed with a +0.74% gain. The closing range was 70% with a thin body of 15% in the upper half of the candle. Volume was higher, but only compared to a short session on Thursday. There were just a bit more advancing stocks than declining stocks.
-=x=-=x=-=x=-=x=-=x=-=x=-=x=-
Indexes and Sectors
The S&P 500 (SPX +0.87%) and Dow Jones Industrial (+0.68%) both stayed above their open prices, leaving morning gap-ups open. The Russell 2000 (RUT -0.38%) had losses for the day. Perhaps a bit of "sell the news" on the stimulus being signed, which supported small businesses. That support was likely already priced in.
Communications (XLC +1.80%), Consumer Discretionary (XLY +1.14%), and Technology (XLK +1.13%) were the top sectors of the day. Materials (XLB -0.39%) and Energy (XLE -0.63%) were the worst performing, the only losing sector. Energy led in the first 30 minutes of trading but then quickly sold off.
The VIX volatility index rose +0.79%.
-=x=-=x=-=x=-=x=-=x=-=x=-=x=-
Market Indicators
Yields on the US 30y and 10y treasury bonds dropped for the day while the 2y treasury bond yields rose. The yield spreads tightened slightly between long term and short term bonds
Corporate bond prices rose again with the HYG at its highest point since early March. Corporate bonds rose faster than short term bonds, tightening the yield spread between the two.
The US dollar (DXY +0.08%) dropped for the day.
Silver (SILVER +1.55%) advanced while Gold (GOLD +0.31%) declined for the day. Crude Oil futures (CRUDEOIL1! -0.39%) declined. Timber (WOOD +0.53%) rose and is trending up for four days. Copper (COPPER1! -0.15%) declined and Aluminum (ALI1! +0.0%) stayed even.
The put/call ratio dropped to 0.591. The put/call ratio (PCCE) is a contrarian indicator that shows overly bullish or overly bearish investor behavior. The 0.7 level is considered normal. As it approaches 0.60 (overly bullish) and below, watch for a possible pullback in the market.
-=x=-=x=-=x=-=x=-=x=-=x=-=x=-
Market Leaders
The four largest mega-caps outperformed the index today. Amazon (AMZN +3.51%) and Apple (AAPL +3.58%) were the top performers. Microsoft (MSFT +0.99%) and Alphabet (GOOGL +2.3%) also had gains. Alphabet closed above its 21d EMA, after meeting the line with resistance the last several sessions. Having all four mega-caps performing well and above these key moving averages is good support for the broader market.
Facebook (FB +3.59%) and Walt Disney (DIS +2.95%) were also top performers among mega-caps, which as a group did very well for the day.
Most growth stocks did not have a good day as rotations took money elsewhere. Stocks such as Cloudflare (NET -8.80%), Fiverr (FVRR -8.23%) and Fastly (FSLY -7.46%) were among the worst hit by the rotation. Even Peloton (PTON -6.48%) that has had recent momentum, sold off sharply.
-=x=-=x=-=x=-=x=-=x=-=x=-=x=-
Looking ahead
Tomorrow's biggest economic news will be the Consumer Confidence number for December. In the afternoon, an update on Crude Oil Stock will provide insight on demand during the holiday season.
No notable earnings announcements are scheduled for Tuesday.
-=x=-=x=-=x=-=x=-=x=-=x=-=x=-
Trends, Support and Resistance
There are times where all the trend-lines point to the same spot which is about a +0.60% gain.
If the index moves down, there seems to be a support level from 12,450 to 12,550 (has not been tested much) where the index can pause during a pullback. The previous support level is around 12,250.
-=x=-=x=-=x=-=x=-=x=-=x=-=x=-
Wrap-up
It was a tough day if you were holding any of the popular 2020 growth stocks. Many of them sold off sharply. Rotations usually swing back the other direction in a few days.
Many of the growth stocks that are seen as COVID stocks (benefited from the pandemic) have businesses that will continue to grow beyond the pandemic. But sometimes the market needs a little proof before it trusts that will happen.
Stay healthy and take care!

OPENING: IWM JANUARY 15TH 163 SHORT PUT... for a 1.93/contract credit.
Notes: Selling premium in the broad market exchange-traded fund with the highest 30-day implied, which is IWM/RUT. ROC: 1.2% at max; 9.7% annualized. Will take profit on approaching worthless or roll for duration/sell call against if in the money at expiry.

TZA?I believe this chart is self explanatory. I'm suggesting that it would be a good time to scoop up some TZA Shares. Please comment and let me know what your thoughts are. This is not investment advice.

Market Week In Review - 12/21/2020 - 12/24/2020The Market Week in Review is my weekend homework where I look over what happened in the previous week and what might come in the next week. It helps me evaluate my observations, recognize new data points, and create a plan for possible scenarios in the future.
I do occasionally have some errors or typos and will correct them in my blog or in the comments on TradingView. I do not have an editor and do this in my free time.
If you find this helpful, please let me know in the comments. I am also more than happy to add new perspectives and data points if you have ideas.
The structure is the following:
A recap of the daily updates that I do here on TradingView.
The Meaning of Life, a view on the past week
What's coming in the next week
The Bullish View, The Bearish View
Key index levels to watch out for
Wrap-up
If you have been following my daily updates, you can skip down to the “The Meaning of Life”. If not, then this first part is a great play-by-play recap for the week. Click the original charts for more detail each day.
-=x=-=x=-=x=-=x=-=x=-=x=-=x=-
Monday, December 21, 2020
You better watch out. You better not cry.
Facts: -0.10%, Volume lower, Closing range: 96%, Body: 65%
Good: Support at 12,500, close near highs
Bad: Gap down at open, LH/LL
Highs/Lows: Lower high, Lower low
Candle: Gap down to upside reversal, tiny upper wick
Advance/Decline: 0.80, more declining stocks than advancing stocks
Sectors: Financials (XLF +0.81%). All other sectors lost. Energy (XLE -3.22%) worst performing.
Expectation: Sideways or Higher
The Nasdaq opened with a gap down as investors looked nervously upon a new mutant COVID virus in the UK that shut down travel and crushed European indexes. The lows of the day were short lived and the Nasdaq climbed to afternoon highs that almost went above Friday's close. Stock prices recovered on enthusiasm for a stimulus bill passing in congress. The Nasdaq closed with a -0.10% loss, a sideways move compared to the morning lows. Volume was lower than Friday's huge volume, but still above average volume. The closing range of 96% and a 65% green body make it a bullish day despite the small loss. There were more declining stocks than advancing stocks, something that we'll watch for change later this week.
-=x=-=x=-=x=-=x=-=x=-=x=-=x=-
Tuesday, December 22, 2020
Up on the housetop, reindeer pause.
Facts: +0.51%, Volume higher, Closing range: 78%, Body: 16%
Good: New ATH, close higher than open, higher volume
Bad: Dip after morning high
Highs/Lows: Higher high, higher low
Candle: Opening gap filled by long lower wick, small body in upper part of candle
Advance/Decline: 1.20, more advancing stocks than declining stocks
Sectors: Technology (XLK +0.87%) and Real Estate (+0.70%) were top. Energy (XLE -1.68%) worst performing.
Expectation: Sideways or Higher
The Nasdaq opened a positive session with a gap up driven by optimism for the recovering economy. GDP data came in higher than expected and the stimulus bill is passing through congress with some certainty of passing. That optimism was tempered a bit mid-morning after Consumer Confidence and Existing Home Sales data was lower than expected. Eventually the bulls came back in and the index gained 0.51% for the day on higher volume. The closing range was 78% and the 16% green body is in the upper half of the candle. More stocks advanced than declined.
-=x=-=x=-=x=-=x=-=x=-=x=-=x=-
Wednesday, December 23, 2020
Oh, bring us a figgy pudding.
Facts: -0.29%, Volume higher, Closing range: 15%, Body: 77%
Good: Higher high and Higher low, bulls held the gap
Bad: Bearish candle, Sell-off near close
Highs/Lows: Higher high, higher low
Candle: A full red-body candle with short wicks, closes within the gap from Mon/Tue.
Advance/Decline: 1.72, three advancing for every two declining stock
Sectors: Energy (XLE +2.21%) and Financials (XLF +1.65%) were top. Real Estate (XLRE -0.95) and Technology (XLK -0.76%) worst performing.
Expectation: Sideways
All things considered, it could have been a lot worse. Trump's threats to veto the stimulus bill seemed to have little impact at open. Initial Jobless Claims came in lower than expected. Despite a dip in personal spending and new home sales, the Nasdaq rose through the morning to make a new all-time high in the afternoon. It then turned and sold off sharply in the final minutes before close.
The index finished down -0.29% on higher volume. The closing range of 15% and 77% red body show a bearish day. On the positive side, bulls held the gap created between Monday and Tuesdays session and there were three advancing stocks for every declining stock.
-=x=-=x=-=x=-=x=-=x=-=x=-=x=-
Thursday, December 24, 2020
Have yourself a merry little Christmas
Facts: +0.26%, Volume lower, Closing range: 56%, Body: 20%
Good: Stayed within tight range, despite bad news on stimulus
Bad: Not much
Highs/Lows: Lower high, higher low
Candle: Inside day, thing body in middle of candle counts for an indecisive session
Advance/Decline: 0.95, about even advancing and declining stocks
Sectors: Real Estate (XLRE +0.98%) and Utilities (XLU +0.71%) were top. Energy (XLE -0.52) was the worst performing, the only losing sector.
Expectation: Sideways
Merry Christmas Eve! The shortened session for the Nasdaq was mostly indecisive with the close just above the open and about an even amount of advancing and declining stocks. Investors didn't seem to worried with bad news around the stimulus, possibly helped by good news from Europe on a Brexit deal. The index closed with a +0.26% gain with a 56% closing range and a 20% green body in the middle of the candle. The volume was lower as expected.
-=x=-=x=-=x=-=x=-=x=-=x=-=x=-
The Meaning of Life (View on the Week)
Merry Christmas!
The short trading week was not without excitement. There was good news and bad news for the pandemic, the stimulus bill and Brexit agreements. The Nasdaq rode the news up and down but eventually closed the week with a +0.38% gain. The closing range of 88% and 66% green body show another bullish week in a long rally.
The Russell 2000 (RUT) continues to outperform the other indexes with a +1.72% weekly gain. The Dow Jones Industrial (DJI) gained +0.07% while the S&P 500 (SPX) lost -0.17% for the week. The VIX volatility index dropped -0.19%, but had a wild week with a high 50% above the close due to Monday's volatile open.
Monday started with a gap-down caused by fresh lockdowns in Europe after a new mutant of the COVID virus emerged in the UK. The gap-down turned into a fairly bullish session as the indexes recovered much of the morning losses in the afternoon. The big day for growth investors was Tuesday, powered by an agreement in congress on the final stimulus bill.
Those hopes would be soon squashed as President Trump declared he would veto the bill, calling it a "disgrace". But that there was a silver lining in that stimulus checks might actually be bigger if Trump got his way. Wednesday's session saw Financials and Energy sectors take the lead.
Thursday's short session was muted on lower volume. Republicans in congress rejected the idea of bigger stimulus checks, risking a potential government shutdown come Monday. There was a bit of defensiveness in the market as we head into a long weekend but there was not a big sell-off on the bad news. Overall, the day was indecisive in direction to end the week.
The weekly chart shows the rally that we've had since the beginning of November. The average closing range for the last eight weeks is 77%, with each of the last 5 weeks resulted in a higher high and a higher low for the week. Despite some distribution days along the way, the market is still clearly in an uptrend.
Financials ( XLF ) was the big winner of the week. The fed stress test last week resulted in banks being allowed to resume share buy bank programs, giving some tailwinds to the sector.
Technology ( XLK ) took the lead on Tuesday, but fell back into second place at the open on Wednesday.
All other sectors underperformed the S&P 500 for the week.
Energy ( XLE ) was the leading sector for Wednesday's session but was the worst performing sector on the other days, coming in last for the week.
US Treasury Bond Yields dropped for the week. The spreads between long term and short term bonds tightened slightly. The US 30y and US 10y yields are both in uptrends as investors are not interested in the long term bonds. The US 2y yield is in a sideways to downward trend.
Prices for corporate bonds (HYG) continues to trend upward while short-term treasury bond prices (IEI) continue to move sideways, signaling confidence in the economy from investors.
The US dollar (DXY) advanced +0.1% for the week. The dollar is at a support/resistance area formed in the first quarter of 2018.
The put/call ratio (PCCE) ended the week at 0.670. The level is more comfortable than the overly bullish levels seen in recent weeks. A contrarian indicator, when the put/call ratio is below 0.7, it signals overly bullish sentiment which typically proceeds a pullback in the market. The indicator was at 0.458 just before the September correction and it was at 0.489 just before the short October correction.
Silver (SILVER) was up +0.03% for the week while Gold (GOLD) declined -0.10% for the week. Crude Oil was down -1.17% as fears of new lockdowns caused oil futures to drop. Timber (WOOD) was down -0.75%. Copper (COPPER!1) pulled back with a -1.65% loss while Aluminum (ALI1!) declined -1.85%. These commodities show a little less bullishness in the market than the previous week, but are still in good upward trends. Speculative data to be released on Monday will show more insight into investor sentiment in the commodities.
Of the four largest mega-caps, only Amazon (AMZN) closed the week with a loss, declining -0.90% for the week. Apple (AAPL) had a big week, gaining +4.20% after news of an electric vehicle caused a gap-up at Tuesday open. Alphabet was up +0.46% for the week, but could not close the week above its 10w moving average line. Microsoft (MSFT) gained +1.90%.
Tesla (TSLA) dipped almost 12% after Monday's addition to the S&P 500, but regained ground later in the week to close the week with a -4.78% loss.
Peloton (PTON) gapped up on Tuesday after announcing they would acquire Pecor. The acquisition brings them additional manufacturing growth while targeting existing Pecor customers for subscription growth.
-=x=-=x=-=x=-=x=-=x=-=x=-=x=-
The Week Ahead
Data on speculative positions in commodities will be released on Monday. The speculative positions among investors can show sentiment for future growth areas in the economic recovery.
Tuesday will bring an update on Consumer Confidence for December, while Pending Home Sales data will be released on Wednesday.
Markets will be closed on Friday for the New Year's Holiday.
There are no notable earnings reports in the next week.
-=x=-=x=-=x=-=x=-=x=-=x=-=x=-
The Bullish Side
Another week of higher highs and higher lows.
The equity markets continue to hold up even as bad news could have a negative impact. Monday was a great example. In the face of new pandemic lockdowns and travel restrictions in Europe, the US markets gapped-down but then quickly recovered during the day. The continuation of QE from the Fed and the promise of new stimulus is keeping the markets from overreacting on the downside.
GDP came in higher than expected, showing the economic engine is recovering faster than previously thought.
US Treasury Bonds yields continue to trend higher as investors are not interested in the safe haven asset. Corporate Bond yields trend lower, signaling confidence in the US economic recovery and the ability for companies to weather the short term challenges. Even defensive plays in equities, such as the Utilities sector, were not seen this past week despite heading into a long holiday weekend.
The US Dollar rose a bit this week as the Euro declined on the new lockdown news. However, it continues to trade near the 2018 lows, giving a boost to large multi-national companies that can benefit from a lower valued greenback.
A new vote on the stimulus will come on Monday. Passing the stimulus will build on investor confidence as we move into the new year.
With the huge gains that many investors incurred in this year, we can expect they want to hold until January before selling. That may be a bad omen for January, but can be bullish support for the coming week.
-=x=-=x=-=x=-=x=-=x=-=x=-=x=-
The Bearish Side
The stimulus bill in congress has another vote coming on Monday. A vote against the bill could sour investor sentiment for the economy. On top of that, it makes a government shutdown almost inevitable. Although shutdowns don't always negatively impact the stock market, it could result in a short-term negative reaction.
Even as vaccine distribution continues, hospitals are fearing a surge in severe coronavirus cases after the holidays. New outbreaks and over-capacity in hospitals could prompt new lockdowns in epicenter areas. Any evidence of the mutant virus from the UK, could cause a reaction in markets.
Consumer Confidence, Personal Spending and Existing/New Homes Sales dipped more than expected this past week. That could signal a holiday shopping season that was more negatively impacted than expected for retailers. The lack of stimulus checks would put more downward pressure on consumer spending.
After several weeks of higher highs and higher lows, the market could be due for more of a pullback. The 50d moving average line is about 6.5% below Thursday's close.
-=x=-=x=-=x=-=x=-=x=-=x=-=x=-
Key Nasdaq Levels to Watch
There are several key levels in the Nasdaq to keep an eye out for and respond accordingly. First on the positive side:
The high of Wednesday at 12,841.92 will be the first test. A new high to start the week would be a positive sign to continue the current rally.
The next round-number resistance could come at 13,000. Round-number resistance is caused by traders’ tendency to put in sell orders at round numbers.
On the downside, there are several key levels to raise caution flags:
12,525.221 is the low of this week. Staying above the low would put in another week of higher lows.
12,600 may be a new support/resistance area. That area has shown up in the open and closes of several days the past few weeks.
The 21d EMA is at 12,490.40. The index has closed above this moving average line for the last 36 trading days.
The support area of 12,250 is the next support area. Hopefully, that area will hold the index above that price level.
The 50d MA is at 11,976.25. That is 6.5% below Friday's close. Testing the 50d MA will make a lot of investors nervous, already causing a big hit to portfolios.
November support area is at 12,000 and a round-number point. A move below this line would raise more flags for investors.
September Support line is at 11,300. Dropping to this level would be a sure sign of correction.
-=x=-=x=-=x=-=x=-=x=-=x=-=x=-
Wrap-up
Here comes the last trading week of 2020. Although the gains have been many this past year, let's hope for a little less drama in 2021.
Good luck, stay healthy and trade safe!