BTC, SPX, RUT wide gap from HYG. We're up for a rude awakening dear fellows,
it came to our attention the monthly chart of HYG, BTCUSDT, SPX, RUT. they all belong to the same class of speculative assets.
of them, HYG is likely to have the greatest demand for liquidity as it lives out of refinancing its cash flow, let alone its debt.
notice how
1. they are synchronized in what concerns the bottoms
2. HYG renewed the lows at each new bottom, never the highs at each top.
3. the others did the opposite
this mismatch opened up a wide gap in the logarithmic scale of the y axis.
the logarithmic scale shows how much percentually current level still can fall.
thus, BTC, SPX and RUT still can fall more than they did already until they catch up with HYG.
that is precisely the case of FED keeping current policy "until something brakes".
that would be a rude, late, awakening for anyone not knowing where to look at for market health check.
best regards.
RUSSELL 2000

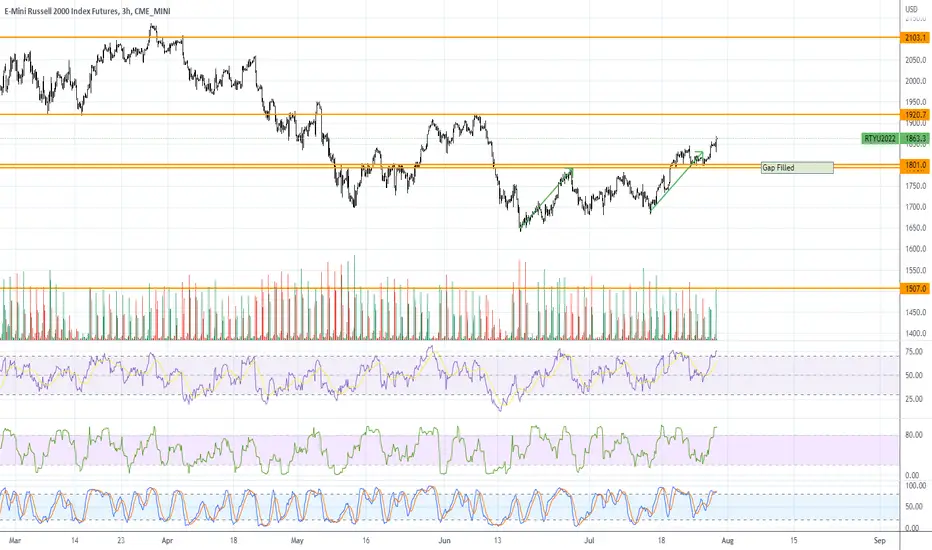
RTY UpdateOverbought on MFI and RSI on my short term chart, NQ and ES RSI are just barely touching overbought so gonna wait until tomorrow to short.
Slept in because I missed the long boat yesterday, lol. No positions. At this point it's a bit late to chase the pump.

RUT Russell 2000 Double BottomA double bottom is a reversal chart pattern in technical analysis that describes a change in trend.
RUT Russell 2000 is oversold at the pre-covid level right now on a double bottom chart pattern.
My price target is $1805.
Looking forward to read your opinion about it.

Russell 2000 / M2 Money Supply: Discounted to 500 MVA & @support"Russell 2000 / M2 Money Supply" ratio
1) It moves in a horizental trend in the long-term.
2) %20 discounted compared to 500 days MVA.
3) Nearly touched a major long-term horizental support.
Of course it can also move more downwards if the crisis/war deepens but we can say that the probability of upwards move is more likely.
First target: 0.095-0.100

Is $SPX bound for a crash or a small bounceI'm torn about this. from the top to down move thus far, the SPX has had small bounces along the way, as buyers come in, ride up the rally, then get burned.
My sentiment right now is that there is little tolerance to be burned for the third time, and data/world news appear to be getting worse at the moment, not better.
Of course these things can "resolve" themselves in the next couple of weeks but... in which case the SPX may rally a bit to around the 3920 level. The technical case for this is the fact that we're oversold and the MACD appears to want to make a turn higher from where it is right now on the daily.
But the case against this is that, apart from the various poor news out of NORD, China, Apple, Bonds and the like, it's never a good thing when SPX closes at a new low for what has been a very bearish 2022. The downside target at 3400 and 3200 can come pretty fast, with little to no resistance along the way, with the exception of 3550, as far as i can tell.
I'm bearish and will be looking at the moves in the next couple of sessions very carefully.

Russel 2000 Weekly Volatility Forecast 26-30 September Russel 2000 Weekly Volatility Forecast 26-30 September
Currently our volatility for Russel is at 4.3%, increasing from 3.76% last week, located on 70th percentile, placing us in a high volatility environment
Based on the previous calculations, there is currently a 16.7% chance that the asset is going to break the channel(the weekly candle it will close above/below)
TOP 1746
BOT 1620
At the same time, based on the previous calculations:
- There is a 28% chance that the previous high from last week of 1830 is going to be touched
- There is a 70% chance that the previous low from last week 1660 is going to be touched
We can deduct that we have a much higher probability to have a continuation of bearish candle than bullish.
On average the weekly candle when the asset was located around this percentile are 2.9% for bull candles and 2.95% for the bear candles from the opening price.
From the fundamental point of view, news that can affect this asset price this week:
- Core Durable release, CB Consumer confidence and Powell Speech for Tuesday 27 Sep
- Powell Speech for Wednesday 28 Sep
- US GDP and Jobless Claims coming on Thursday 29 Sep
- Core PCE on Friday 29 Sep
Overall I believe for this week there is higher chance due to the overall global activity to have another bearish weekly candle.

RTY - Reason Why I didn't short yesterdayFirst of all, I should've known EUro PMI was coming out, oops.
Anyways, I didn't short yesterday because RSI was touching oversold and this drop was already the same size as the previous drop. (Two red arrows) The fact that the drop is accelerating is bad news.

$RUT bearish inverted cup and handleLooks like $RUT is in trouble right now and trying hard to hold above the $1700 support level
bearish inverted cup and handle targets in chart


RTY UpdateMoney still flowing into small caps, and a bunch of garbage stocks look squeezy again like PTON for example.
Even if you're bearish, I don'rt recommend shorting anything with high short interest
No positions since I'm taking a break tomorrow.

Prefer to fade into the rally on US2000USDUS2000USD0 - Intraday - We look to Sell at 1860 (stop at 1895)
Although the bears are in control, the stalling negative momentum indicates a turnaround is possible. A higher correction is expected. The bias is still for lower levels and we look for any gains to be limited. We therefore, prefer to fade into the rally with a tight stop in anticipation of a move back lower.
Our profit targets will be 1775 and 1760
Resistance: 1815 / 1830 / 1840
Support: 1800 / 1790 / 1775
Risk Disclaimer
The trade ideas beyond this page are for informational purposes only and do not constitute investment advice or a solicitation to trade. This information is provided by Signal Centre, a third-party unaffiliated with OANDA, and is intended for general circulation only. OANDA does not guarantee the accuracy of this information and assumes no responsibilities for the information provided by the third party. The information does not take into account the specific investment objectives, financial situation, or particular needs of any particular person. You should take into account your specific investment objectives, financial situation, and particular needs before making a commitment to trade, including seeking advice from an independent financial adviser regarding the suitability of the investment, under a separate engagement, as you deem fit.
You accept that you assume all risks in independently viewing the contents and selecting a chosen strategy.
Where the research is distributed in Singapore to a person who is not an Accredited Investor, Expert Investor or an Institutional Investor, Oanda Asia Pacific Pte Ltd (“OAP“) accepts legal responsibility for the contents of the report to such persons only to the extent required by law. Singapore customers should contact OAP at 6579 8289 for matters arising from, or in connection with, the information/research distributed.'

Selling rallies on US2000USDUS2000USD - Intraday - We look to Sell at 1880 (stop at 1910)
Although the bears are in control, the stalling negative momentum indicates a turnaround is possible. We are trading at oversold extremes. The bias is still for lower levels and we look for any gains to be limited. We therefore, prefer to fade into the rally with a tight stop in anticipation of a move back lower.
Our profit targets will be 1790 and 1730
Resistance: 1830 / 1935 / 2025
Support: 1785 / 1730 / 1640
Risk Disclaimer
The trade ideas beyond this page are for informational purposes only and do not constitute investment advice or a solicitation to trade. This information is provided by Signal Centre, a third-party unaffiliated with OANDA, and is intended for general circulation only. OANDA does not guarantee the accuracy of this information and assumes no responsibilities for the information provided by the third party. The information does not take into account the specific investment objectives, financial situation, or particular needs of any particular person. You should take into account your specific investment objectives, financial situation, and particular needs before making a commitment to trade, including seeking advice from an independent financial adviser regarding the suitability of the investment, under a separate engagement, as you deem fit.
You accept that you assume all risks in independently viewing the contents and selecting a chosen strategy.
Where the research is distributed in Singapore to a person who is not an Accredited Investor, Expert Investor or an Institutional Investor, Oanda Asia Pacific Pte Ltd (“OAP“) accepts legal responsibility for the contents of the report to such persons only to the extent required by law. Singapore customers should contact OAP at 6579 8289 for matters arising from, or in connection with, the information/research distributed.'

RUT- Russell 2000 Mid Caps GOOD DAYS AHEADThe RUT ETF crashed with the COVID market phenomenon but then recovered better and faster than the SPY in 116 % of price appreciation
in less than the one year that followed. Since then RUT retraced about 1/2 of that uptrend.
Presently on the weekly chart, the price is relatively stable. The RSI bottomed out in the oversold territory and is now in mid-range
with RSI above its Ichimoku cloud. All of this is positive or at least not the overly negative of doom and gloom.
I believe that it will soon be time to begin a dollar cost averaging into some long-term call options on RUT
as things are not as bad as the media, banks and large institutional players want to portray to retail traders and
investors.

90 Day Macro View
Increasingly, competitive crosscurrents are creating notional Equity Directional disturbances.
A large number of Investors/Traders have convinced themselves the Federal Reserve was attempting
to Bluff the Markets.
Running Indexes up off the Mid-June at the greatest rate of change in history once the SloMo began
to move through its varying psychological attributes. Momo gave way to Fomo which quickly reversed
off Resistance overhead.
Normal behavior, so far.
______________________________________________________________________________________________
The underlying Malfunction is beginning to see signs of light in the tunnel of love.
Powell's recent admission will not repeat Arthur Burns's misdeeds of the past provided an interesting tell.
_______________________________________________________________________________________________
We can expect to see broader Market Ranges in the coming 90 Days as confusions abound and will be resolved.
Permit me to explain.
The FOMC Minutes were Negative as FOMC Participants observed Inflation remains unacceptably high.
Reduction of Treasury and Agency Debt was re-affirmed.
EFF vs IR @ 2.53 versus 8.5%+ - 600 Basis Points and 237% Divergence while the Objective remains 2%. If
we were to factor in the BLS Basis adjustment (Jan. 1, 2022) - it is easily Double.
Although they indicated the potential for a pause may be within their purview... the catch is they remain
Data-dependent. A nebulous and arbitrary hedge.
Aggressive EFF Increases with a pause somewhere on the Horizon was my takeaway.
The additional admission of a weakening Consumer provided the coup de gras for Data Dependence.
Building a better box for further confusion and delay.
EFF vs 2YY @ 2.53 vs. 3.28 does indicate a 75 BPS Hike for September, not 50 BPS - at present with the
Yield Curve Inverted out to the 7's.
_______________________________________________________________________________________________
Where is the FED indicating they need to bring EFF... 3.5 to 4%.
I've paid close attention to the QT Schedule - which has remained rather jiggy. Prior to June 15th, we observed
the Fed begin the largest reduction in some time. Effectively reducing the Balance Sheet by $81B while $90B
was to have been removed by August 15th.
Remember, on September 15th they stated reductions were to increase to $60B / Month. A significant increase
over notional distributions since June 15th.
Measures of Liquidity have come down significantly, clearly, the FED is concerned about a dislocation now.
MBS Markets have seized up. M2 Velocity is at its lowest reading, many Mortage lenders are on the verge of
Insolvency, M2 is in its 5th month of contraction - all of this has been roundly ignored by Invertors / Speculators.
Quantitative Tightening has tread ever so lightly with the specter of a looming 100% increase in the Balance Sheet
reductions per month.
The FED is moving at a glacial pace as Economic Conditions have weakened precipitously.
For context, it is important to remember - Assets on the FED's balance sheet were $4.16Trillion prior to Covid.
MBS requires 90 Days to settle, The FED was buying up until June 15th knowing they had time to square into September
15th, this trick escapes Retail attention, understandably so as the FED never discloses these nuances.
For Treasuries, maturity is reached on the 15t and 30th/31st of each month, hence the rally off June 16th, there are
no accidents.
Mid-Month usually generates Liquidity issues around pivotal dates for Time, squaring occurs closer to Months end.
_______________________________________________________________________________________________
By the time we get to the first week of October, the Fed's roll-off will become extremely evident.
_______________________________________________________________________________________________
Investors have focused solely on Rates, one-half of the real FED Agenda.
QT is more important at this point, far more.
I indicated the effective break rate for the Indices would be 3.5% for the 10 Year Yield. We saw the results of this
level for the Indexes.
It is important to remember the Bulk of prior Funding from 2002 onward was done below 30 months on the curve,
increasing the refunding needs exponentially. Thank Timothy Bitsberger from Goldman for this, as it was an intentional
and extremely devious plan to collapse Debt over time.
QT will have an extreme effect on Liquidity at a time where Liquidity itself is coming under immense duress Globally.
_______________________________________________________________________________________________
The November FOMC may see a pause due to the Mid-Terms, we will see - Apolitical appearances and all.
They will not pause QT, it will remain ongoing as a background operation of vital importance.
_______________________________________________________________________________________________
Investors survived the first wave of FED Adjustments, they will not be imbued with the same again.
_______________________________________________________________________________________________
The most important communique from Jackson Hole will be how it directs Monetary Tightening to take effect
as Rates take a backseat to a further Liquidity Squeeze via QT.
Bulls want to believe the FED will back away - I'm leaning towards Economic Activity and its attendant Depression
remain pervasive.
Sentiment will begin to worsen.
The New Congress will not be seated until April 2023.
Any hope for Stimmy direct to Citizens/Consumers is DOA until then.
Global Economic conditions are rather Dire.

Why Chase the Wind?Some like running. Others like direction. Some just want to feel the breeze again. You will long for the past and try to repeat what you did to succeed, only to realize that nothing lasts forever.
I don't think this pattern of lower lows in percentages of bullish stocks, and higher lows in bitcoin price, will last forever. If money printing stops and lending dries up, maybe bitcoin will go sideways for a while? Although institutional selling has happened, did the crowd sell yet? I don't know. If it did, maybe the green divergence pattern plays out, otherwise the red might come true?
Considering that we reached 17% of stocks bullish, that could seem like some sort of bottom, as was the case in 2015. But this entire chart is focused on a bull equities market, and so it is not reasonable to adjust our expectations towards past results. In my opinion, we should only use it as a reference of severity or volatility. Lately there is this pattern of lower lows in the Percentage of Stocks, and if the market is truly bearish, we should get a low that is lower than 17%, the current low, as seems to be implied in the chart in a megaphone-like pattern (grey line). Maybe it won't go to 6% like in 2020, but I have a hard time believing that. What was going to play out then, clearly has not yet played out and was delayed via bailouts. One might consider that because of the severe volatility 2020, it is not reasonable to expect a lower low in the percentage of stocks, which I think is a reasonable consideration, but it is not clear yet if the bearish momentum has finished playing out in terms of stock prices, especially large caps.
Bitcoin price wise, I think we could linger on a bit here as neither bearish or bullish, but unless we make a higher low in the next few months (boring scenario, green), it will dip lower(red). I think 18.5k is a decent bottom for the neutral/bullish view(green), and ~6-12k is a decent bottom for the bearish view(red).
What scenario do you think will play out? Personally, I just want to wait and see if we set a bottom here, but there's been a big gamma squeeze the past few days and I closed out most of my longs in the past few days out of discomfort. So, not necessarily short, but not long either. There's a lot of uncertainty here and it's always good to take profit while you are ahead.
I like using the "Percentage of stocks" type symbols, it's a nice litmus test for the market. Hopefully you will find them useful. Some are not links but these are all symbols under the INDEX: category
200 day
MMTH
S5TH
R2TH
NDTH
50 day
MMFI
S5FI
R2FI
NDFI
20 day
MMTW
S5TW
R2TW
NDTW
Take care and don't forget to hedge your bets!
-your fringe chartist

RTY UpdateUnlike ES and NQ, RTY already hit oversold, and small caps tend to fill gaps. I'm looking at a bunch of crap stocks like W that seem to be acting like they want to fill the gap tomorrow or Monday.
IWM is probably your best bang for the buck if you're bullish on indices.
I would stay away from meme stocks, though it could be an up day for those as well.

RTY UpdateThe melt up and short squeeze continues. I have it continuing until next Tuesday when RTY hits the resistance zone.
I don't normally play melt ups but bought some AMC calls for kicks and giggles on the dips this morning. If the market is acting stupid, then you need to be stupid too, lol. The only way to make money is to go with the flow.
Prediction is up tomorrow, a dip Thu and Friday open, then full pumptardedness until Tuesday.

RTYIs the melt up over? Seems like RTY rolled over, and the squeeze appears to be over except meme stocks like AMC

8/10/22 URAGlobal X Uranium ETF ( AMEX:URA )
Sector: Miscellaneous (Investments Trusts/Mutual Funds)
Market Capitalization: $ --
Current Price: $21.60
Breakout Price: $21.80
Buy Zone (Top/Bottom Range): $21.45-$19.85
Price Target: $22.80-$23.20 (1st), $25.90-$26.50 (2nd)
Estimated Duration to Target: 30-32d (1st), 99-106d (2nd)
Contract of Interest: $URA 9/16/22 22c, $URA 10/21/22 22c
Trade price as of publish date: $1.05/contract, $1.50/contract

RUT scenariosRed arrow pretty much dialled in for me
Grey possible but unlikely
Going over 2k
NOT TARDING ADVICE
ps i'll get my coat

Keeping It SimpleThere's so much going on right now, but I think this chart sums it up for assets in general. This is a fairly simple idea I fantasized a while ago and it played out to my surprise. Every once and a while, the percentage of bullish stocks doubles, and then a selloff happens. Unless we can break this symmetry and make a clear break above 25, we should not expect anything special. It's easy to fomo in but possibly the best move is to move to other markets.
Also note the severity of the 2020 dump, before being launched by money supply expansion, among others:
We did not yet meet the level of the 2020 crash. Also, there is no money supply expansion this time. So, what would have happened in 2020 or perhaps 2008, should really happen this time, unless of course there is more money supply expansion.
Cheers and don't forget to hedge your bets!

RTY UpdateOverbought again after the morning dip, looks like a melt up and 4 day short squeeze so not shorting anything at the moment aside from the put leg of my BITO strangle. Calls are now in the money so hopefully crypto goes pumptarded on Ponzi payday Friday.
I'm 75% sure this is a melt up, but if you're long I suggest some protection.
7/27/22 FFord Motor Co ( NYSE:F )
Sector: Consumer Durables (Motor Vehicles)
Market Capitalization: 53.023B
Current Price: $13.19
Breakout price: $13.55
Buy Zone (Top/Bottom Range): $12.60-$10.90
Price Target: $14.80-$15.40 (1st), $17.90-$18.30 (2nd)
Estimated Duration to Target: 28-30d (1st), 70-74d (2nd)
Contract of Interest: $F 8/19/22 14c, $F 12/16/22 15c
Trade price as of publish date: $0.32/contract, $0.75/contract
