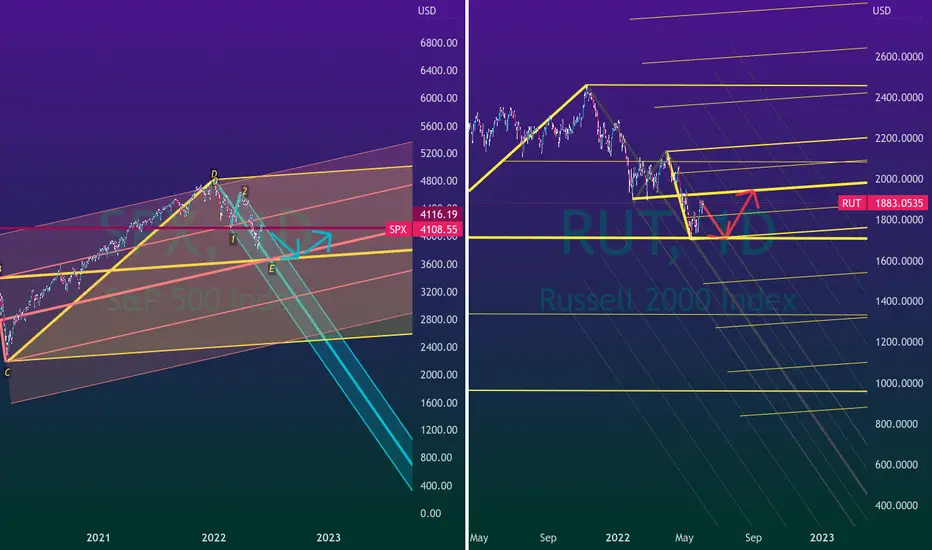
SPX vs RUTfollowing on from the last couple of ideas
rut looks bottomy
spx does not
overall i think we can expect a fast down and up
after that still not sure
of the two i'd take rut tho after the next move down
NOT TARDING ADVICE
GRI 2022
RUSSELL 2000
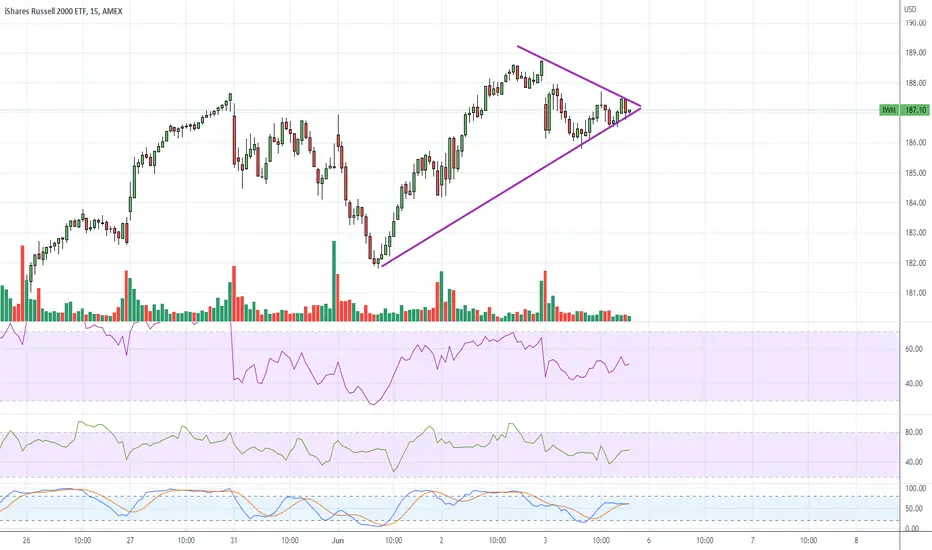
Indices forming an intraday pennantAppears to be an intraday pennant on the 4 major indices (SPX, NDX, DJI, Small Caps). Could go either way either way Monday.
I just have some PTON puts because it's total garbage, but even garbage will float on a rising tide. just a small play.
In any case, I don;t expect the market to do anything in the last hour, but we'll see. My futures indicators are still trending bearish.
RTY UpdateRTY and NQ MFI are overbought and it's starting to look a lot like my overlay.
We'll see what the algos do premarket, but looks pretty bearish, Euros did not pump as I expected.

Daily Market Update for 6/2Summary: Sentiment turned positive once again on Thursday, but volume was lower as analysts await Friday's employment data to add to a mixed bag of good and bad economic signals this week.
Notes
Ideas always welcome in the comments. Errors will be amended as comments on TradingView or corrected inline in my blog.
-=x=-=x=-=x=-=x=-=x=-=x=-=x=-
Friday, June 3, 2022
Facts: +2.69%, Volume lower, Closing Range: 99%, Body: 89% Green
Good: Higher close than Friday, 99% closing range, A/D ratio
Bad: Lower volume
Highs/Lows: Higher high, Higher low
Candle: Mostly green body with small lower wick
Advance/Decline: 2.17, more than two advancing stocks for every declining stock
Indexes: SPX (+1.84%), DJI (+1.33%), RUT (+2.31%), VIX (-3.78%)
Sector List: Consumer Discretionary (XLY +3.06%) and Materials (XLB +2.76%) at the top. Utilities (XLU +0.67%) and Energy (XLE -0.32%) at the bottom.
-=x=-=x=-=x=-=x=-=x=-=x=-=x=-
Market Overview
Sentiment turned positive once again on Thursday, but volume was lower as analysts await Friday's employment data to add to a mixed bag of good and bad economic signals this week.
The Nasdaq rose by +2.69% and closed higher than last week's high, keeping an uptrend intact. However, the volume was lower than the previous day. The candle has an 89% green body with a small lower wick and a 99% closing range leaving behind no upper wick. There were more than two advancing stocks for every declining stock.
The Russell 2000 (RUT) climbed by +2.31%. The S&P 500 (SPX) advanced +1.84%. The Dow Jones Industrial Average (DJI) ended with a +1.33% gain. The VIX Volatility Index fell by -3.78%.
Ten of the eleven S&P 500 sectors ended the day with gains. Consumer Discretionary (XLY +3.06%) had the biggest advance, followed by Materials (XLB +2.76%). The only declining sector was Energy (XLE -0.32%).
ADP Nonfarm Employment change for May showed jobs growing much slower than expected. The market added just 128,000 jobs compared to an expected 300,000. However, Initial Jobless Claims were lower than expected for the week. Unit Labor Costs continued to grow in Q1.
The change in Crude Oil Inventories showed much higher demand than expected with the balance changing by -5m barrels compared to the forecast of -1.4m barrels.
The US Dollar index (DXY) declined by -0.78%. The US 30y and 10y Treasury Yields rose while the 2y yield declined. High Yield (HYG) and Investment Grade (LQD) Corporate Bond prices both advanced. Brent Oil rose sharply to 117.33 a barrel despite dropping late on Wednesday. Copper Futures also rose sharply, gaining by +3.56% today.
The put/call ratio (PCCE) declined to 0.802. The CNN Fear & Greed index is in the Fear range but continues to move toward Neutral. The NAAIM money manager exposure index rose slightly to 34.33 from 33.19 the week prior.
All of the big six mega-caps gained today. Microsoft (MSFT) somehow ended the day with a gain despite dropping by -3% in the premarket after lowering Q4 guidance. Meta (FB) had the biggest gain, advancing by +5.42%. All six closed the day above their 21d EMA lines.
Nvidia (NVDA) was the top mega-cap for the day, gaining 6.94%. Costco (COST) was not far behind, advancing +6.70%. Eli Lilly (LLY) was at the bottom of the mega-cap list, falling by -2.78% today.
All of the stocks in the Daily Update Growth List gained today, but there were some big winners. Chewy (CHWY) topped the gains, soaring by +24.22% after beating revenue and earnings estimates. MongoDB (MDB) also beat on the top and bottom line, helping their stock rise by +18.56%. Six of the stocks in the list gained more than 10% and more than half of the list gained more than 5%. The smallest gain was by DoorDash (DASH), which advanced +1.42% today.
-=x=-=x=-=x=-=x=-=x=-=x=-=x=-
Looking ahead
Tomorrow is employment data Friday. Nonfarm Payrolls and the Unemployment Rate for May will be the top metrics for the day. We'll also get the Services PMI and the ISM Non-Manufacturing PMI data for May.
DocuSign (DOCU) is in a short list of earnings reports for Friday.
-=x=-=x=-=x=-=x=-=x=-=x=-=x=-
Trends, Support, and Resistance
The Nasdaq briefly touched the 21d EMA again in the morning, but then gained throughout the day as it headed toward the 50d MA.
If the one-day trend line continues into Friday, that would result in a +3.0% gain.
The trend line from the 5/20 low points to a +1.10% gain.
Following the five-day trend line would result in a +0.20% gain.
-=x=-=x=-=x=-=x=-=x=-=x=-=x=-
Wrap-up
The ADP Jobs data today seems like it would be bad news for the economy. But for those watching the interest rate hikes, it could mean the Fed backs down from further rates later in the year. Whether that turns out to be true is still to be written, but nonetheless is a reason for optimism in the market today.
Stay healthy and trade safe!

IWM/RUT Wyckoff Distribution is BACK!?About 3-4 months ago, I mentioned that the Russell 2k was showing signs of distribution (huge consolidation before a downtrend). I outlined where big money was selling and where they flipped short. Since the breakdown, we have seen nearly 3 months of consolidation. One could argue that the consolidation was symmetrical with higher highs and higher lows. That, my friends, would be the makings of a BEAAAAR FLAAAAG. If this bear flag correctly plays out, the target to the downside would be about 170 which is former resistance AND a previous gap. Closing above the previous local high at 205 is probably a good stop out.

6/1/22 IWMiShares Russell 2000 ETF ( AMEX:IWM )
Sector: Miscellaneous (Investment Trusts.Mutual Funds)
Market Capitalization: $$--
Current Price: $184.26
Breakout price: $187.85
Buy Zone (Top/Bottom Range): $183.95-$168.15
Price Target: $189.60-$204.00 (1st), $249.20-$278.80 (2nd)
Estimated Duration to Target: 172-180d, 412-422d
Contract of Interest: $IWM 12/16/22 200c, $IWM 6/16/23 210c
Trade price as of publish date: $7.86/contract, $9.41/contract

Daily Market Update for 6/1Summary: Positive economic data stoked fears that the Fed needs to be more hawkish to slow down an overheated economy and reduce inflation.
Notes
Ideas always welcome in the comments. Errors will be amended as comments on TradingView or corrected inline in my blog.
-=x=-=x=-=x=-=x=-=x=-=x=-=x=-
Wednesday, June 1, 2022
Facts: -0.72%, Volume lower, Closing Range: 28%, Body: 54% Red
Good: Closed above the 21d EMA, lower volume on decline
Bad: Lower low, closing range below 40%
Highs/Lows: Higher high, Lower low
Candle: Medium red body in center of candle, nearly equal upper and lower wicks
Advance/Decline: 0.52, almost two declining stocks for every advancing stock
Indexes: SPX (-0.75%), DJI (-0.54%), RUT (-0.49%), VIX (-1.91%)
Sector List: Energy (XLE +1.63%) and Utilities (XLU -0.16%) at the top. Health (XLV -1.44%) and Financials (XLF -1.61%) at the bottom.
-=x=-=x=-=x=-=x=-=x=-=x=-=x=-
Market Overview
Positive economic data stoked fears that the Fed needs to be more hawkish to slow down an overheated economy and reduce inflation.
The Nasdaq fell by -0.72%, but on lower volume than the previous day. The 54% red body sits in the middle of the candle resulting in a 28% closing range for the day. The outside day has a higher high and a lower low. There were almost two declining stocks for every advancing stock.
The S&P 500 (SPX) fell a bit more than the Nasdaq, declining by -0.75%. The Russell 2000 (RUT) declined by -0.49%. The Dow Jones Industrial Average (DJI) fell -0.54%. Despite the major indexes declining, the VIX Volatility Index dropped by -1.91%, likely helped by the mid-day market rally from the morning lows.
Only one of the eleven S&P 500 sectors advanced. Energy (XLE +1.63%) is benefiting from both higher demand and higher energy prices. The worst two sectors for today were Health (XLV -1.44%) and Financials (XLF -1.61%).
The ISM Manufacturing PMI for May registered at 56.1 compared to the forecast of 54.5. A seemingly bullish reading only stoked fears that economic growth was still too heated. API Weekly Crude Oil Stock showed more demand than expected with inventories changing by -1.18 million barrels.
The US Dollar Index (DXY) is on the rise again, advancing by +0.75% today. US 30y, 10y, and 2y Treasury Yields all rose with shorter-term yields climbing faster than longer-term yields. High Yield (HYG) and Investment Grade (LQD) Corporate Bond prices declined. Brent Oil declined to near $115 a barrel and continued to slide after hours. Aluminum Futures declined by -2.58%, falling to their lowest point this year.
The put/call ratio (PCCE) fell to 0.806. The CNN Fear & Greed index moved into the Fear range as it heads back toward neutral.
Three of the big six mega-caps gained today. Amazon (AMZN) led the gains with a +1.23% advance. Meta (FB) has the biggest loss, declining by -2.58% as Sheryl Sandberg announced her departure from the company.
Exxon Mobil (XOM) led the mega-cap list, rising by +1.92% as one of only nine mega-caps that ended the day with gains. At the bottom of the list was Alibaba (BABA) which declined -2.78% to just barely beat Meta for the bottom slot.
There were only ten advancing stocks in the Daily Update Growth List. Datadog (DDOG) was at the top of the list, gaining +2.21% today. Digital Turbine (APPS) missed earnings estimates and plummeted by -22.61% today, ending up at the bottom of the growth list.
-=x=-=x=-=x=-=x=-=x=-=x=-=x=-
Looking ahead
To start the day tomorrow, we'll get the ADP Nonfarm Employment for May, the weekly Initial Jobless Claims, and Unit Labor Costs for Q1. Factory Orders for April and the weekly Crude Oil Inventories will arrive after the market opens.
CrowdStrike (CRWD) and Lululemon Athletica (LULU) will report earnings on Thursday.
-=x=-=x=-=x=-=x=-=x=-=x=-=x=-
Trends, Support, and Resistance
The Nasdaq dropped slightly below the 21d EMA before recovering and closing above the key moving average today.
If the index returns to the five-day trend line, that will meet up with the trend line from the 5/20 low and result in a +3.32% advance.
A continuation of the one-day trend line points to a -0.57% decline.
-=x=-=x=-=x=-=x=-=x=-=x=-=x=-
Wrap-up
Although last week's rally attempt looks in danger of turning over, the rally is still alive at this point. There could be some profit-taking and repositioning after three very strong days in the market and investors are uncertain about how the Fed will respond to economic data. Or this could turn into more selling as more fear grips the market.
Stay healthy and trade safe!

RTY Update (MFI very oversold)Small caps got rejected by resistance (the old support), I think it drifts sideways and then eventually collapses again.
After I saw this plot I flipped all my puts, will re-enter when RTY challenges the resistance again.

Daily Market Update for 5/31Summary: The sentiment was mixed on the last day of trading for the month of May with some warning that the current rally will be short-lived. The shifting sentiment caused indexes to chop up and down throughout the day.
Notes
Ideas always welcome in the comments. Errors will be amended as comments on TradingView or corrected inline in my blog.
-=x=-=x=-=x=-=x=-=x=-=x=-=x=-
Tuesday, May 31, 2022
Facts: -0.41%, Volume higher, Closing Range: 56%, Body: 23% Red
Good: Higher high, higher low
Bad: Couldn't hold onto gain, decline on higher volume
Highs/Lows: Higher high, Higher low
Candle: Thin red body in top half of candle
Advance/Decline: 0.55, almost two declining for every advancing stock
Indexes: SPX (-0.63%), DJI (-0.67%), RUT (-1.26%), VIX (+1.83%)
Sector List: Consumer Discretionary (XLY +0.51%) and Communications (XLC -0.07%) at the top. Energy (XLE -1.50%) and Materials (XLB -1.52%) at the bottom.
Expectation:
-=x=-=x=-=x=-=x=-=x=-=x=-=x=-
Market Overview
The sentiment was mixed on the last day of trading for the month of May with some warning that the current rally will be short-lived The shifting sentiment caused indexes to chop up and down throughout the day.
The Nasdaq ended the day with a -0.41% decline. A dip in the opening minutes created a long lower wick, after which the index rallied to find a higher high than the previous day. Three late afternoon reversals resulted in a short upper wick and a thin red body in the upper half of the candle. The closing range of 56% isn't bad but nearly two stocks declined for every advancing stock and volume was much higher than the previous day.
Small caps were the most volatile today, with the Russell 2000 (RUT) declining by -1.26%. The S&P 500 (SPX) declined by -0.63% and the Dow Jones Industrial Average (DJI) declined by -0.67%. The VIX Volatility Index gained by +1.83%.
Only one of the eleven S&P 500 sectors gained. Consumer Discretionary (XLY +0.51%) was helped higher by better than expected Consumer Confidence. At the bottom of the sector list were Energy (XLE -1.50%) and Materials (XLB -1.52%).
Consumer Confidence was lower than the previous month but higher than the forecast. It came in at 106.4 compared to an expectation of 103.9. The Chicago Purchasing Managers Index for May was also higher than expected at 60.3 compared to the forecast of 55.0.
The US Dollar Index (DXY) rose by +0.41%. The 30y and 10y Treasury Yields rose while the 2y Treasury Yield declined. High Yield (HYG) and Investment Grade (LQD) Corporate Bond prices declined after sharply rising for several days. Brent Oil topped 115 again over the weekend, ending today at 115.74.
The put/call ratio (PCCE) rose to 0.816. The CNN Fear & Greed index remained in Extreme Fear but is moving toward Neutral.
Of the big six mega-caps, Amazon (AMZN) and Alphabet (GOOGL) ended the day with gains, holding onto a +4.40% and +1.10% advanced, respectively. Apple (AAPL) had the biggest decline of the six, losing -0.53% today.
Amazon was the top overall mega-cap as well, followed by Alibaba (BABA) which gained +2.83%. At the bottom of the mega-cap list was Eli Lilly which fell by -3.10%.
The top seven stocks in the Daily Update Growth List were all Chinese companies. Ehang Holdings (EH) led the gains with a +5.44% advance, getting a boost from their earnings release in the morning. At the bottom of the list was Snap Inc. (SNAP), which declined by -9.44%.
-=x=-=x=-=x=-=x=-=x=-=x=-=x=-
Looking ahead
The ISM Manufacturing Employment and Purchasing Manager Index data for May will be delivered tomorrow after the market opens. We will also get the JOLTs Job Openings report for April.
Two FOMC Members (Williams and Bullard) are scheduled to speak ahead of Beige Books being published in the afternoon. Williams tends to be on the more dovish side of the group while Bullard tends to be on the hawkish side.
Hewlett Packard (HPE), MongoDB (MDB), NetApp (NTAP), Chewy (CHWY), and GameStop (GME) are among the earnings reports for Wednesday.
-=x=-=x=-=x=-=x=-=x=-=x=-=x=-
Trends, Support, and Resistance
In the morning dip, the index did get support at the 21d EMA.
If the index returns to the five-day trend line, that would mean a big +3.68% gain for Wednesday.
A more likely advance would be the one-day trend line which meets up with the trend line from the 5/20 low. That would result in a +1.70% gain.
-=x=-=x=-=x=-=x=-=x=-=x=-=x=-
Wrap-up
We have a mix of sentiment in the market right now with some seeing a bullish turn for the better while others remain bearish and see a very short timeline for the current rally. The key will be whether the indexes can hold support levels and whether leading stocks can break out and hold onto gains.
Stay healthy and trade safe!

Daily Market Update for 5/27Summary: Investors continued to pile in as analysts see the Fed at its peak hawkish level and expect less aggressive moves later in the year.
Notes
Ideas always welcome in the comments. Errors will be amended as comments on TradingView or corrected inline in my blog.
-=x=-=x=-=x=-=x=-=x=-=x=-=x=-
Friday, May 27, 2022
Facts: +3.33%, Volume higher, Closing Range: 100%, Body: 95% Green
Good: 100% closing range, higher volume on green day
Bad: Nothing
Highs/Lows: Higher high, Higher low
Candle: Gap up at open, mostly green body, no upper wick
Advance/Decline: 2.87, almost three advancing stocks for every declining stock
Indexes: SPX (+2.47%), DJI (+1.76%), RUT (+2.70%), VIX (-6.47%)
Sector List: Consumer Discretionary (XLY +3.43%) and Technology (XLK +3.38%) at the top. Utilities (XLU +1.56%) and Consumer Staples (XLP +1.16%) at the bottom.
-=x=-=x=-=x=-=x=-=x=-=x=-=x=-
Market Overview
Investors continued to pile in as analysts see the Fed at its peak hawkish level and expect less aggressive moves later in the year.
The Nasdaq gained +3.33% and closed its first green week since March. Volume was higher than the previous day as the index opened with a gap up and closed with a 100% closing range. The 95% green body has a small lower wick that formed just after opening and then the index moves steadily upward the rest of the day. There were almost three advancing stocks for every declining stock.
The Russell 2000 (RUT) climbed by +2.70%. The S&P 500 (SPX) advanced +2.47%. The Dow Jones Industrial Average (DJI) gained +1.76%. The VIX Volatility Index fell by -6.47%.
All eleven S&P 500 (SPX) sectors gained. Growth sectors led the charge upward. Consumer Discretionary (XLY +3.43%) and Technology (XLK +3.38%) were the best two sectors. Utilities (XLU +1.56%) and Consumer Staples (XLP +1.16%) were at the bottom of the sector list.
Personal Spending was higher than expected while PCE Price Index data was on par with the forecast. However, Michigan Consumer Expectations and Sentiment for May were lower than expected.
The US Dollar (DXY) index continued its retreat, lowering by -0.12% on Friday. The 30y and 10y Treasury Yields declined while the 2y yield rose. High Yield (HYG) and Investment Grade Corporate Bond prices continued to climb. The gap between high yield corporate bonds and short-term treasury bonds narrowed sharply after widening throughout May.
The put/call ratio (PCCE) declined to 0.706. The CNN Fear & Greed index is moving toward Neutral but is still in Extreme Fear.
The big six mega-caps all had spectacular days. Tesla (TSLA) led the pack for another day, gaining +7.33%. Microsoft (MSFT) and Apple (AAPL) were able to close above their 21d EMA lines. Meta (FB) had the smallest gain but still advanced +1.83% to close just below its 21d EMA.
Tesla was the top overall mega-cap as well. Alibaba (BABA) gave back some of the huge gains it had on Thursday, declining by -1.13% and ending up at the bottom of the mega-cap list.
Zscaler (ZS) popped to the top of the Daily Update Growth List after beating earnings and revenue estimates. There were only two declining stocks on the list. Workday (WDAY) missed estimates in its earnings release and closed down by -5.57%.
-=x=-=x=-=x=-=x=-=x=-=x=-=x=-
Looking ahead
Markets are closed in the US on Monday for the Memorial Day holiday.
The Chicago PMI for May will arrive on Tuesday morning followed by the CB Consumer Confidence number for May.
Salesforce.com (CRM), HP Inc (HPQ), StoneCo (STNE), Digital Turbine (APPS), and Ehang (EH) will report earnings on Tuesday.
-=x=-=x=-=x=-=x=-=x=-=x=-=x=-
Trends, Support, and Resistance
The index closed above the 21d EMA for the first time since April.
If the one-day trend line continues, we can expect a +1.02% advance on Tuesday.
If the index slows and returns to the five-day trend line or the trend line from the 5/20 low, that would mean a -0.08% decline. Not too bad.
-=x=-=x=-=x=-=x=-=x=-=x=-=x=-
Wrap-up
There are several things that are looking very good. The NAAIM money manager exposure index dropped below 40 last week while the CNN Fear & Greed index moved into Extreme Greed. Both often signal a near-term bottom is here. Then the Fed's meeting minutes this week confirmed that the Fed will frontload interest rate hikes and be less aggressive in the fall.
That brought optimism for growth back into the market, evidenced by broad gains across equities and a sudden advance in corporate bond prices relative to treasuries. We finally had a positive week after a very long weekly losing streak. Let's see if optimism and confidence continue to grow and whether investors move off the sidelines and get back in the game.
Stay healthy and trade safe!

Daily Market Update for 5/26Summary: Indexes rose higher on Thursday, led by retail after several companies rose their guidance for the near. That came on top of easing concerns over an over-aggressive Fed.
Notes
Ideas always welcome in the comments. Errors will be amended as comments on TradingView or corrected inline in my blog.
-=x=-=x=-=x=-=x=-=x=-=x=-=x=-
Thursday, May 26, 2022
Facts: +2.68%, Volume lower, Closing Range: 86%, Body: 85% Green
Good: Higher high, low and close on better volume. Strong A/D ratio.
Bad: Nothing
Highs/Lows: Higher high, Higher low
Candle: Mostly green body with a small upper wick
Advance/Decline: 2.07, two advancing for every declining stock
Indexes: SPX (+1.99%), DJI (+1.61%), RUT (+2.17%), VIX (-3.07%)
Sector List: Consumer Discretionary (XLY +4.90%) and Communications (XLC +2.43%) at the top. Utilities (XLU +0.28%) and Real Estate (XLRE -0.11%) at the bottom.
-=x=-=x=-=x=-=x=-=x=-=x=-=x=-
Market Overview
Indexes rose higher on Thursday, led by retail after several companies rose their guidance for the near. That came on top of easing concerns over an over-aggressive Fed.
The Nasdaq closed up by +2.68% on higher volume than the previous day. The 85% green body sits above a barely visible lower wick, resulting in an 86% closing range. The small upper wick formed as a flurry of buying subsided mid-day. Still, bulls held prices higher thru the rest of the day and there were two advancing stocks for every declining stock.
The Russell 2000 (RUT) was the next best index, advancing by +2.17% today. The S&P 500 (SPX) gained +1.99% and the Dow Jones Industrial Average (DJI) climbed +1.61%. The VIX Volatility index fell by -3.07%.
Ten of the eleven S&P 500 sectors gained today. Consumer Discretionary (XLY +4.90%) led thanks to the positive news from retail giants. Communications (XLC +2.43%) was the second-best, followed by Technology (XLK +2.40%). Utilities (XLU +0.28%) and Real Estate (XLRE -0.11%) were at the bottom of the list.
Initial Jobless Claims were lower than expected, coming in at 210,000 compared to a forecast of 215,000. That was a positive, but Pending Home Sales for April were lower than the forecast, dropping by -3.9% month-over-month compared to the forecast of -2.0%.
The big news was upgraded annual guidance from Macy's, Dollar General, and Dollar Tree during their earnings reports in the morning. That sent consumer discretionary stocks soaring. The positive sentiment came on top of relief that the Fed would front-load interest rate hikes in summer and cool off in fall.
The US Dollar Index (DXY) fell by -0.31%. US 30y and 10y Treasury Yields were higher while the 2y yield was lower. High Yield (HYG) Corporate Bond prices have increased sharply over the last three days. Investment Grade (LQD) Corporate Bond prices rose slightly today after a sharp increase yesterday. The spread between corporate junk bonds and short-term treasuries tightened significantly.
The put/call ratio (PCCE) rose to 0.818. The CNN Fear & Greed index moved toward Neutral but remained well in the Extreme Fear zone. The NAAIM Money Manager Exposure index rose to 33.19 after dipping to 19.51 last week. A value lower than 20 often signals at least a short-term bottom in the market.
All big-six mega-caps gained today. Tesla (TSLA) led the way with a +7.43% advance. Microsoft (MSFT) had the smallest gain but still climbed +1.29% on top of a good uptrend the last three days.
Alibaba (BABA) was the top mega-cap for the day, soaring by +14.79% today. Only six mega-caps declined. Merck (MRK) was at the bottom of the mega-cap list with a -1.54% decline.
Fastly (FSLY) topped the Daily Update Growth List (behind Alibaba which is also on the list). Fastly gained +10.85%. Snowflake (SNOW) was at the bottom of the list, declining by -4.50%.
-=x=-=x=-=x=-=x=-=x=-=x=-=x=-
Looking ahead
Tomorrow will bring the PCE Price Index data, another measure of inflation. Investors will be looking for any signal of a top for inflation. We will also get Person Spending and Retail Inventories for April. After the market opens, the Michigan Consumer Sentiment and Expectations data for May will be released.
Pinduoduo (PDD), Big Lots (BIG), and Up Fintech (TIGR) are among some of the earnings reports for tomorrow.
-=x=-=x=-=x=-=x=-=x=-=x=-=x=-
Trends, Support, and Resistance
The index made a move back toward the 21d EMA but fell short of crossing the line.
If the one-day trend continues, that could mean a +1.96% gain for Friday and a move back above the key moving average line.
If the index returns to the five-day trend line, that would mean a -0.22% decline. Given the follow-thru day today, I'm also moving the longer-term trend line to the 5/20 bottom.
-=x=-=x=-=x=-=x=-=x=-=x=-=x=-
Wrap-up
Today's move was very positive for investors. We had a solid move higher on better volume than the previous day. The gains were shared broadly across the market. The next test is for the index to close above the 21d EMA, followed by taking out a few support/resistance areas. Caution is still warranted until more charts of our favorite stocks begin to show health signals.
Stay healthy and trade safe!

R2K at middle of channel and 200 week MAThis is a log chart of $RUT where it has been respecting the 200 week MA for three straight weeks. It also happens to be in the middle of a huge parallel channel dating back to the GFC bottom.

Daily Market Update for 5/24Summary: Snap Inc. sent an ominous signal to the market by reducing guidance, causing tech and growth stocks to sell off heavily in the morning before recovering some of the losses.
Notes
Ideas always welcome in the comments. Errors will be amended as comments on TradingView or corrected inline in my blog.
-=x=-=x=-=x=-=x=-=x=-=x=-=x=-
Tuesday, May 24, 2022
Facts: -2.35%, Volume lower, Closing Range: 66%, Body: 24% Red
Good: Good closing range over long lower wick
Bad: Lower high, lower low, higher volume on decline
Highs/Lows: Lower high, Lower low
Candle: Thin red body in upper part of candle, longer lower wick
Advance/Decline: 0.3, More than three declining stocks for every advancing stock
Indexes: SPX (-0.81%), DJI (+0.15%), RUT (-1.56%), VIX (+3.41%)
Sector List: Utilities (XLU +2.00%) and Consumer Staples (XLP +1.64%) at the top. Consumer Discretionary (XLY -2.57%) and Communications (XLC -3.55%) at the bottom.
-=x=-=x=-=x=-=x=-=x=-=x=-=x=-
Market Overview
Snap Inc. sent an ominous signal to the market by reducing guidance, causing tech and growth stocks to sell off heavily in the morning before recovering some of the losses.
The Nasdaq fell by -2.35% on higher volume than the previous day. The long lower wick was created at open as key economic metrics missed the forecast. However, the index recovered some of the loss and closed with a 66% closing range. The 24% red body sits at the top of the candle. There were more than three declining stocks for every advancing stock.
The Dow Jones Industrial Average (DJI) was able to finish the day with a gain, advancing +0.15%. The S&P 500 (SPX) declined by -0.81%. The Russell 2000 (RUT) declined by -1.56%. The VIX Volatility Index increased by +3.41%.
Five of the eleven S&P 500 sectors gained, led by defensive sectors. Utilities (XLU +2.00%) and Consumer Staples (XLP +1.64%) were at the top of the list. Consumer Discretionary (XLY -2.57%) and Communications (XLC -3.55%) were at the bottom, with the former being impacted by Snap's news.
Manufacturing PMI data for May met the forecast of 57.5 but the Services PMI fell short, coming in at 53.5 compared to the forecast of 5.2. The PMI data is a signal of economic activity within these two sectors.
New Home Sales for April also came in lower than expected. There were only 591,000 new home sales compared to the forecast of 750,000. The previous month was 709,000. The new number shows a significant slowdown.
API Weekly Crude Oil Stock was higher than expected.
The US Dollar Index (DXY) continued to decline, dropping by -0.32% today. US 30y, 10y, and 2y yields were all lower. High Yield (HYG) and Investment Grade (LQD) Corporate Bond prices were higher, tracking with treasury prices.
The put/call ratio (PCCE) rose to 0.903. The CNN Fear & Greed Index remained in the Extreme Fear range.
All of the big six mega-caps declined, with Facebook (FB) dropping the most, losing -7.62% today. Microsoft (MSFT) held up the best, declining only -0.40%.
Verizon (VZ) was the top mega-cap for the day, gaining +2.03%. Consumer Staples and Health mega-caps dominated the rest of the top ten. Facebook was at the bottom of the list, followed by Tesla (TSLA) which fell by -6.93%.
There was only one gainer in the Daily Update Growth List. Zoom Video (ZM) climbed by +5.61% as its earnings report showed continued growth despite the winding down of the pandemic. After Zoom Video, all the stocks on the growth list fell by more than 2%. Five stocks on the list fell more than 10%, led by Snap Inc (SNAP) which dropped by a huge -43.08%.
-=x=-=x=-=x=-=x=-=x=-=x=-=x=-
Looking ahead
Wednesday will kick off with the Core Durable Goods Orders data for April. After the market opens we will get the Crude Oil Inventories.
The FOMC Meeting Minutes from the early May meeting will be available in the afternoon.
Nvidia (NVDA), Trip.com (TCOM), and Box Inc (BOX) are a few of the earnings reports for Wednesday. I mistakenly
-=x=-=x=-=x=-=x=-=x=-=x=-=x=-
Trends, Support, and Resistance
The Nasdaq continued its downtrend but held above Friday's low.
After the dip in the morning, the index trended higher the rest of the day. If the one-day trend line continues into Wednesday, we can expect a +0.69% gain.
The five-day trend line points to a -1.07% decline.
If the index returns to the trend line from the 3/29 high, that would mean a -2.56% decline.
-=x=-=x=-=x=-=x=-=x=-=x=-=x=-
Wrap-up
Snap's message of lower guidance due to economic disruptions drove even more fear among investors in tech and growth stocks, resulting in today's sell-off. The bleeding continues, and the only question is when will it stop. Perhaps we will continue to bounce around at this level, or maybe we will move lower.
If we can start to see indications of a top to inflation, that will help build more support for gains. Inflation needs to come under control without massive interest rate hikes that will further slow down growth.
Stay healthy and trade safe!

Daily Market Update for 5/23Summary: Stocks rallied on Monday thanks to a stronger Euro after the European Central Bank said rate hikes would come later this year.
Notes
I've been traveling for the past two weeks and have not been able to write the Daily Market Update. I'm back at home and will continue covering the markets as often as I can.
Ideas always welcome in the comments. Errors will be amended as comments on TradingView or corrected inline in my blog.
-=x=-=x=-=x=-=x=-=x=-=x=-=x=-
Monday, May 23, 2022
Facts: +1.59%, Volume lower, Closing Range: 93%, Body: 56% Green
Good: High closing range
Bad: Lower volume on gain, lower high than previous day
Highs/Lows: Lower high, Higher low
Candle: Inside day, upper half green body, lower half wick
Advance/Decline: 1.07, about the same number of advancing and declining stocks
Indexes: SPX (+1.86%), DJI (+1.98%), RUT (+1.10%), VIX (-3.23%)
Sector List: Financials (XLF +3.25%) and Energy (XLE +2.64%) at the top. Health (XLV +0.88%) and Consumer Discretionary (XLY +0.75%) at the bottom.
-=x=-=x=-=x=-=x=-=x=-=x=-=x=-
Market Overview
Stocks rallied on Monday thanks to a stronger Euro after the European Central Bank said rate hikes would come later this year.
The Nasdaq rose by +1.59% for the day, but it was not enough to reach the previous day's high. The inside day came with lower volume, but the closing range of 93% and 56% green body in the upper half of the candle is positive. There was a nearly equal number of advancing and declining stocks.
The Dow Jones Industrial Average (DJI) outperformed the other indexes, gaining by +1.98% while the S&P 500 (SPX) advanced by +1.86%. The Russel 2000 (RUT) climbed by +1.10%. The VIX Volatility Index declined by -3.23% but remained elevated as it has been since the beginning of May.
All eleven S&P 500 sectors gained. Financials (XLF +3.25%) and Energy (XLE +2.64%) were the best two sectors for today. Health (XLV +0.88%) and Consumer Discretionary (XLY +0.75%) were at the bottom of the sector list.
The US Dollar Index (DXY) dropped by -0.91% and is down 2.5% from its peak in early May. US 30y, 10y, and 2y Treasury Yields all rose. High Yield (HYG) Corporate Bond prices moved higher while Investment Grade (LQD) Corporate Bond prices declined. Copper and Aluminum Futures continued to rise.
The put/call ratio (PCCE) dropped to 0.829. The CNN Fear & Greed index is in the Extreme Fear range.
Five of the big six mega-caps advanced. Amazon (AMZN) was the only one to decline but fell just -0.03%. Apple (AAPL) had the biggest gain, advancing +4.01%, followed by Microsoft which moved up by +3.20%. All six have work to do before getting back to their key moving average lines.
Financial stocks topped the broader mega-cap list. JP Morgan (JPM) and Bank of America (BAC) were the top gainers, advancing +6.19% and +5.94% respectively. Broadcom (AVGO) was at the bottom of the list, declining by -3.10%. There were only four mega-caps that declined.
The Daily Update Growth List had some gainers, but overall more than half of the list declined. DoorDash (DASH) topped the list with a +2.39% gain. Peloton (PTON) had the biggest loss, declining by -6.13%.
-=x=-=x=-=x=-=x=-=x=-=x=-=x=-
Looking ahead
Purchasing Manager Index data for May will be available after the market opens tomorrow. That includes Manufacturing, Services, and Composite measurements. We will also get New Home Sales data for April.
Nvidia (NVDA), Trip.com (TCOM), and Box Inc (BOX) are a few of the earnings reports for Tuesday.
-=x=-=x=-=x=-=x=-=x=-=x=-=x=-
Trends, Support, and Resistance
Although the day ended with positive gains, the lower high means the index is still in a down trend.
If the one-day trend continues, that would mean a +1.33% gain for Tuesday.
If the index returns to the five-day trend line and or the trend line from the 3/29 high, that would result in a -3.86% decline.
-=x=-=x=-=x=-=x=-=x=-=x=-=x=-
Wrap-up
It's been a wild few weeks. Part of me is happy I was on break and didn't report daily. Part of me thinks there was much to learn from the market data and could have benefited.
Let's hope for some new highs throughout this week and some gains on higher volume, shared broadly across the market.
Stay healthy and trade safe!

RUT update - 19/05/2022the push higher than 1901.35 will confirm that wave A of (4) ended and wave B is in play, critical level at 2458.855

$SPX retrace back to neckline (headfake)After my last post of a bearish harami, the markets rallied to the upside, retracing back to the neckling support of the Head and Shoulders pattern formed on the SPX. While it seemed to have potential for a multiday rally, that was quickly erased by the dismal retail data on Wednesday and back to bear mode by the markets on inflation and growth concerns. For some this may have been a headfake, but i think selling in to rallies is the call of the day unless otherwise proven to have seen some sort of a bottom or a meaningful bounce.
SPX target remains at 3500 - another 10% down from this point. I don't think we'll see a bounce until this level is visited. RSI is oversold but it's got some room to go. SPX is now below the 100 week moving average as well - haven't been below this MA since March 2020. Very bearish.

Russell Testing Pivotal ResistanceIn this update we review the recent price action in the Russell2000 futures contract and identify the next high probability trading opportunities and price objectives to target

$SPX Bearish Harami on Daily chartI'm not that big on candlestick patterns, but a Bearish Harami is essentially a failed continuation of a prior bullish session(s) or rally.
SPX posted a bullish close on the 12th and the 13th, but failed to follow through with a third session on Monday. Instead you saw a choppy session where the bulls and bears tugged a bit intraday, but the SPX lost steam at the end of the session and posted a red candlestick.
It was also fairly indecisive so while one can say that it's a toss up for tomorrow, you'd rather bet on a continuation of the larger downward trend that we're in, rather than some sort of coin flip reversal.
Same daily stick pattern can be seen on the NDQ (Nasdaq 100) and RUT (Russell 2000).

Russell 2000 - US Economy in Trouble, 50% Shorting Opportunity?Although big indices like S&P500 and Nasdaq, favouring large cap companies, have still got potential to update historic highs - what is small caps index Russell 2000 telling us?
It has already dropped by 30%, is there more downside and is it indicating that real US economy already in trouble?
Technical Analysis (Elliott Waves):
Looking at weekly timeframe it is visible that sharp drop in March 2020 has completed fourth wave of an impulse that has been developing since the great financial crisis of 2008
The proposed scenario suggests that the 5th wave has culminated in November 2021 and since then the next global correction has started which is likely to last even longer than the previous one that stretched from 1998 to 2009 - it's shocking to think of a correction for 11 years or longer
The most interesting opportunity however, is the potential development of an Expanding Triangle which may have been formed with A-B-C-D waves already
And given that there was an optimistic bounce on Friday 13th May in all the markets, there is a potential move for Russell 2000 towards $2140 to complete this triangle
In this case the next move to the downside may have a great opportunity with nearly 50% for shorting the index and expect the target in the range between $1000 and $1300 which represent 0.618x and 0.5x Fibonacci retracement levels of the global wave 3
What do you think about this idea and US economy as a whole?
Please share your thoughts in the comments and like this idea if you agree wit it.
Also let me know if you would like to see other stocks, indices or Forex pairs analysed using Elliott Waves.
Thanks

IXIC US Composite Nasdaq Corrects 50% from swing of 2020! Over? IXIC US Composite Nasdaq Corrects 50% from swing of 2020! Over?
#IXIC #NASDAQ #US30 #RUT #SPX500
NASDAQ:IXIC corrects 50% from the swing of 2020 bottoms.
Is it over? Economic fundamentals claim it has not bottomed out yet.
Most of the IT stocks gave the way for this correction. #TSLA #AMZN #FB #NFLX and so on to name.
Is it time for investment? Yes, for a long term holder who is not bothered with a small dips of 5-7% further fall, should start investing.
Are you salaried class person with a constant earning coming every month end? Or u have a business with a strong mindset of risk management and risk handling?
Be prepared with your investment plans! Personal Finances and Taxation. Earnings and Expenses. Savings and Return on Investment All are to be aligned in this latest world of increased necessities and demands with scarcity of resources.
As we have always read, this is actually happening in front of us.
Are we prepared?
Inflation and Unemployment will tame our greed and carelessness towards resources.
Investment opportunities? Ample of opportunities, waiting for appropriate investment entry.
Start investing start trading. Tradingview !
#tradingview.

Daily Market Update for 5/6Summary: The market continued to correct as the US Dollar strengthened and Treasury yields rose on Friday. Defensive sectors in the S&P 500 gained while other sectors sank.
Notes
A brief update today due to holidays and travel. I will be traveling for the next week as well but will try to keep the Daily Market Update going.
Ideas always welcome in the comments. Errors will be amended as comments on TradingView or corrected inline in my blog.
-=x=-=x=-=x=-=x=-=x=-=x=-=x=-
Friday, May 6, 2022
Facts: -1.40%, Volume higher, Closing Range: 42%, Body: 28% Red
Good: Closing range is ok
Bad: Lower high, lower low, higher volume sell-off
Highs/Lows: Lower high, Lower low
Candle: Thin body in middle of long upper and lower wicks
Advance/Decline: 0.27, almost four declining stocks for every advancing stock
Indexes: SPX (-0.57%), DJI (-0.30%), RUT (-1.69%), VIX (-3.24%)
Sector List: Energy (XLE +2.98%) and Utilities (XLU +0.80%) at the top. Materials (XLB -1.43%) and Communications (XLC -2.06%) at the bottom.
-=x=-=x=-=x=-=x=-=x=-=x=-=x=-
Market Overview
A brief update today due to holidays and travel. The market continued to correct as the US Dollar strengthened and Treasury yields rose on Friday. Defensive sectors in the S&P 500 gained while other sectors sank.
-=x=-=x=-=x=-=x=-=x=-=x=-=x=-
Looking ahead
Fed's Raphael Bostic is scheduled to speak on Monday. Bostic is on the hawkish side of the Fed and could stoke fears of higher interest rate hikes despite Jerome Powell's assurance they would limit to 50 basis points.
-=x=-=x=-=x=-=x=-=x=-=x=-=x=-
Trends, Support, and Resistance
The Nasdaq fell to 12,000 before getting support on Friday. Some analysts have forecasted 12,000 as the bottom during this correction, but time and the market will tell if that's true. The 40w EMA is at 11,750.07. The index dipped below this line only in the 2000, 2008, and 2020 crashes.
If the index returns to the trend line from the 3/29 high, that would mean a +0.66% gain for Monday.
The one-day and five-day trend lines point to a -0.67% decline.
-=x=-=x=-=x=-=x=-=x=-=x=-=x=-
Wrap-up
Analysts have been waiting for broad market capitulation and maybe we've seen some over the past two days, or maybe there is more to come. Watch the two levels at 12,000 and 11,750. If those levels hold, then we could see some upside from there.
Stay healthy and trade safe!

RTY - MegaphoneZero Bound.
An Insurance Company with Annuities @ 5% cannot exist at net negative Returns.
They go out of business.
RTY is DOA in time.

IWM Update: 6 MayThe Russell is tossed around by dip-buyers and sellers of strength. In this video I take a look at an important bullish divergence and a trade idea that can be profitable regardless of market direction if it is managed well.
