TradeCityPro | ONDO Builds Strength Beneath Key Supply Barrier👋 Welcome to TradeCity Pro!
In this analysis, I want to review the ONDO coin for you — one of the RWA projects, currently ranked 37th on CoinMarketCap with a market cap of $2.93 billion.
📅 Daily Timeframe
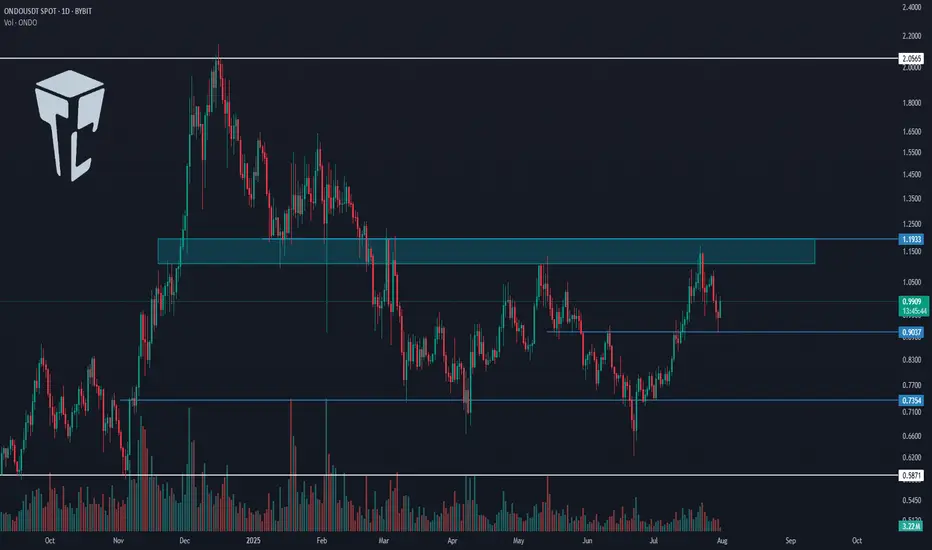
In the daily timeframe, as you can see, this coin has formed a range box between the levels of 0.7354 and 1.1933, and the price is currently sitting in the upper half of this box.
✔️ At the moment, the price is hovering around 0.9037, and it’s forming a higher low above 0.7354. If this low gets confirmed, the probability of breaking above 1.1933 increases.
⭐ The 1.1933 zone is a very significant supply level that was previously acting as support in late 2024, and after being broken, has since acted multiple times as resistance.
📊 If this area breaks, we can open a long position, or even buy this coin in spot. Personally, if this trigger is broken, I’ll open a long-term long position.
✨ The target for this position is 2.0565, and once the price reaches this level, we can take profits and consider a spot buy.
📝 Final Thoughts
This analysis reflects our opinions and is not financial advice.
Share your thoughts in the comments, and don’t forget to share this analysis with your friends! ❤️
RWA
TradeCityPro | INJ Battles Key Resistance Amid Altseason Buzz👋 Welcome to TradeCity Pro!
In this analysis, I want to review the INJ coin for you. It’s one of the RWA and AI projects, currently ranked 63 on CoinMarketCap with a market cap of $1.51 billion.
📅 Daily Timeframe
On the daily timeframe, after a drop to the 6.94 level, this coin has bounced back and is now moving upward along with a rising trendline.
✨ A strong support has formed at 10.28, and after price reacted to this level, a new bullish leg started and pushed the price up to 16.04.
🔔 There is a Maker Seller zone around 16.04 that has repeatedly prevented the continuation of the upward move, and currently price is struggling with it again.
📈 Breaking this zone will initiate a new phase of the trend. I plan to have a long position open if 16.04 is broken.
🛒 This trigger is also suitable for spot buying, and if Bitcoin pair and Bitcoin dominance confirm the move, we can consider buying in spot too. But personally, I prefer opening a futures position.
💥 Breaking the 72.87 zone on the RSI will be a solid confirmation for the entry of bullish momentum, and with this breakout, a new bullish leg can begin.
🔽 If a correction happens, I will wait for the trendline to break and will not open a short position for now.
Currently, the first trigger we have for a short is at 10.28.
📝 Final Thoughts
This analysis reflects our opinions and is not financial advice.
Share your thoughts in the comments, and don’t forget to share this analysis with your friends! ❤️

ONDOUSDT Daily Chart Analysis | Momentum Shift & Breakout LevelsONDOUSDT Daily Chart Analysis | Momentum Shift & Breakout Levels
🔍 Let’s dive into the ONDO/USDT daily chart and break down the latest momentum signals, key breakout areas, and targets for bulls.
⏳ Daily Chart Overview
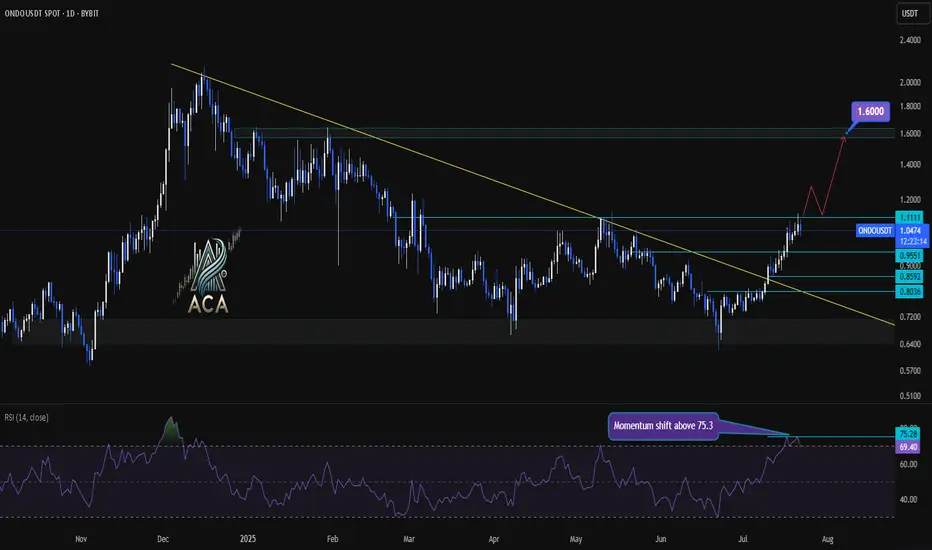
The daily trend shows significant recovery after prolonged downward pressure, with price action now testing critical resistance levels. A key descending trend line has recently been challenged, highlighting a potential shift in market structure.
🔺 Bullish Setup
- Momentum Trigger: The RSI has closed above 75.3, signaling a strong momentum shift and upping the odds for continued upside.
- Breakout Confirmation: Watch for a daily candle close above the $1.1111 resistance level. This would confirm a bullish breakout and could serve as a solid trigger for further upside.
- Trend Line Dynamics: The price has decisively broken above the major descending trend line, which had capped rallies for months—removing a significant area of supply and emboldening bulls.
- Upside Target: Once confirmed, this setup opens the door for an advance towards the $1.60 area, where the next major resistance sits.
📊 Key Highlights
- Daily RSI closing above 75.3 reflects strong market momentum and buyer dominance.
- A daily candle close above $1.1111 can be used as a bullish trigger.
- The long-term descending trend line has been broken, indicating a major momentum shift.
- Immediate upside target stands at $1.60, representing a clear resistance level for profits or further evaluation.
🚨 Conclusion
Momentum is clearly shifting in favor of the bulls as technical barriers fall by the wayside. For traders looking to position long, confirmation above $1.1111 combined with the powerful RSI reading sets the stage for a move towards $1.60—keep these levels on your radar as the setup plays out!
Key Insights: Financial Markets Transformation by 2030For years, this page has been my space to share in-depth market research and personal insights into key financial trends. This post reflects my perspective — a strategic outlook on where I believe the digital finance industry is heading.
The financial world is evolving at an unprecedented pace, and it's easy to overlook subtle shifts. But the undeniable fact is that we are now standing at the intersection of three powerful industries — financial markets, blockchain, and artificial intelligence. We are positioned at the cutting edge of technology, where innovation is not a future concept but a present reality.
This post serves as a reference point for future trends and a guide to understanding the transformative forces shaping financial markets by 2030. These are not just facts, but my vision of the opportunities and challenges ahead in this rapidly converging digital ecosystem. Staying ahead today means more than following the market — it means recognizing that we are part of a technological shift redefining the core of global finance.
📈 1. Electronic Trading Evolution
Full transition from traditional trading floors to AI-driven digital platforms.
Integration of blockchain and smart contracts ensures transparency, automation, and risk reduction.
Real-time data analytics democratizes market access and enhances strategic decision-making.
🤖 2. Algorithmic Trading Growth
Accelerated by AI, machine learning, and big data analytics.
High-frequency trading (HFT) boosts efficiency but introduces new volatility factors.
Adaptive algorithms dynamically adjust strategies in real time.
Strong focus on regulatory compliance and ethical standards.
🔗 3. Tokenization of Real World Assets (RWA)
Transforming asset management with projected growth to $18.9 trillion by 2033. (now 18.85B)
Enhances liquidity, accessibility, and transparency via blockchain.
Institutional adoption is driving mainstream acceptance.
Evolving regulations (DLT Act, MiCA) support secure tokenized ecosystems.
🏦 4. Institutional Adoption & Regulatory Frameworks
Digitalization of fixed income markets and exponential growth in institutional DeFi participation.
Key drivers: compliance, custody solutions, and advanced infrastructure.
Global regulatory harmonization and smart contract-based compliance automation are reshaping governance.
💳 5. Embedded Finance & Smart Connectivity
Embedded finance market to hit $7.2 trillion by 2030.
Seamless integration of financial services into everyday platforms (e-commerce, mobility, etc.).
AI, blockchain, and IoT power real-time, personalized financial ecosystems.
Smart contracts reduce operational friction and enhance user experience.
🛡 6. Financial Crime Risk Management
Market expected to reach $30.28 billion by 2030.
AI-driven threat detection and anomaly monitoring strengthen AML compliance.
Blockchain ensures data integrity and automates cross-border regulatory adherence.
Global collaboration (FATF, EU AML) fortifies defenses against evolving financial crimes.
🌍 7. Consumer Behavior & Financial Inclusion
Digital banking bridges the gap for underbanked populations, especially in emerging markets.
Mobile solutions like M-Pesa revolutionize access to financial services.
Biometrics, microfinance, and AI-powered engagement tools foster inclusive economic participation.
🚀 Conclusion
By 2030, financial markets will be defined by technology-driven efficiency, regulatory adaptability, and inclusive growth.
Success will favor those who embrace innovation, leverage automation, and engage in cross-sector collaboration.
The future belongs to agile stakeholders navigating a landscape shaped by AI, blockchain, tokenization, and smart finance connectivity.
Best regards, EXCAVO
_____________________
Disclosure: I am part of Trade Nation's Influencer program and receive a monthly fee for using their TradingView charts in my analysis.

TradeCityPro | HBAR Rebounds Sharply After Trendline Breakout👋 Welcome to TradeCity Pro!
In this analysis, I’m going to review the HBAR coin for you—one of the RWA and Layer1 crypto projects, currently ranked 16 on CoinMarketCap with a market cap of 9.95 billion dollars.
📅 Daily Timeframe
On the daily chart, as you can see, after a bullish rally toward the end of 2024, HBAR entered a corrective phase and is currently still in this correction.
✨ A major support zone (highlighted on the chart) was established, and a range box was formed between this zone and 0.21765 where price had been consolidating.
💥 There was also a descending trendline within this box that the price recently broke through, triggering strong bullish momentum. The price has now even broken above the 0.21765 level.
✔️ A significant increase in buying volume has entered the market, and with RSI entering the Overbuy zone, this move looks poised to continue even more sharply.
🔔 If this bullish momentum persists, the next targets are 0.26221 and 0.38402. If you already have an open position, these levels could be suitable for partial profit-taking.
🛒 If you're looking to buy this coin in spot, the breakout and confirmation above 0.21765 is a decent entry. However, the current stop-loss range is quite wide, so reaching a good risk-to-reward ratio might take longer with this trigger.
📈 The next potential spot triggers are 0.26221 and 0.38402. A breakout above 0.38402 would likely signal the start of a new major bullish leg.
📝 Final Thoughts
This analysis reflects our opinions and is not financial advice.
Share your thoughts in the comments, and don’t forget to share this analysis with your friends! ❤️

TradeCityPro | AVAX Holds Key Support in Sideways Structure👋 Welcome to TradeCity Pro!
In this analysis, I want to review the AVAX coin for you. It’s another Layer1 and RWA project whose coin has a market cap of 7.48 billion dollars and ranks 16th on CoinMarketCap.
📅 Daily Timeframe
On the 1-day timeframe, as you can see, the price is sitting on a very important and strong support at the 16.46 zone, which I’ve marked as a range for you.
🔍 This range is where buyer makers are heavily present, and the price has touched it three times so far and has been supported each time. This shows the high strength of this zone.
✨ Currently, after being supported from this zone, the price has reached the 18.77 level and is fluctuating below this level. Volume is also gradually decreasing, and we have to see what happens next.
📊 If the volume keeps decreasing like this, the price will probably continue ranging between 16.46 and 18.77 until volume enters the market. But if strong buying or selling volume enters, the price can make a move and exit this range.
✔️ If buying volume enters and the price wants to move upward, we can enter a long position with a break of 18.77 and even buy in spot. A confirmation for this position could be the RSI breaking above the 50 level.
🛒 I personally consider this trigger suitable for a long position, but for spot I suggest waiting for a break of 25.78. More important than that is Bitcoin dominance, and in my opinion, as long as the long-term trend of Bitcoin dominance is bullish, buying altcoins is not logical and we have to wait until dominance changes trend.
📉 If the price wants to move downward and selling volume enters the market, the break of this same support range would be the best trigger. With a break of 16.46, we can enter a short position, and if you already bought this coin in spot, you can activate your stop-loss as well.
💥 A momentum confirmation for this position would be the RSI breaking below the 30 level and the oscillator entering the Oversell zone.
📝 Final Thoughts
This analysis reflects our opinions and is not financial advice.
Share your thoughts in the comments, and don’t forget to share this analysis with your friends! ❤️

#Ondo Finance this is a possible scenario of how #ondo could play out this cycle if all goes well…. Not financial advice DCA safely

#QNTUSDT #4h (Bitget Futures) Bull flag near breakoutQuant regained 50MA support after breaking out of the falling wedge, bullish continuation seems likely.
⚡️⚡️ #QNT/USDT ⚡️⚡️
Exchanges: Bitget Futures
Signal Type: Regular (Long)
Leverage: Isolated (6.0X)
Amount: 4.6%
Current Price:
100.30
Entry Zone:
99.22 - 96.92
Take-Profit Targets:
1) 106.59
2) 112.99
3) 120.11
Stop Targets:
1) 90.95
Published By: @Zblaba
GETTEX:QNT BITGET:QNTUSDT.P #4h #Quant #RWA quant.network
Risk/Reward= 1:1.2 | 1:2.1 | 1:3.1
Expected Profit= +52.1% | +91.3% | +134.8%
Possible Loss= -43.6%
Estimated Gaintime= 1-2 weeks

USUAL: Worst Case Scenario +950%; Strong Bull Market = 4,000%+First bull then bear then sideways with a slight downward bent. Notice how the candles are almost invisible now... This is the end of the current phase. When volume drops to a halt and the candles become almost invisible you can be certain that change is approaching this market. The pair in question is USUALUSDT—RWA.
The late 2024 bullish wave started from ~2000 sats and total growth reached ~700%.
Current price is ~650 sats and this opens the doors for 10, 20 or even 30X in the coming months. 20X is possible even without a new all-time high. I am adding this one to my list as it has huge growth potential and it is available on so many top exchanges.
The action went below 100%. This is good, we know there won't be any compulsion for prices to move lower. Once a bearish move goes beyond the low of the previous move, we are faced with a potential buy opportunity. That's what we have here.
There is basically no recovery in April, this is also good, it means the bulls have not used their ammunition while the bears must be running out. Many pairs produced a strong move in April and are recovering now in June.
The most interesting part is the easy target, it goes as high as 950%. Worst case scenario, we get 950% to 1,500% total growth within the next six months. If things go well, we will see a new all-time high with profits potential going off the chart. Beyond 4,000% is possible.
Thanks a lot for your support.
Namaste.

$SYRUP (formerly Maple): An Institutional-Level RelaunchMassive Reload: Brand, Token, Architecture
In May, the migration from MPL - SYRUP was completed, with the final 48-hour window taking place from May 19-21, 2025.
All products (syrupUSDC, syrupUSDT, etc.) have been integrated into the Maple ecosystem.
The Syrup.fi platform has been shut down. Unclaimed MPL tokens were redirected to the Syrup Strategic Fund (SSF) to support ecosystem liquidity and growth.
Key Developments & Growing Institutional Trust
Cantor Fitzgerald launched a $2B BTC lending program in partnership with Maple and FalconX (May 27) - a clear vote of confidence from the institutional world.
TVL has exceeded $1.6B, with nearly $1B in active loans - a significant milestone in the DeFi space.
Maple is expanding into Solana, launching syrupUSD:
Over $30M deployed already.
Additional $500K in incentives announced.
Chainlink CCIP is used for cross-chain communication between EVM and Solana ecosystems.
Analysis & Outlook: What the Structure Tells Us
Financial Infrastructure
Strong fundamentals: massive TVL growth and deep institutional participation.
Diversified architecture: Ethereum, Solana, and CEX liquidity all integrated into one unified system.
Behavioral & Market Signals
Despite temporary drops in on-chain activity and reduced whale holdings, the system’s DeFi structure remains robust and functional.
A short-term correction may occur due to whale profit-taking — potentially a great entry point.
What’s Next?
The launch of lstBTC — a compliant BTC yield solution — could be the next big catalyst.
Deeper Solana integration is likely to unlock new liquidity and broader user adoption.
Right now, we’re in the quiet build-up phase — when markets are silent, but infrastructure is forming. These are the moments where the best positions are taken.
I expect 1-1.4$ for 1 SYRUP
Best regards EXCAVO

TradeCityPro | ALGO: Bearish Pressure Builds Near Key Support👋 Welcome to TradeCity Pro!
In this analysis, I’m going to review the ALGO coin for you. The Algorand project is one of the Layer 1 and RWA projects.
⚡️ The coin, with the ticker ALGO, currently holds a market cap of $1.63 billion and ranks 53rd on CoinMarketCap.
⏳ 4-Hour Timeframe
As you can see in the 4-hour timeframe, after the price reached the 0.2505 resistance level, a bearish phase began, and with the breakdown of the 0.2123 level, the first bearish leg extended down to 0.1912.
✔️ After this drop, the price retraced up to the 0.382 Fibonacci level and now has returned to the 0.1912 zone. Given the strong bearish momentum in the market, the probability of breaking this level is quite high.
✨ If 0.1912 is broken, the extension wave could begin. According to Fibonacci projections, the targets for this position are 0.1780, 0.1732, and 0.1602.
💥 An entry of RSI into the Oversold zone would serve as a very strong momentum confirmation for this position. If that happens, the price may reach the 0.1602 target.
📊 Volume also plays a key role. Currently, the selling volume isn’t very strong, which might result in a fake breakout of 0.1912. I suggest waiting to see whether sell volume increases, because without volume, price movement is unlikely.
📈 For a long position, the first trigger we currently have is the 0.2023 level, which is a significant high and overlaps with the 0.382 Fibonacci retracement level. Breaking this level could resume the long-term bullish trend.
💫 The momentum confirmation for a long position would be the RSI breaking above the 50 level. A breakout here could kick off a bullish trend in the higher timeframes.
📝 Final Thoughts
This analysis reflects our opinions and is not financial advice.
Share your thoughts in the comments, and don’t forget to share this analysis with your friends! ❤️

$RWA is ready for a massive 50% pump.About RWA:- Allo is building the world’s first exchange for tokenised stocks with 24/7 trading, low fees and instant settlement to democratize investing. Built on blockchain technology, Allo has tokenised $2.2B in RWAs, staked $50M in BTC, and launched a $100M lending facility.
The fundamentals look good, and so does the chart.
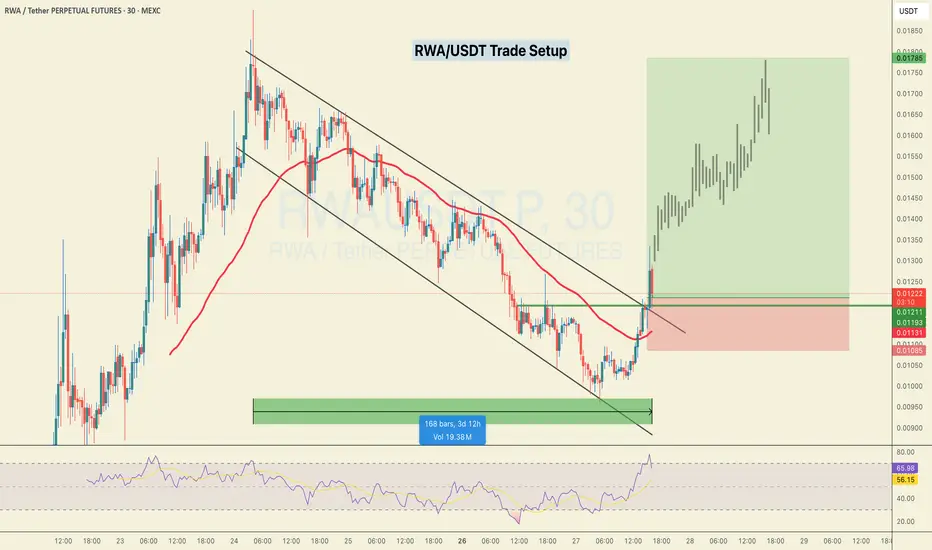
A massive breakout after 4 days of consolidation inside the channel.
ENTRY :- .01150 .01240
Target:- 1390, 1477,1558,1623,1785
SL : 1020
Keep the leverage low.
If you want me to post more setups like these, do show your support with a like.
Thank you
#PEACE
$RWA Breakout Alert – Trend Reversal in Play?LSE:RWA just broke out of a falling channel with strong volume — signaling a potential trend reversal.
It’s now retesting the breakout zone near the 0.382–0.5 Fib level, which could act as a support area before the next leg up.
If this reclaim holds, upside targets extend toward $0.017+—a 40%+ move from here.
Keep it on your radar.
DYOR, NFA.

TradeCityPro | AVAX: Watching Key Resistance in RWA Uptrend👋 Welcome to TradeCity Pro!
In this analysis, I’ll be reviewing the AVAX coin — one of the popular RWA projects in crypto with a high market cap.
🔍 This coin currently has a market cap of $9.94 billion and ranks 14th on CoinMarketCap.
⏳ 4-Hour Timeframe
As shown on the 4-hour chart, there’s a clear ascending trendline that has been tested several times. There was also a fake breakout below the trendline, and now price is reacting to it once again.
⚡️ A resistance level has formed at 23.90, which the price has reacted to. Given the recent bounce off the trendline, the probability of breaking 23.90 has increased.
✔️ A break above 23.90 offers a potential long entry, though this isn’t the main long trigger. The target for this move would be 25.78. The main long position should be considered after a breakout above 25.78.
💥 The 25.78 zone is a key resistance level that marked the top of previous bullish legs, so breaking it could lead to a strong bullish trend.
🔽 On the flip side, if the price prints a lower high below 25.78 and moves back toward the trendline, the probability of breaking the trendline increases.
✨ If the trendline breaks, the confirmation trigger would be 22.10. A break below 22.10 opens a short setup, with the next support level located at 19.23.
📊 Currently, market volume is favoring the buyers. With renewed buying volume off the trendline, if this momentum continues, the bullish scenario becomes more likely.
📝 Final Thoughts
This analysis reflects our opinions and is not financial advice.
Share your thoughts in the comments, and don’t forget to share this analysis with your friends! ❤️

ETH - Ethereum Weekly Chart🔍 Market Structure & Smart Money Analysis:
✅ Bullish Signs:
Recent CHoCH at $2,000: Suggests shift from bearish to bullish order flow
BOS above recent resistance: Confirms upward market structure
Stochastic Oscillator: Turning bullish from oversold area (momentum confirmation)
Volume Pickup: Suggests stronger buyer interest
🧠 Liquidity Zones:
Equal Lows (EQL) seen in 2023 and again near 2024 → were taken out → classic liquidity sweep before reversal
Weak High near $4,951: A future potential liquidity target
Supply Zone around $3,200–$3,700: Previously strong resistance, could act as a rejection point again
🧭 Trend Summary:
Macro Structure: Recovering from multi-month downtrend
Short-Term: Bullish momentum building post-reversal
Next Objectives:
Bullish target: $3,200–$3,700 (possible pause or reversal zone)
Bearish invalidation: Drop below $2,000 with strong candle body
📝 Conclusion & Outlook:
ETH has likely confirmed a bullish shift on the weekly timeframe with the CHoCH and BOS above $2K.
Immediate upside targets are within the $3,200–$3,700 region before facing stronger resistance.
This could be the beginning of a longer-term accumulation → markup cycle, targeting the $4,950+ liquidity zone eventually.
Keep monitoring weekly closes and volume, and watch for divergence or rejection signals near supply zones.
-------------------
----------------------------
Low Market Cap #RWA #RealEstate #Tokenization Platforms by FDV
SQRB $100K on PROBIT
$RNB $310K
$HTS $1.9M
$STBU $3.5M
LAND $3.6M
-----
Not for recommendations to BUY SELL any stocks, cryptos, FX or securities
Not for Financial Advise
DYOR

MantraDAO Easy 810% Target —Sell High, Buy Low!Just as selling and profit taking happens naturally when prices trade high near a new All-Time High, buying also happens naturally at support.
OMUSDT was trading at a new All-Time High in February 2025 and smart traders and holders took profits. This taking profits results in a long-term higher low and a new buy-opportunity.
Always remember, never buy when prices are high up or after a strong bullish wave. Why? Because whales tend to sell when prices are high. Only buy when prices are low.
OMUSDT is trading pretty low right now compared to February 2025. We had 96% correction, but the correction bottom is still a very strong higher low compared to the start of the bullish cycle and wave. After the correction is over, which in this case is early May, we will have a new growth wave.
Easy target can be seen on the chart as 810%.
It can go higher and this is a new All-Time High. We are going with the easy target for this one. An easy trade.
Namaste.

TradeCityPro | IOTA: Testing Key Resistance in RWA-DePIN Rally👋 Welcome to TradeCity Pro!
In this analysis, I’m going to review the IOTA coin for you. This project is one of the RWA and DePIN-based initiatives and is among the older projects in this category.
✔️ The coin has a market cap of $822 million and ranks 85th on CoinMarketCap.
📅 Daily Timeframe
As you can see on the daily timeframe, after finding support at 0.1547, the price initiated a bullish leg and moved up to the resistance zone I’ve marked.
💥 This area is a very significant resistance zone, and in this bullish leg, the price has reached it for the first time and got rejected.
🔍 In my view, as long as the price hasn’t confirmed a breakout above 0.1960, the chance of starting a downtrend is higher than continuing the current uptrend. If this resistance zone is broken, we can consider it strong confirmation of buyer strength.
📈 For a long position, we can enter on the breakout of this same zone. For spot buying, this trigger can also be used, but the main long-term triggers are 0.3774 and 0.4918.
⚡️ On the RSI oscillator, there's an important zone at the 50 level. If this level is broken, the probability of breaking 0.1960 increases. If that happens, the next support zone will be 0.1547.
📊 Make sure to pay close attention to volume. If any of our triggers are activated without volume confirmation, the likelihood of a fake breakout increases.
❌ Disclaimer ❌
Trading futures is highly risky and dangerous. If you're not an expert, these triggers may not be suitable for you. You should first learn risk and capital management. You can also use the educational content from this channel.
Finally, these triggers reflect my personal opinions on price action, and the market may move completely against this analysis. So, do your own research before opening any position.

ALTCOIN BOOM FOR SwissBorg 2025-2026 PROPOSALSwissBorg ( OMXSTO:BORG ) is a decentralized wealth management platform offering user-friendly crypto investment tools, including yield-generating accounts, portfolio management, and a community-driven DAO. Its mission is to democratize access to sophisticated financial strategies, blending TradFi reliability with DeFi innovation. Think of it as the "Robinhood of crypto"—but with Swiss precision, focusing on security and user empowerment.
Recent News Launched "Smart Engine 2.0" this month, an AI-driven portfolio optimizer supporting multi-chain assets. Partnered with Deutsche Bank to integrate Euro (EUR) stablecoin settlements. OMXSTO:BORG surged 35% in July, outperforming major altcoins.
Deep Dive SwissBorg is capitalizing on two key trends: AI-powered fintech and institutional crypto adoption. Its collaboration with Deutsche Bank signals growing TradFi interest in crypto. However, competition is fierce (e.g., Celsius, BlockFi pre-collapse), so SwissBorg must maintain strict regulatory compliance and a technological edge.
Latest Tech or Utility Update
Update Details "Smart Engine 2.0" leverages machine learning to auto-rebalance portfolios across Ethereum, Solana, and Polygon. Additionally, SwissBorg has introduced "BORG Shield," a multi-sig vault designed for institutional clients.
Implications AI-driven tools could appeal to retail investors seeking passive strategies, while BORG Shield caters to institutional players. The multi-chain focus future-proofs the platform, though reliance on AI carries risks if market volatility outpaces algorithmic adjustments.
Biggest Partner & Investment Amount
Partnership Spotlight Deutsche Bank has invested $15M into SwissBorg’s infrastructure, with a three-year roadmap for joint product development.
Impact Analysis Deutsche Bank’s involvement reinforces SwissBorg’s compliance-first strategy. Expect Euro-denominated products and smoother fiat ramps, potentially onboarding millions of EU users. Long term, this partnership could position OMXSTO:BORG as a gateway for European institutional capital.
Most Recently Added Partner & Details
New Collaboration SwissBorg has partnered with Chainlink to integrate real-world asset (RWA) price feeds into its Smart Engine. While no direct investment occurred, the collaboration establishes a two-year technical alliance.
Future Prospects Reliable RWA data enhances trust in SwissBorg's portfolio tools. In the short term, this strengthens the platform’s technological credibility; long term, it could pave the way for tokenized stock trading, potentially competing with platforms like eToro.
Tokenomics Update
Token Dynamics Burned 2% of total supply (4M OMXSTO:BORG ) via buybacks in Q2. Staking rewards reduced to 6% APY (from 8%) but now include revenue-sharing from platform fees. DAO voting power is now weighted by staking duration (up to a 2x multiplier).
Deep Analysis Burns and revenue-sharing introduce deflationary mechanics and utility layers. Lower APY might discourage short-term stakers, but longer lock-ups align holders with the DAO’s long-term success. However, if platform revenue declines, staker payouts could underwhelm investors.
Overall Sentiment Analysis
Market Behavior Mixed signals: Whale accumulation is increasing (top 100 wallets grew 12%). Retail traders are taking profits following the July surge. Social sentiment remains bullish (70% positive), largely driven by Deutsche Bank hype.
Driving Forces Institutional partnerships and AI adoption are fueling optimism. Some concerns remain over SwissBorg’s level of control over DAO governance, raising centralization risks.
Deeper Insights Sentiment depends heavily on Deutsche Bank’s execution. A smooth rollout of joint products could propel OMXSTO:BORG higher, but delays might trigger retail sell-offs.
Recent Popular Holders & Their Influence
Key Investors Crypto.com Ventures acquired $5M worth of OMXSTO:BORG in July. Pseudonymous whale "0x7e12" bought 1.2M OMXSTO:BORG tokens, now ranking among the top 20 holders.
Why Follow Them? Crypto.com’s investment signals confidence in SwissBorg’s B2B2C model. Whale "0x7e12" is known for front-running exchange listings, suggesting speculation around future liquidity events.
Summary & Final Verdict
Recap SwissBorg combines AI-driven automation, institutional partnerships, and DAO governance to carve out a niche in crypto wealth management. Its deflationary tokenomics and EU market focus provide regional dominance potential.
Final Judgment OMXSTO:BORG is a high-risk, high-reward asset. It could 5x if Deutsche Bank integration succeeds and AI-driven tools gain traction. However, regulatory scrutiny or operational missteps could hinder momentum.
Considerations Can SwissBorg scale without sacrificing decentralization? Will AI-driven tools outperform human-led strategies during a bear market? How dependent is OMXSTO:BORG on favorable EU crypto regulations?
If you're bullish on AI + TradFi convergence, accumulation may be worthwhile. If concerned about centralized DAO structures, waiting for deeper corrections may be prudent.

ALTCOIN BOOM FOR CHINTAI 2025-2026 PROPOSALCHEX (Chintai) is a blockchain platform focused on tokenizing real-world assets (RWA) like real estate, carbon credits, and private equity. It’s built to streamline compliant digital securities trading, targeting institutions and enterprises that need regulatory-friendly solutions. Think of it as the "bridge" between TradFi and DeFi, emphasizing compliance without sacrificing blockchain’s efficiency.
Recent News
Chintai secured a key regulatory approval in Singapore this month, enabling it to operate as a licensed digital asset custodian.
Partnership with a major Asian bank to tokenize $500M in carbon credits.
CHEX token surged 40% in July, outpacing the broader market.
Deep Dive
RWA tokenization is crypto’s hottest narrative in 2024, and CHEX is positioning itself as a compliance-first player. The Singapore license is a big deal because it signals trust in strict jurisdictions. Meanwhile, carbon credit deals align with ESG trends, attracting institutional capital. However, competition is fierce (Polymath, Ondo), so execution is critical.
Latest Tech or Utility Update
Update Details
Chintai rolled out "Multi-Chain Settlement," allowing assets to move across Ethereum, Polygon, and XRPL. They also introduced dynamic compliance tools for issuers, automating KYC/AML checks.
Implications
Multi-chain support reduces friction for institutions using diverse networks. The compliance tools lower barriers for TradFi adoption, but centralized control over KYC might clash with DeFi purists. Still, this cements CHEX as a go-to for regulated entities.
Biggest Partner & How Much Was Invested
Partnership Spotlight
Standard Chartered Bank invested $10M in Chintai’s infrastructure development over 2 years.
Impact Analysis
Standard Chartered brings credibility and a massive client base. The investment likely funds RWA tokenization pipelines in Asia and Europe. If successful, this could make CHEX a default platform for banks dipping into blockchain.
Most Recent Added Partner & Details
New Collaboration
Chintai teamed up with ClimateTrade (carbon offset platform) to tokenize $200M in renewable energy credits. No direct investment, but revenue-sharing for 3 years.
Future Prospects
This taps into the booming ESG investment sector. Short-term, it boosts CHEX’s volume; long-term, it could anchor CHEX as a climate-focused RWA leader.
Tokenomics Update
Token Dynamics
Reduced max supply by 5% via buybacks funded by platform fees.
Staking APY increased to 12% (up from 8%) to incentivize holding.
New burn mechanism: 0.5% of transaction fees destroyed quarterly.
Deep Analysis
Scarcity + staking rewards = bullish combo. The burn mechanism is modest but signals commitment to deflation. However, staking rewards depend on platform revenue growth. If adoption lags, APY could drop, triggering sell pressure.
Overall Sentiment Analysis
Market Behavior
Traders are accumulating CHEX, with exchange reserves dropping 15% this month. Social volume spiked 200% after the Singapore license news.
Driving Forces
Hype around RWA + regulatory wins. Fear of missing out (FOMO) is real, but some worry CHEX’s centralized compliance tools could limit DeFi appeal.
Deeper Insights
Sentiment is overly reliant on partnerships and regulation. A regulatory setback or failed institutional adoption could crater momentum.
Recent Popular Holders & Their Influence
Key Investors
Amber Group bought 2M CHEX tokens this month.
A crypto VC, HashKey Capital, increased its stake by 30%.
Why Follow Them?
Amber Group is known for front-running institutional trends. HashKey’s bet aligns with Asia’s pro-RWA regulatory shift. Their moves suggest confidence in CHEX’s regulatory edge.
Summary & Final Verdict
Recap
CHEX is riding the RWA wave with strong compliance tech, high-profile banking partners, and deflationary tokenomics. Its focus on carbon credits and Asia’s markets gives it a niche edge.
Final Judgment
CHEX has gem potential , but only if it maintains regulatory momentum and scales adoption. The tokenomics are solid, and partnerships are elite, but it’s still a "bet on institutions adopting crypto."
Considerations
Can CHEX stay ahead of RWA competitors?
Will institutions actually use the platform, or is this just partnership theater?
How sensitive is CHEX to crypto’s macro trends vs. its own fundamentals?
If you’re bullish on TradFi adoption, CHEX is a hold. If you think RWA is overhyped, tread carefully.

TradeCityPro | QNT: Range Top Test in RWA Uptrend Structure👋 Welcome to TradeCity Pro!
In this analysis, I’m going to review the QNT coin — one of the RWA projects currently ranked 71 on CoinMarketCap with a market cap of $1.19 billion.
⏳ 4-Hour Timeframe
As you can see, there’s a clear uptrend along with a trendline that has pushed the price up to the 100.7 level.
💥 At the moment, the price has formed a range box between 93.1 and 100.7, with multiple touches on both ends. Currently, the price is testing the top of this range at 100.7 once again.
🔍 If the 100.7 resistance is broken, we can consider entering a long position. This trigger is valid for a long, and if confirmed, the price could potentially move toward the next target at 121.8.
✨ For a short position, we first need to see the trendline break and the 93.1 level get triggered. That would serve as our first confirmation of a possible trend reversal.
📉 A breakdown below the 50 level on the RSI would be the first momentum-based sign of this reversal. If selling volume also increases at the same time, we’ll have confirmation of a volume divergence.
⚡️ On the other hand, a break of the trendline itself might act as an early trigger, but I personally wouldn’t open a position on that alone — it’s too risky. As long as the price holds above 93.1, the overall uptrend remains intact.
📝 Final Thoughts
This analysis reflects our opinions and is not financial advice.
Share your thoughts in the comments, and don’t forget to share this analysis with your friends! ❤️

CPOOL Bullish Reversal in Play? Key Levels To Watch!Yello, Paradisers! Could #CPOOL be setting up for a powerful breakout after months of pain? The price action is finally signaling that a major trend reversal might be brewing.
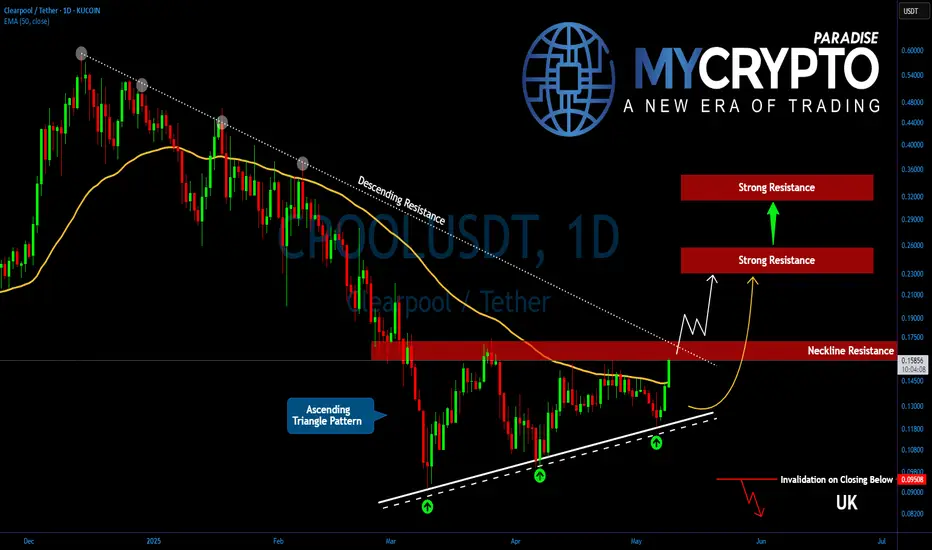
💎After an extended downtrend, CPOOL is now forming a bullish ascending triangle pattern—a classic structure that often leads to strong upside reversals. For the first time since January 19th, 2025, bulls have successfully pushed price above the EMA-50, indicating a shift in momentum.
💎#CPOOLUSDT is testing its neckline resistance between $0.1570 and $0.1720. This is the key breakout threshold—once breached with conviction, it’s expected to trigger a significant reversal wave and usher in a new bullish phase.
💎A confirmed breakout above $0.1720 would open the path toward the next major resistance between $0.230 and $0.250. This is the first profit-taking zone where short-term traders might look to offload positions. However, the structure suggests that this could just be the beginning.
💎If momentum continues, the full triangle breakout target lies higher—at $0.320 to $0.350. This area aligns with the 50% Fibonacci retracement level, making it a critical test zone for bulls. Traders should prepare for increased volatility and potential reversals in this zone, as it's likely to attract both sellers and momentum-driven buyers.
💎On the downside, primary support now rests at $0.1440, which is the current EMA-50 level. Below that, the ascending trendline support between $0.1275 and $0.1190 offers a firmer structural base and should be watched closely in the event of pullbacks.
Paradisers, strive for consistency, not quick profits. Treat the market as a businessman, not as a gambler.
MyCryptoParadise
iFeel the success🌴
TradeCityPro | QNT: Ranging Near Key Resistance in RWA Favorite👋 Welcome to TradeCity Pro!
In this analysis, I want to review the QNT coin for you. This project is one of the RWA projects that has been heavily hyped in recent months.
✔️ Currently, this coin has a market cap of $908 million and ranks 72 on CoinMarketCap.
⏳ 4-Hour Timeframe
On the 4-hour timeframe, as you can see, there is an upward trend along with a curved trendline that has caused the price to move from the bottom of 59.9 to 76.8.
💫 After the price reached the resistance at 76.8, a ranging box has formed, and volume has also been decreasing. A temporary support bottom has formed at the 73.8 area, and the price is ranging between these levels.
📊 Now, with the ranging box that has formed, the price has reached the curved trendline, and this trendline can potentially lead to bullish momentum entering the market.
💥 On the other hand, the RSI oscillator is also on important support at the 50 level, and if the price is supported by this trendline, the RSI moves upward again, and volume increases, we can enter a long position with the breakout of 76.8.
🔍 An important point about this entry is that there is a very strong resistance at the 80.1 area, and if you enter a position on the breakout of 76.8, you probably won't see much profit until the price reaches 80.1.
🎲 So basically, the 76.8 trigger is a preliminary trigger for the breakout of 80.1, and if I open a position on the breakout of 76.8, I won’t close it at 80.1 and will wait to see if the price breaks through the 80.1 area or not. In my opinion, this position is worth the risk because if 80.1 breaks, a very large reward could result from this position.
🔽 But if you want to take less risk, you can wait and open your position with the breakout of 80.1 itself. Naturally, since this area is a major resistance and the entry point is higher than 76.8, opening a position at that level will be harder and the likelihood of getting a proper confirmation candle is lower than with 76.8.
📉 For a short position, if we want to get a trigger from the chart itself, considering the decreasing volume and price reaching the curved trendline, if this trendline breaks and the 73.8 trigger is activated, we can enter a position. RSI confirmation would also be the break of the 50 area, and with that break, we could also get momentum confirmation.
🔑 But the point is that we must also consider market conditions. For example, in the current market conditions, the overall trend of Bitcoin and indexes like Total and Total2 has been bullish in recent weeks, and we can’t get bearish confirmation from these indexes.
✨ So it's possible that with the break of 73.8, the price moves downward, but because the indexes I mentioned also affect altcoins, with the continuation of their bullish trend, the downtrend of QNT may come to an end and its trigger may become a fakeout. That's why it’s better to wait for Bitcoin and the indexes to confirm a trend reversal before looking for short triggers.
📝 Final Thoughts
This analysis reflects our opinions and is not financial advice.
Share your thoughts in the comments, and don’t forget to share this analysis with your friends! ❤️

TradeCityPro | ALGO: Key Levels in RWA Coin’s Bullish Revival👋 Welcome to TradeCity Pro!
In this analysis, I’m going to review the ALGO coin for you. This project is one of the RWA (Real World Assets) crypto initiatives, which saw significant growth during the recent hype around this category.
💫 Currently, the market cap of this project stands at $1.99 billion, placing it at rank 47 on CoinMarketCap among crypto projects.
📅 Daily Timeframe
As you can see in the daily timeframe, ALGO has had a notable bullish leg that started from the 0.1085 level and continued up to 0.5138, marking a significant upward move.
💥 However, after reaching that level, the first corrective phase took place down to the 0.3267 support. After breaking this zone, the price continued falling to the 0.1602 support, which also overlaps with the 0.786 Fibonacci level.
🔍 After finding support there, a new high formed at 0.2147, and thanks to the strong buying volume and bullish candles, this resistance has been broken, and price is now heading upward.
📊 The RSI oscillator is currently very close to the Overbought zone, and if it enters that area, we might see some high-volatility moves, increasing the likelihood of sharp bullish candles.
📈 The next resistance levels above are 0.2553 and 0.3267, which align with the 0.5 and 0.382 Fibonacci levels respectively. If price can break through these levels and return to 0.5138, the chances of breaking that top will be significantly higher this time.
✨ On the other hand, if this breakout turns out to be a fake move and price falls below 0.2147, heavy bearish momentum could enter the market, greatly increasing the risk of breaking the 0.1602 level.
🎲 If the market continues to drop, the next major support to watch is 0.1085, which stands as the most critical support for ALGO.
📝 Final Thoughts
This analysis reflects our opinions and is not financial advice.
Share your thoughts in the comments, and don’t forget to share this analysis with your friends! ❤️
