BITCOIN 2025 - THE LAST HOPECRYPTOCAP:BTC currently finds itself at the intersection of geopolitical tensions and broader macroeconomic uncertainty. Although traditionally viewed as a hedge against systemic risk, it is presently exhibiting characteristics more aligned with high-risk assets. The FED's forthcoming policy decisions will likely play a pivotal role in determining whether Bitcoin stabilizes or experiences further downward pressure.
The chart represents the most optimistic scenario for Bitcoin to date
Safehaven

CHF is the new gold? Safe-haven flows keep pressure on USDCHFBank of America argues that the Swiss franc has reasserted itself as the true safe-haven hedge.
BofA says the trend of the CHF being used more like gold, and a hedge against problems like rising US debt, could continue. Unlike the yen, which has lost much of its appeal as a pure haven.
Technically, recent candles might indicate buyers are attempting to build a base, but there’s no decisive reversal yet.
Should price fail to reclaim the 0.8030–0.8050 region soon, the broader bearish structure could resume - possibly testing fresh lows. Meanwhile, rallies in USD/CHF may face pressure as the franc’s macro backdrop continues to attract inflows.

Everybody loves Gold Part 5Keeping it steady and reasonable
Part 5 weekly path is as shown.
Here's a breakdown of trading dynamics:
1. Expecting price to break past green line, level of significance (LOS) for continuation down
2. Price might bounce back for which; will be looking for a continuation from +50/+100 or +150pips to the downside
3. Will be looking for double tops/bottom along the way: Last week saw classic double top formed around level of significance (LOS)
As always price action determines trades

Gold eased slightly as Middle East risk receded
Safe-haven demand for gold eased slightly as geopolitical risks in the Middle East subsided. However, the downside was limited by a weaker dollar. Market sentiment around a potential escalation in regional tensions also softened, particularly as the likelihood of a Strait of Hormuz blockade declined despite preemptive US strikes. Looking ahead, gold prices may exhibit heightened volatility depending on Fed Chair Powell’s upcoming congressional testimony and the release of the May PCE inflation data.
XAUUSD failed to reenter the ascending channel and retreated below 3360. EMA21 is narrowing its gap with EMA78, signaling a potential shift toward a bearish structure. If XAUUSD breaks below the support at 3320, the price may decline further to 3280. Conversely, if XAUUSD reenters the channel, the price could gain upward momentum toward the resistance at 3400.

ETH - Do you Notice a Pattern here? I DO...Hello TradingView Family / Fellow Traders. This is Richard, also known as theSignalyst.
📈I find ETH 4h chart as it looks like history repeating itself.
Previously in 1 to 5 June, it formed a slight lower low before starting the next big bullish impulse leading towards the upper bound of the channel.
📚 Today, ETH just formed the slight lower low we are looking for.
Is it time for the next bullish impulse to start? well it will be confirmed after breaking above the last major high at $2,600.
What do you think?
📚 Always follow your trading plan regarding entry, risk management, and trade management.
Good luck!
All Strategies Are Good; If Managed Properly!
~Rich

BTC is Bullish!Hello TradingView Family / Fellow Traders. This is Richard, also known as theSignalyst.
📈BTC has been overall bullish trading within the rising channel marked in blue.
Moreover, the red zone is a strong structure!
🏹 Thus, the highlighted blue circle is a strong area to look for buy setups as it is the intersection of structure and lower blue trendline acting as a non-horizontal support.
📚 As per my trading style:
As #BTC approaches the blue circle zone, I will be looking for bullish reversal setups (like a double bottom pattern, trendline break , and so on...)
📚 Always follow your trading plan regarding entry, risk management, and trade management.
Good luck!
All Strategies Are Good; If Managed Properly!
~Rich

Gold Breaks Out as Iran Tensions Flare🚨 Israel’s Iran strike fears are sending gold ( OANDA:XAUUSD ) soaring to $3448!
reports Israel may target Iran’s nuclear sites (June 16, 2025), fueling safe-haven demand as oil prices climb.
4H Chart Analysis:
Price Action: XAUUSD cleared $3440 resistance (a June 2025 high) after a 2-week consolidation, confirming an uptrend.
Volume: 4H volume surged 20% vs. the prior week, reflecting strong buying pressure.
Key Levels:
Current Support: $3440 (former resistance, now support, tested today).
Next Support: $3410-$3420 (consolidation low, held three times since June 1, 2025).
Context: Gold is up 6.49% this month, with $3448 the highest 4H close since May 2025, driven by Middle East risks.
The $3440 breakout with high volume shows buyers dominating. $3410-$3420 is a key support zone for pullbacks, backed by recent price action. Track Iran news and volume for breakout strength or reversal signals.
How’s your 4H gold setup looking? Drop your charts! 👇 #GoldPrice #XAUUSD #IsraelIran #SafeHaven #TradingView

ETH is doing it AGAIN!Hello TradingView Family / Fellow Traders. This is Richard, also known as theSignalyst.
📈ETH has been overall bullish trading within the flat rising channels marked in blue.
Moreover, the green zone is a strong support zone!
🏹 Thus, the highlighted blue circle is a strong area to look for buy setups as it is the intersection of support and lower blue trendlines acting as non-horizontal support.
📚 As per my trading style:
As #ETH approaches the blue circle zone, I will be looking for bullish reversal setups (like a double bottom pattern, trendline break , and so on...)
📚 Always follow your trading plan regarding entry, risk management, and trade management.
Good luck!
All Strategies Are Good; If Managed Properly!
~Rich

Gold Poised to Shine - 18% Upside Projected by Completing Wave 5Gold is currently trading around 494.92 RMB per gram in China as of July 25, 2023. Based on the technical analysis on XAUCNY showing we are currently in wave 5, subwave 4 of an upward trend, the prediction is that by January 2025, the price for 1 ounce of gold will reach 16575 RMB.
Given that 1 ounce equals 28.3495 grams, a price of 16575 RMB per ounce implies that the price per gram of gold is expected to reach around 584 RMB by January 2025.
This represents an increase of approximately 18% from the current price of 494.92 RMB per gram. Going from subwave 4 to subwave 5 typically signals the final leg of an advancing trend before it completes the larger degree wave 5. If the analysis is correct, we can expect the 18% price increase to occur over the next 1.5 years as gold enters the terminal subwave 5.
The ongoing expansionary monetary policies by central banks globally serves as a key driver supporting higher gold prices. High inflation levels in many economies incentivizes investors to allocate more funds to gold as an inflation hedge. Geopolitical tensions, such as the Russia-Ukraine conflict also increase safe-haven demand for gold.
While risks remain, such as potential interest rate hikes that strengthen the dollar, the overall backdrop still seems conducive for higher gold prices. From a technical perspective, the upside projection toward 584 RMB per gram over the next 1.5 years aligns with the view that subwave 5 will see accelerating upside momentum toward completing wave 5.
In summary, based on current technical analysis, the prediction is that gold will reach 584 RMB per gram by January 2025, an 18% increase from today's levels, as it completes the final wave 5 uptrend over the coming months. The macroeconomic and geopolitical environment also seem supportive of this view.

Safe-Haven Demand Boosts Gold as Middle East Tensions EscalateHey Traders,
In today’s trading session, we are monitoring XAUUSD for a buying opportunity around the 3,380 zone. Gold is currently trading in an uptrend and is experiencing a correction phase as it pulls back toward this key support and resistance area.
On the fundamental side, reports indicate that Israel struck Iran overnight — fueling a classic geopolitical risk-off sentiment. This escalation is driving strength in safe-haven assets while putting pressure on riskier markets. Gold typically benefits from this kind of uncertainty, adding further weight to the technical setup we’re seeing today.
Trade safe,
Joe

GOLD - Third Wave Next!Hello TradingView Family / Fellow Traders. This is Richard, also known as theSignalyst.
📈After breaking above the $3,330 structure, GOLD's momentum shifted to bullish again from a short-term perspective.
Moreover, the $3,310 is a strong demand as Gold made an explosive movement from it.
🏹 Thus, the highlighted blue circle is a strong area to look for buy setups as it is the intersection of support, demand and red trendline acting as a non-horizontal support.
📚 As per my trading style:
As #XAUUSD retests the blue circle zone, I will be looking for bullish reversal setups (like a double bottom pattern, trendline break , and so on...)
📚 Always follow your trading plan regarding entry, risk management, and trade management.
Good luck!
All Strategies Are Good; If Managed Properly!
~Rich
Disclosure: I am part of Trade Nation's Influencer program and receive a monthly fee for using their TradingView charts in my analysis.

Gold - Correction Phase Extended!Hello TradingView Family / Fellow Traders. This is Richard, also known as theSignalyst.
📈 As per our latest Gold analysis, price rejected the $3,100 – $3,150 support zone and traded higher.
However, Gold is still in a correction phase, moving within a falling red channel.
This week, it has been rejecting the upper bound of the channel, reinforcing bearish pressure.
⛔ As long as the upper red trendline holds, the bears remain in control.
✅ For momentum to shift back in favor of the bulls, a clear break above the upper red trendline is needed.
📚 Always follow your trading plan regarding entry, risk management, and trade management.
Good luck!
All Strategies Are Good; If Managed Properly!
~Rich
Disclosure: I am part of Trade Nation's Influencer program and receive a monthly fee for using their TradingView charts in my analysis.

Gold - Follow The Macro Trend!Hello TradingView Family / Fellow Traders. This is Richard, also known as theSignalyst.
📈 GOLD has been overall bullish from a macro perspective trading within the rising wedge pattern in orange.
After rejecting the $3,500 round number and upper bound of the wedge, XAUUSD signaled the start of the correction phase as marked by the red falling channel.
Moreover, the $3,100 - $3,150 zone is a strong support.
🏹 Thus, the highlighted blue circle is a strong area to look for buy setups as it is the intersection of support and lower orange trendline acting non-horizontal support.
📚 As per my trading style:
As #XAUUSD approaches the blue circle zone, I will be looking for bullish reversal setups (like a double bottom pattern, trendline break , and so on...)
📚 Always follow your trading plan regarding entry, risk management, and trade management.
Good luck!
All Strategies Are Good; If Managed Properly!
~Rich
Disclosure: I am part of Trade Nation's Influencer program and receive a monthly fee for using their TradingView charts in my analysis.

BTC - The Perfect Retest!Hello TradingView Family / Fellow Traders! This is Richard, also known as theSignalyst.
The picture says it all!
🔄Is history about to repeat itself?
If so, we are currently in Phase 2. 📈
What’s next? A dip toward the $87,000 - $88,000 zone would be the perfect retest to look for trend-following longs and expect the start of Phase 3.
📚 Reminder:
Always stick to your trading plan — entry, risk management, and trade management are key.
Good luck, and happy trading!
All Strategies Are Good, If Managed Properly!
~Rich

Gold is still Strong; Long-Term!Hello TradingView Family / Fellow Traders. This is Richard, also known as theSignalyst.
📈GOLD has been overall bullish from a macro perspective trading within the rising wedge pattern in orange.
After rejecting the $3,500 round number and upper bound of the wedge, XAUUSD signaled the start of the correction phase.
Moreover, the $3,100 - $3,150 zone is a strong support.
🏹 Thus, the highlighted blue circle is a strong area to look for buy setups as it is the intersection of support and lower orange trendline acting non-horizontal support.
📚 As per my trading style:
As #XAUUSD approaches the blue circle zone, I will be looking for bullish reversal setups (like a double bottom pattern, trendline break , and so on...)
📚 Always follow your trading plan regarding entry, risk management, and trade management.
Good luck!
All Strategies Are Good; If Managed Properly!
~Rich
Disclosure: I am part of Trade Nation's Influencer program and receive a monthly fee for using their TradingView charts in my analysis.

Haven play: Long yen back in focusAmid growing uncertainty surrounding U.S. equities and the US dollar, investors could be returning to a traditional defensive strategy: going long on the Japanese yen.
While some analysts believe the recent yen rally is not yet overstretched, the International Monetary Fund (IMF) has noted that Japan’s central bank is likely to push back the timing of further interest rate hikes, a factor that could limit the yen's potential to strengthen further. As such, we are looking at the support level of 140.00 and the bearish-yen sentiment seen today, and the potential resistance at 144.80.
Up next: a scheduled meeting between Japan’s Finance Minister Kato and U.S. Treasury Secretary Bessent later this week.

Will Gold Retest 3170 ATHs in Sight Amid Rising Global TensionsXAU/USD has decisively broken above the significant 3170 resistance level, confirming bullish momentum and signaling a potential continuation of its long-term uptrend. This breakout is not just technical—it's backed by a growing fundamental storm.
With escalating geopolitical tensions, the ongoing trade war rhetoric surrounding Trump’s tariff policies, and persistent global macro uncertainty, gold is once again asserting its role as a premier safe haven asset. These drivers are creating the perfect backdrop for further upside, possibly pushing gold toward new all-time highs.
Currently, price is in a healthy correction phase, pulling back toward the former resistance zone at 3170, which now acts as strong support. A retest and confirmation in this area may offer a high-probability long setup for trend-followers and breakout traders alike.

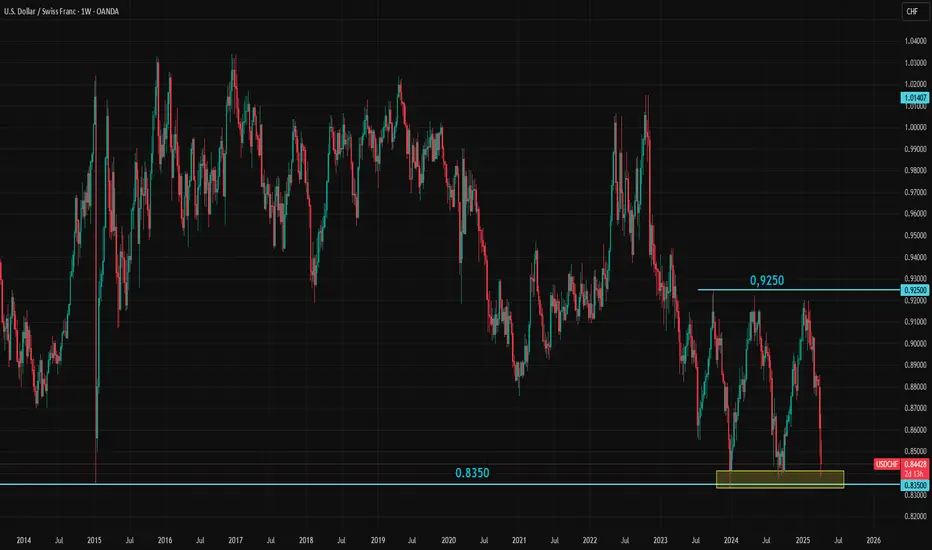
USDCHF Tests 0.8350: Break or Bounce?USDCHF is testing the critical 0.8350 support level amid rising safe haven demand. Yesterday’s chaos in the bond market highlighted how few places investors have to park their money. One of the most widely accepted safe haven assets is the Swiss franc, and current demand for CHF is clearly strong. But is it strong enough?
There hasn't been a weekly close below 0.8350 since 2011, and this level has held firm through several sharp market moves since then. Now, this major support is being tested once again.
Whether it breaks or holds, a significant swing trading opportunity could be on the horizon, especially given the heightened uncertainty surrounding the global trade environment.
GOLD - Eyeing Two Levels!Hello TradingView Family / Fellow Traders. This is Richard, also known as theSignalyst.
📈 XAUUSD remains overall bullish in both the short and medium term, trading within the rising channels marked in orange and green.
🔍 Here are two key levels I'm watching for potential trend-following long setups:
1️⃣$3,000 – A psychological round number that aligns with the lower orange trendline.
2️⃣$2,950 – A support level that intersects with the lower blue trendline.
Let’s see if the bulls hold the line! 🐂✨
📚 Always follow your trading plan regarding entry, risk management, and trade management.
Good luck!
All Strategies Are Good; If Managed Properly!
~Rich
Disclosure: I am part of Trade Nation's Influencer program and receive a monthly fee for using their TradingView charts in my analysis.

US10Y: 10-Year Treasury Yield – Safe Bet or Yield Trap?(1/9)
Good morning, everyone! ☀️ US10Y: 10-Year Treasury Yield – Safe Bet or Yield Trap?
With the 10-year yield at 4.358%, is it time to lock in safety or wait for better rates? Let’s break it down! 🔍
(2/9) – YIELD PERFORMANCE 📊
• Current Yield: 4.358% as of Mar 25, 2025 💰
• Historical Context: Above pandemic lows (~1-2%), below early 2000s (5-6%), per data 📏
• Sector Trend: Inverted yield curve signals caution, per economic reports 🌟
It’s a mixed bag—let’s see what’s cooking! ⚙️
(3/9) – MARKET POSITION 📈
• Safe Haven: U.S. Treasuries are risk-free ⏰
• Income Appeal: 4.358% yield draws income seekers 🎯
• Potential Upside: If rates fall, bond prices rise 🚀
Firm in safety, with growth potential! 🏦
(4/9) – KEY DEVELOPMENTS 🔑
• Inverted Yield Curve: 2-year yield higher, hinting at slowdown, per data 🌍
• Fed Outlook: Expected rate cuts later in 2025, per posts on X 📋
• Market Reaction: Investors balancing income with economic risks 💡
Navigating through uncertainty! 💪
(5/9) – RISKS IN FOCUS ⚡
• Interest Rate Risk: If rates rise, bond prices drop 🔍
• Inflation Risk: Erodes real returns if inflation outpaces yield 📉
• Opportunity Cost: Missing higher returns from stocks ❄️
It’s a trade-off—risks are real! 🛑
(6/9) – SWOT: STRENGTHS 💪
• Risk-Free: No default risk, backed by U.S. government 🥇
• Liquidity: Active market for trading, per data 📊
• Tax Benefits: Interest exempt from state, local taxes 🔧
Got solid foundations! 🏦
(7/9) – SWOT: WEAKNESSES & OPPORTUNITIES ⚖️
• Weaknesses: Interest rate and inflation risks, per economic reports 📉
• Opportunities: Capital gains from falling rates, diversification benefits 📈
Can it deliver both income and growth? 🤔
(8/9) – POLL TIME! 📢
US10Y at 4.358%—your take? 🗳️
• Bullish: Buy now, rates will fall soon 🐂
• Neutral: Hold, wait for more clarity ⚖️
• Bearish: Wait for higher yields or better opportunities 🐻
Chime in below! 👇
(9/9) – FINAL TAKEAWAY 🎯
US10Y offers a steady yield with safety, but with an inverted curve, caution is advised. Gem or bust?

$XAUUSD (Gold): Golden Rally or Gilded Pause?(1/9)
Good morning, everyone! ☀️ XAUUSD (Gold): Golden Rally or Gilded Pause?
With gold at $3,020.82, is this safe-haven surge a treasure or a tease? Let’s sift through the shine! 🔍
(2/9) – PRICE PERFORMANCE 📊
• Current Price: $ 3,020.82 per ounce as of Mar 25, 2025 💰
• Recent Move: Near $3,057 high from Mar 20, per data 📏
• Sector Trend: Precious metals up on tension, per posts on X 🌟
It’s a golden glow—let’s see if it holds! ⚙️
(3/9) – MARKET POSITION 📈
• Global Role: Top safe-haven asset ⏰
• Drivers: Central bank buying, geopolitical risks 🎯
• Trend: Bullish near $3,000, per data 🚀
Firm as a refuge, shining in uncertainty! 🏦
(4/9) – KEY DEVELOPMENTS 🔑
• Geopolitical Boost: Trade tensions linger, per data 🌍
• U.S. Data: PMI strength supports USD, caps gold, per posts on X 📋
• Market Reaction: Consolidating near $3,020-$3,030 💡
Simmering in a tense market! 🌩️
(5/9) – RISKS IN FOCUS ⚡
• Profit-Taking: Post-$3,000 sales loom 🔍
• U.S. Rates: Policy shifts could hit, per data 📉
• Oil Prices: CAD link affects broader forex ❄️
It’s a shiny tightrope—watch your step! 🛑
(6/9) – SWOT: STRENGTHS 💪
• Safe Haven: Thrives in chaos, per posts on X 🥇
• Central Banks: Steady buying props it up 📊
• Green Demand: Key in renewables, per data 🔧
Got a golden backbone! 🌟
(7/9) – SWOT: WEAKNESSES & OPPORTUNITIES ⚖️
• Weaknesses: Volatility from profit-taking 📉
• Opportunities: More tensions, rate cuts 📈
Can it gleam higher or dim out? 🤔
(8/9) – POLL TIME! 📢
Gold at $3,020.82—your take? 🗳️
• Bullish: $3,100+ soon, rally rolls 🐂
• Neutral: Steady, risks balance out ⚖️
• Bearish: $2,950 looms, correction hits 🐻
Chime in below! 👇
(9/9) – FINAL TAKEAWAY 🎯
Gold’s $3,020.82 price tags a safe-haven rally 📈, but volatility’s in the mix 🌿. Dips are our DCA jackpot 💰—buy low, ride high! Gem or bust?

Why gold remains strong: Latest on Ukraine and Yemen Gold remains in high demand as a safe-haven asset, currently trading at $2,998.7 per ounce.
Why the need for a haven? Here’s an update:
A ceasefire in Ukraine hinges on some unpalatable conditions. Donald Trump has announced plans to speak with Vladimir Putin on Tuesday, saying that land and power plants are part of the negotiations. Reports suggest his administration is considering recognising Crimea as Russian territory and may push for UN recognition.
In the Middle East, the U.S. carried out military strikes over the weekend on Houthi-controlled areas in Yemen. The strikes came after the group threatened to resume attacks on Red Sea shipping.
Trump has declared that Iran will be held directly responsible for “for every shot fired” by the Tehran-backed Houthi rebels. In response, the Houthis vowed to “respond to escalation with escalation.”.

Behind the Curtain: Unveiling Gold’s Economic Catalysts1. Introduction
Gold Futures (GC, MGC and 1OZ), traded on the CME market, are one of the most widely used financial instruments for hedging against inflation, currency fluctuations, and macroeconomic uncertainty. As a safe-haven asset, gold reacts to a wide range of economic indicators, making it crucial for traders to understand the underlying forces driving price movements.
By leveraging machine learning, specifically a Random Forest Regressor, we analyze the top economic indicators influencing Gold Futures on daily, weekly, and monthly timeframes. This data-driven approach reveals the key catalysts shaping GC Futures and provides traders with actionable insights to refine their strategies.
2. Understanding Gold Futures Contracts
Gold Futures (GC) are among the most actively traded futures contracts, offering traders and investors exposure to gold price movements with a range of contract sizes to suit different trading strategies. CME Group provides three types of Gold Futures contracts to accommodate traders of all levels:
o Standard Gold Futures (GC):
Contract Size: Represents 100 troy ounces of gold.
Tick Size: Each tick is 0.10 per ounce, equating to $10 per tick per contract.
Purpose: Ideal for institutional traders and large-scale hedgers.
Margin: Approximately $12,500 per contract.
o Micro Gold Futures (MGC):
Contract Size: Represents 10 troy ounces of gold, 1/10th the size of the standard GC contract.
Tick Size: Each tick is $1 per contract.
Purpose: Allows smaller-scale traders to participate in gold markets with lower capital requirements.
Margin: Approximately $1,250 per contract.
o 1-Ounce Gold Futures (1OZ):
Contract Size: Represents 1 troy ounce of gold.
Tick Size: Each tick is 0.25 per ounce, equating to $0.25 per tick per contract.
Purpose: Provides precision trading for retail participants who want exposure to gold at a smaller contract size.
Margin: Approximately $125 per contract.
Keep in mind that margin requirements vary through time as market volatility changes.
3. Daily Timeframe: Key Economic Indicators
Gold Futures respond quickly to short-term economic fluctuations, and three key indicators play a crucial role in daily price movements:
o Velocity of Money (M2):
Measures how quickly money circulates within the economy.
A higher velocity suggests increased spending and inflationary pressure, often boosting gold prices.
A lower velocity indicates stagnation, which may reduce inflation concerns and weigh on gold.
o Unemployment Rate:
Reflects the strength of the labor market.
Rising unemployment increases economic uncertainty, often driving demand for gold as a safe-haven asset.
Declining unemployment can strengthen risk assets, potentially reducing gold’s appeal.
o Oil Import Price Index:
Represents the cost of imported crude oil, influencing inflation trends.
Higher oil prices contribute to inflationary pressures, supporting gold as a hedge.
Lower oil prices may ease inflation concerns, weakening gold demand.
4. Weekly Timeframe: Key Economic Indicators
While daily fluctuations impact short-term traders, weekly economic data provides a broader perspective on gold price movements. The top weekly indicators include:
o Nonfarm Payrolls (NFP):
Measures the number of new jobs added in the U.S. economy each month.
Strong NFP numbers typically strengthen the U.S. dollar and increase interest rate hike expectations, pressuring gold prices.
Weak NFP figures can drive economic uncertainty, increasing gold’s safe-haven appeal.
o Nonfarm Productivity:
Represents labor efficiency and economic output per hour worked.
Rising productivity suggests economic growth, potentially reducing demand for gold.
Falling productivity can signal economic weakness, increasing gold’s appeal.
o Personal Spending:
Tracks consumer spending habits, influencing economic activity and inflation expectations.
Higher spending can lead to inflation, often pushing gold prices higher.
Lower spending suggests economic slowing, which may either weaken or support gold depending on inflationary outlooks.
5. Monthly Timeframe: Key Economic Indicators
Long-term trends in Gold Futures are shaped by macroeconomic forces that impact investor sentiment, inflation expectations, and interest rates. The most influential monthly indicators include:
o China GDP Growth Rate:
China is one of the largest consumers of gold, both for investment and jewelry.
Strong GDP growth signals robust demand for gold, pushing prices higher.
Slower growth may weaken gold demand, applying downward pressure on prices.
o Corporate Bond Spread (BAA - 10Y):
Measures the risk premium between corporate bonds and U.S. Treasury bonds.
A widening spread signals economic uncertainty, increasing demand for gold as a safe-haven asset.
A narrowing spread suggests confidence in risk assets, potentially reducing gold’s appeal.
o 10-Year Treasury Yield:
Gold has an inverse relationship with bond yields since it does not generate interest.
Rising yields increase the opportunity cost of holding gold, often leading to price declines.
Falling yields make gold more attractive, leading to price appreciation.
6. Risk Management Strategies
Given gold’s volatility and sensitivity to macroeconomic changes, risk management is essential for trading GC Futures. Key risk strategies may include:
Monitoring Global Liquidity Conditions:
Keep an eye on M2 Money Supply and inflation trends to anticipate major shifts in gold pricing.
Interest Rate Sensitivity:
Since gold competes with yield-bearing assets, traders should closely track interest rate movements.
Higher 10-Year Treasury Yields can weaken gold’s value as a non-yielding asset.
Diversification and Hedging:
Traders can hedge gold positions using interest rate-sensitive assets such as bonds or inflation-linked securities.
Gold often performs well in times of equity market distress, making it a commonly used portfolio diversifier.
7. Conclusion
Gold Futures remain one of the most influential instruments in the global financial markets.
By leveraging machine learning insights and macroeconomic data, traders can better position themselves for profitable trading opportunities. Whether trading daily, weekly, or monthly trends, understanding these indicators allows market participants to align their strategies with broader economic conditions.
Stay tuned for the next "Behind the Curtain" installment, where we explore economic forces shaping another key futures market.
When charting futures, the data provided could be delayed. Traders working with the ticker symbols discussed in this idea may prefer to use CME Group real-time data plan on TradingView: www.tradingview.com - This consideration is particularly important for shorter-term traders, whereas it may be less critical for those focused on longer-term trading strategies.
General Disclaimer:
The trade ideas presented herein are solely for illustrative purposes forming a part of a case study intended to demonstrate key principles in risk management within the context of the specific market scenarios discussed. These ideas are not to be interpreted as investment recommendations or financial advice. They do not endorse or promote any specific trading strategies, financial products, or services. The information provided is based on data believed to be reliable; however, its accuracy or completeness cannot be guaranteed. Trading in financial markets involves risks, including the potential loss of principal. Each individual should conduct their own research and consult with professional financial advisors before making any investment decisions. The author or publisher of this content bears no responsibility for any actions taken based on the information provided or for any resultant financial or other losses.
