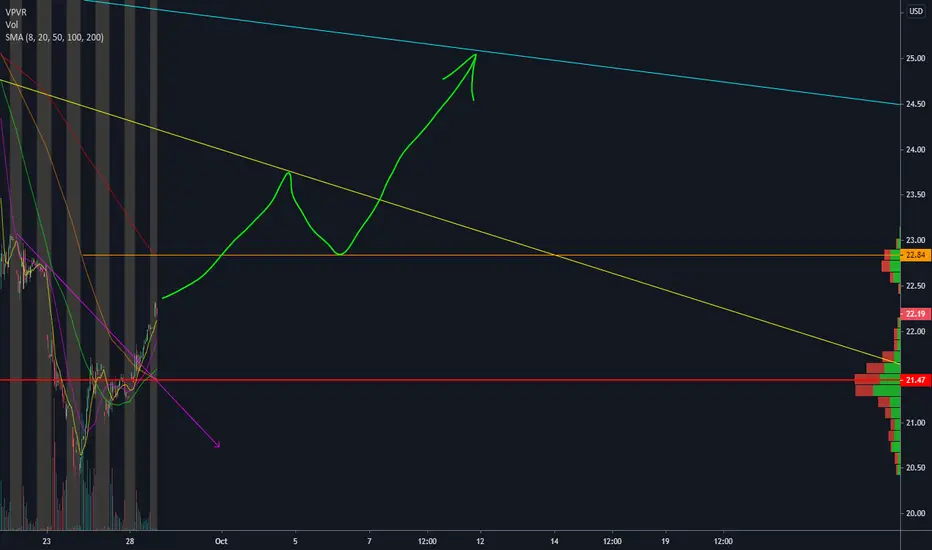
SLV Making a Move HigherGoing long silver with SLV as it looks to re-test $25 soon.
Not trading advice, do your own diligence.
Happy hunting.
Safehaven

FX Update: USD joins JPY in traditional safe haven roleSummary: With risk sentiment slipping into a more profound funk to start the week, the yen continues to bash its was stronger against every other currency, but the USD has changed course and is finally waking up to its role as a fellow safe haven when global risk assets are on the defensive. One key driver besides the COVID-19 resurgence is the sudden further escalation of the US political tensions over the death of Supreme Court Justice Ruth Bader Ginsburg, which could threaten the next round of stimulus.
Trading focus:
JPY strength is not just about USDJPY anymore, as all JPY crosses head south and the USD starts to play second fiddle more loudly as safe haven in non-JPY crosses.
The Friday action was rather confounding relative to historic patterns, as the weakening risk sentiment into the close of US trading for the week continue to drive the JPY stronger across the board – no big surprise there – but failed to register much at all in the smaller currencies’ fortunes against the US dollar. An odd-ball development like the ongoing USDZAR collapse late in the week was only modestly reversed on Friday. Perhaps the thinking was that as long as weak risk sentiment is mostly limited to the bubbly US markets, the volatility was actually USD-indifferent or even USD- negative at the margin. Also in the mix last week was the long term takeaway from the FOMC’s new Average Inflation Targeting regime, which is profoundly USD-bearish for the long term, assuming that inflation comes roaring back in the US and the Fed is slow to respond as long as unemployment is high (with the overriding assumption that US negative real rates would be worse than elsewhere in this AIT regime).
But the here and now of risk-on and risk-off can’t wait for long term implications rolled out by the Fed last week, it appears. And what we are seeing this morning is a deleveraging move that is suddenly far more global in nature, with especially European equity markets off to an ugly lurch lower to start the week. So the JPY continues stronger here, but the USD has moved back to the strong side against everything else – early “days” yet for the move, but we’ll watch the 1.1750 area again in EURUSD and, for example, 1.3250 in USDCAD and the 0.7200 area in AUDUSD for signs that the USD safe haven bid is coming back in, regardless whether USDJPY continues trading lower toward the next major support zone into 100.00. The implications of more USD strength and USDJPY pushing to 100.00 are obvious for key JPY crosses – EURJPY, AUDJPY and as we look at below, GBPJPY.
Chart: GBPJPY
Rolling two developments into one here, as an ugly weakening in global risk sentiment, with Europe finally waking up to the weakness shown in the US last week, has the JPY bashing its way stronger across the board, accelerating the GBPJPY sell-off. The pair now looks in full capitulation mode and could be set for a test of the 130.00 area again if some new Brexit news doesn’t shift sentiment. The UK, and London in particular, is at risk of new partial virus-related shutdowns and the negative rates talk from the BoE last week seems to have created a more negative focus that the first positive signs from Brexit talks were unable to offset.
US political situation somehow just got more tense, possibly blocking path to new stimulus round – This could be another source of the US market’s weakness this week. Trump appeared ready to move on new stimulus measures last week, but the death of liberal Supreme Court Justice Ruth Bader Ginsburg on Friday has supercharged the already hyper-partisan atmosphere as Trump and Senate Republicans are moving to quickly nominate and approve Ginsburg’s replacement before the election (court nominees only require a majority approval in the Senate, which is currently controlled 53-47 by Republicans). This has Democrats hopping mad after a Republican majority Senate frustrated Obama’s attempt to nominate a replacement for conservative justice Scalia who died more than eight months before the 2016 election. The situation bears close watching.
The G-10 rundown, express edition
USD – As noted above, the USD showing sigs of reverting to its role as a safe haven and brushing off last week’s post-FOMC meeting move.
EUR – the FT reports on ECB looking a major overhaul of its APP, which is likely to mean more size and flexibility in purchases (read: against former capital key and other rules – sure to eventually see more German/core resistance)
JPY - playing its role as safe haven currency as in so many markets past. The technical situation has taken on added import with the break below 105.00 in USDJPY.
GBP – the UK in a bad place with COVID-19 concerns and risk sentiment shift likely also weighing together with GBPJPY flow. 1.2750 an interesting pivot level in GBPUDS
CHF – the greenback outshining the franc as a safe haven.
AUD – would expect further relative weakness on risk sentiment deterioration and especially if UDSCNY joins in USD comeback here.
CAD – the 1.3250 level is local trigger for an extension higher in USDCAD, with 1.3300-50 a more structurally pivotal area.
NZD – weakening after an incredible attempt at cycle highs in NZDUSD on Friday – have to believe RBNZ will attempt to make new impact and talk up FX risks. NZDJPY coming alive suddenly here.
SEK – the krona rather resilient in not moving more aggressively lower versus the Euro here – could be bottled up by Riksbank tomorrow.
NOK – EURNOK working above local resistance 10.75+ and that’s without much weakness in oil prices. Price action could slip to at least 11.00.
5 Year Chart...
Disclaimer
The Saxo Bank Group entities each provide execution-only service and access to Analysis permitting a person to view and/or use content available on or via the website. This content is not intended to and does not change or expand on the execution-only service. Such access and use are at all times subject to (i) The Terms of Use; (ii) Full Disclaimer; (iii) The Risk Warning; (iv) the Rules of Engagement and (v) Notices applying to Saxo News & Research and/or its content in addition (where relevant) to the terms governing the use of hyperlinks on the website of a member of the Saxo Bank Group by which access to Saxo News & Research is gained. Such content is therefore provided as no more than information. In particular no advice is intended to be provided or to be relied on as provided nor endorsed by any Saxo Bank Group entity; nor is it to be construed as solicitation or an incentive provided to subscribe for or sell or purchase any financial instrument. All trading or investments you make must be pursuant to your own unprompted and informed self-directed decision. As such no Saxo Bank Group entity will have or be liable for any losses that you may sustain as a result of any investment decision made in reliance on information which is available on Saxo News & Research or as a result of the use of the Saxo News & Research. Orders given and trades effected are deemed intended to be given or effected for the account of the customer with the Saxo Bank Group entity operating in the jurisdiction in which the customer resides and/or with whom the customer opened and maintains his/her trading account. Saxo News & Research does not contain (and should not be construed as containing) financial, investment, tax or trading advice or advice of any sort offered, recommended or endorsed by Saxo Bank Group and should not be construed as a record of our trading prices, or as an offer, incentive or solicitation for the subscription, sale or purchase in any financial instrument. To the extent that any content is construed as investment research, you must note and accept that the content was not intended to and has not been prepared in accordance with legal requirements designed to promote the independence of investment research and as such, would be considered as a marketing communication under relevant laws.

GOLD Trade ideaChange of stance on gold. waiting for a breakout on the downside to sell
Share your thoughts in the comment section below
Like and Follow for more content
Previous chart in related links
Good Luck!!!

Hopefully this is the last dip...Looks like the last dip and we start moving higher, but I can also see us touching 0.0018 USDT as well, what's your thoughts?


GOLD video top-down AnalysisHello everyone, here is the top-down analysis for GOLD, feel free to request any pair/instrument or ask any questions in the comment section below.
Best of luck!

GBPJPY H4 - Short Trade SetupGBPJPY H4 - Break and retest here on GBPJPY. Possible zone trade on our hands from resistance down to 139.860 support. Awkward timing with it being Friday and NFP just around the corner in a couple of hours. YEN is usually quite a big mover off the back of the 1:30pm event. Additionally, H4 candles still very active

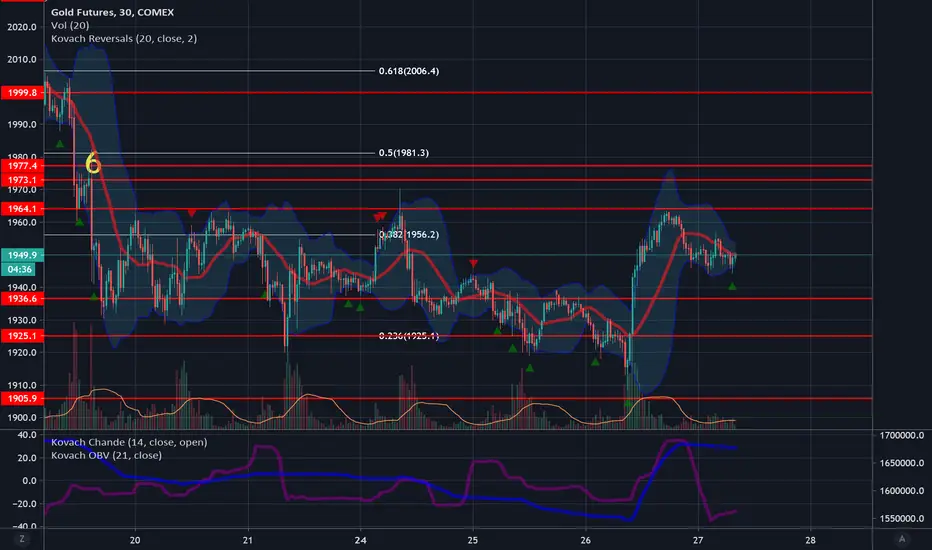
Top Gold Trading StrategiesGold caught a huge bid, finally obeying intermarket correlations with other safe havens. It spiked up to 1965, which is the upper bound of the range we have been discussing for weeks now. Those of you following these reports should have been well prepared. It is currently finding support at the psychological level and congestion zone of 1950. The Kovach OBV has leveled off indicating that momentum has dried up for now. Watch lower levels, for a long trade, since it has been ranging for some time and may test these one more time before breaking out again. We are still bullish of gold but watch out for a good entry. The levels 1936 and 1925 would prove to be good entry points.
CHFJPY - The Safe Haven RaceKey points:
- Trading above 200 EMA
- Accumulation zone coincides with three month trend line
- Key level 115.500 broken in July and holds during August - Future support
- 2018 provided two key highs forming a double top seen in yellow
These levels on occasion provide a magnetic pull into the zone where stops may be present when accompanied by other technical signals like the respected 115.500 level that has now formed support.
The Risk:
Price is hugging the 50 EMA and trading well above the 200 EMA , suggesting we are still in bullish territory. Any violation of the 115.500 level could also cluster with a 200 EMA and trend line violation. In this case the long play should be closed.
Remember as traders it is your job to mitigate the risk and only trade structures that provide high probability, and great reward to risk ratios.
CHFJPY is providing 3.5 reward to risk to the first target with 4x + to break the 2018 highs.
Fundamentals:
With the equity markets brushing off Covid woes and the DXY ( US Dollar Index ) selling off rapidly and possibly finding a short term base, the CHF may strengthen further against it's safe haven rival JPY.
All my views are not advice. Please understand the risks involved when trading such assets and seek professional advice or guidance on how to mitigate your risk.
All the levels provided are zones and not exact figures. Your discretion and interpretation of these levels may differ to other fellow traders/investors.


Short Failed to break yesterday's high so we should expect more downfall.. M formation, final leg down ready..trail with SL until target is reached

USD Roll OverWorked towards this moment for two years. 2018 was timid because of stronger USD bulls. This has caused this year to accumulate strength of other world economies and topped with greater volatility, not because of COVID imho. Although it did add some spice to the soup of spaghetti on this chart and ignited early acceleration of USD devaluation this year, leaving more room for the opposing currencies to regain and overthrow the king. FED must have seen this coming. Good luck USD bulls! Don't forget, the cycling of an economy and its currency is trivial to its core operation..
Stock markets are drawing a whipsaw in the middle of this earlier marked period of time, the mid of August, month of the UJ season .
Oil is ready to hyperinflate products and services worldwide imho. Bitcoin is almost ready to be another safe haven for USD devaluation, see my other idea on its correlation with Gold. Commodities appreciate in general, like all USD quoted assets. Prices will go up people. No reason to stock because there is an unlimited supply of USD, or not? Ask the FED ;)
Correlation between USD strength and stock markets is fading. Funds are already been taken out of the stock market. The Japanese pension fund, one of the largest in the world, will also have started. Wait for the JPY dip as it drops because of strong correlation with USD at the start of the season, then expect JPY appreciation because of international capital flows.
This season should end near December, if nothing unexpected happens such as a COVID wave 2 or Big Short II, because then it may stretch into 2011 and glue that season at the back as well.
Let the market float people otherwise it will bite you in the butt..

AUD/CHF AnalysisDescending Channel has been clearly formed and price is now at the top of the channel.
We have a confluence of other resistances around the 0.6550 - 0.6556 area. Pivot Point Resistance and the 61.8% Fibonacci Resistance level is also in this area. Expecting price to drop to the support area before it bounce back. Its a Bear market. AUD is also in a Bull mood against the USD but Sentiment is also in favour of the CHF as everyone is going back to the safety of safe havens.
As usual, we play it safe by setting a tight stop loss, just in case the market changes direction.


Best Bond Trading Ideas Amid CoronavirusAfter plummeting a full handle, ZN seems like it is poised to retrace a bit. The collapse has created several vacuum zones and it is reasonable that it retraces slightly. It looks like we are seeing an inverse head and shoulders pattern in ZN, which suggest an upside breakout. It is important to let the right shoulder fully form. Then watch the neckline at 139'13. The Kovach OBV is extremely oversold and the Kovach Chande has swung back, so a short trade may be crowded. We have a green triangle on the KRI at the head of the inverse H&S suggesting this may be the bottom.

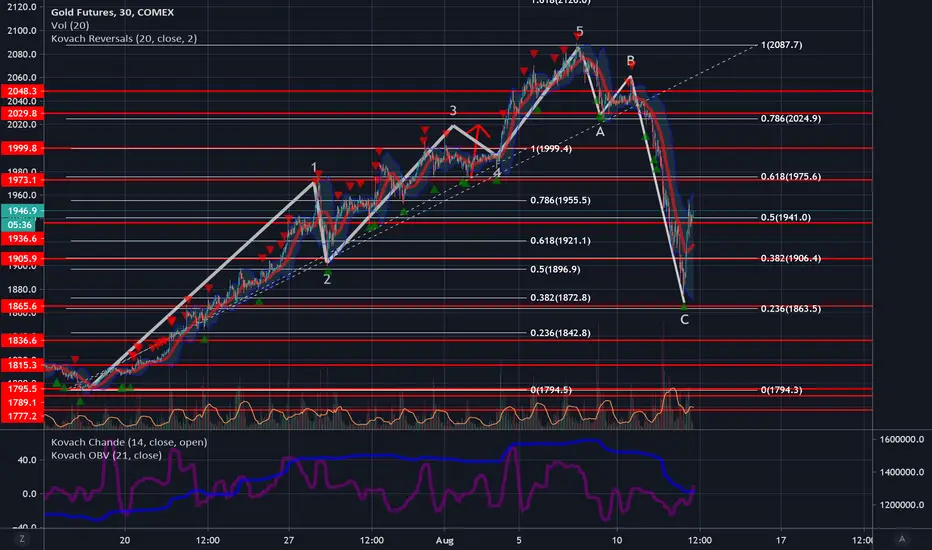
Best Way to Trade the Gold SelloffGold has cratered along with the other safe havens. It has careened through the 1900 handle back down to 1800's, currently finding support at 1863, which is a strong technical and Fibonacci level. It appears to have completed the 5-3 Elliott Wave. Observe that even with this correction, gold can still be considered in a 'bull phase'. Especially considering the bounce it had off 1863. Current levels may make a good entry point for a long trade. We are right at 1941 at the moment, which is another technical and fibonacci level. A narrow stop would be good risk management. The next level above is 1975, but below we have a vacuum zone to 1906. The Kovach OBV has taken a nosedive, registering the selling momentum. It does appear to be turning, along with the Kovach Chande, suggesting that this bear phase may be ending, or at least coming up for air.
Top Gold Trading StrategiesGold has taken its first sustained dip, and this is the first time in over a week we may be able to pick up some at less than $2000. This still seems to be a retracement into the overall bull trend. It appears we finally have seen the corrective wave of the 5-3 Elliott Wave. The Kovach OBV has dipped, but only slightly, indicating the bull trend is still there. Current levels look like good areas to buy. The next level of support is 1973.

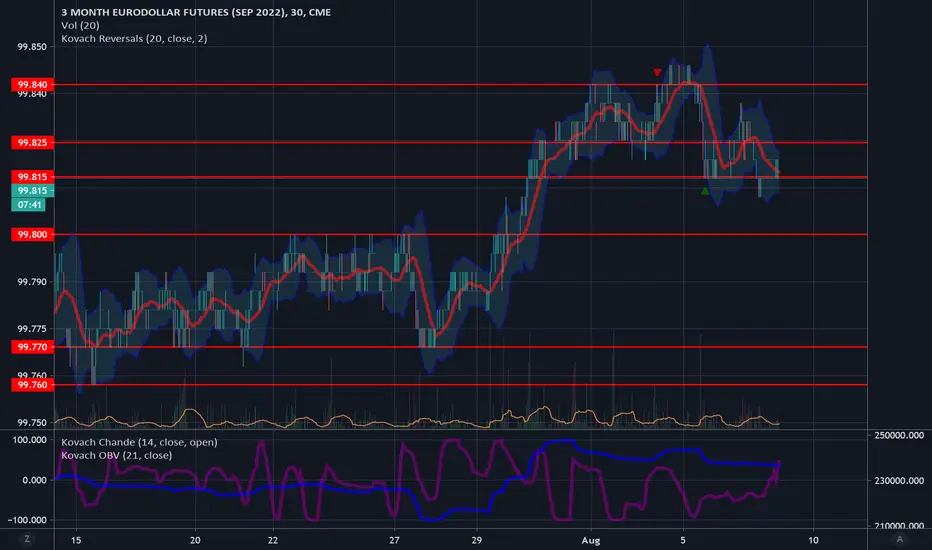
Best Eurodollar Trading StrategiesThe Eurodollar has retreated slightly from highs it achieved earlier this week. Currently, it is knocking about 99.815, the lower bound of this newly established price range. At this point it could bounce and test the upper bound again, or break lower and test 99.800, a level it has very much respected in the past. The Kovach OBV has dropped off, suggesting that the longer the Eurodollar spends at these levels, the more inclined it will be to test lower levels
The Best Way to Trade Gold During CoronavirusWe anticipated some ranging in gold before another breakout. Looks like we were a bit ambitious as to the breakout but we did see a bounce off 1973, as predicted. Gold does seem to be having trouble breaking out to new highs, which is understandable after how much it has rallied. The Kovach OBV has pretty much flatlined, so anticipate more ranging, if not a retracement. The levels 1973, 1955 or even 1936 may make good entry points.

Best Gold Trading IdeasGold continues to rally, having stalled at the psychological and technical level of $2000. The Kovach OBV has flatlined, indicating that it may range for a bit, feeling out new highs. Avoid fomo-ing into a trade here. Although we are still bullish of gold, a retracement is to be expected (and even necessary) for the sustained appreciation of this product. Watch the levels identified. Obviously $2000 will provide significant resistance so keep vigilant

Best Way to Trade Bonds After the FOMCBonds have broken out above relative highs and seem to be stalling about midway to the next level. The next level is 140'18 right before all time highs at 140'25. ZN is currently having some trouble with 140'06, which seems to emerge as a new technical level. Watch for a retracement here before bonds ascend more. The Kovach OBV is very strong, but the Kovach Chande is dipping indicating we may have a buying opportunity soon.
