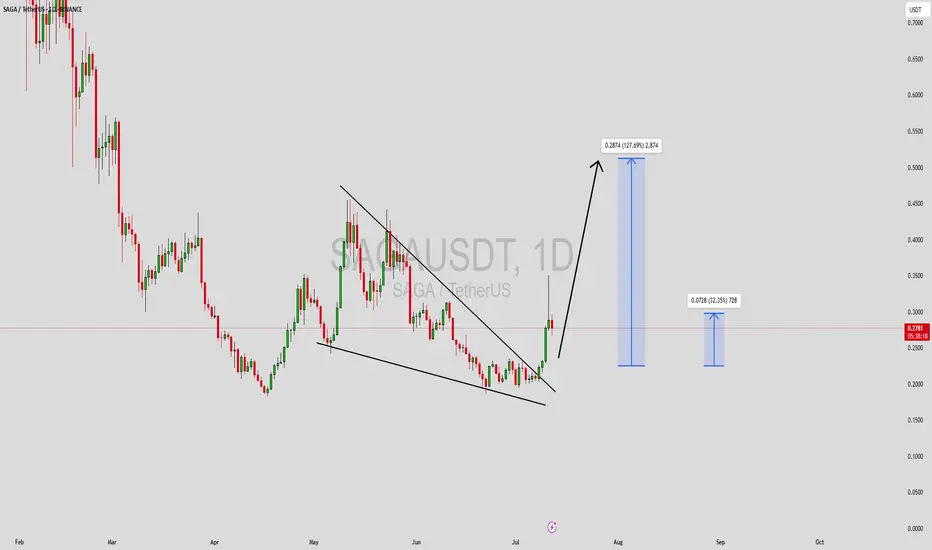
SAGAUSDT Forming Falling WedgeSAGAUSDT is showing promising signs of a trend reversal as it completes a falling wedge pattern, which is a widely respected bullish continuation signal in crypto trading. This chart structure suggests that the recent downtrend could be coming to an end, with the price poised for a strong upward breakout. The current market volume looks healthy, adding weight to the possibility of this setup playing out successfully. With an expected gain of 90% to 100%+, this pair could attract significant attention from swing traders and position traders looking to capitalize on the next big move.
This crypto pair has been drawing increasing interest from investors due to the innovative vision behind the Saga ecosystem and its growing presence in the decentralized applications space. Community sentiment has turned optimistic as fresh liquidity appears to be entering the market, a critical factor for sustainable bullish momentum. As more buyers step in to accumulate around the wedge support, the likelihood of a confirmed breakout strengthens.
Traders should keep a close watch on key breakout levels and look for strong bullish candles closing above the wedge resistance line. An ideal scenario would include a volume spike accompanying the breakout, as this often validates the breakout strength and confirms that new buyers are stepping in aggressively. Proper risk management remains crucial—placing stop-losses below recent swing lows can protect capital while riding this high-probability setup.
✅ Show your support by hitting the like button and
✅ Leaving a comment below! (What is You opinion about this Coin)
Your feedback and engagement keep me inspired to share more insightful market analysis with you!
SAGABTC
SAGAUSDT Breaks Free After Long Consolidation.Big Moves Ahead?SAGAUSDT Breaks Free After Long Consolidation.Big Moves Ahead?
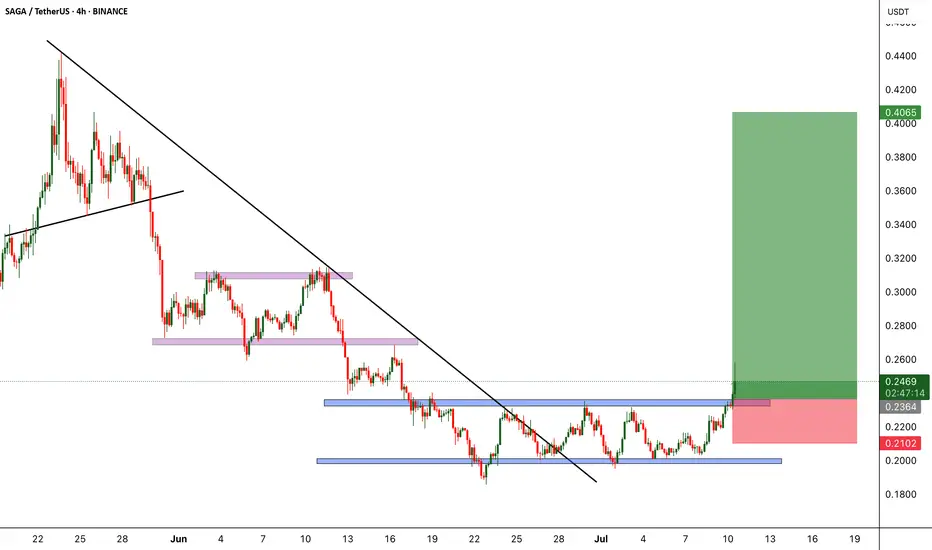
BINANCE:SAGAUSDT was consolidating within a tight range for quite some time, forming a classic accumulation box. Today, it finally broke out of that zone with strong momentum, signaling the potential start of a bullish move. This breakout could be the beginning of a bigger trend, and we’re eyeing further upside in the coming sessions.
As always, risk management is key, make sure to place your stop loss wisely and protect your capital.
#SAGAUSDT Currently trading at 0.245
Buy level : Above $0.235
Stop loss : Below $0.21
Target : $0.4
Max leverage 5x
Always keep stop loss
Follow Our Tradingview Account for More Technical Analysis Updates, | Like, Share and Comment Your thoughts
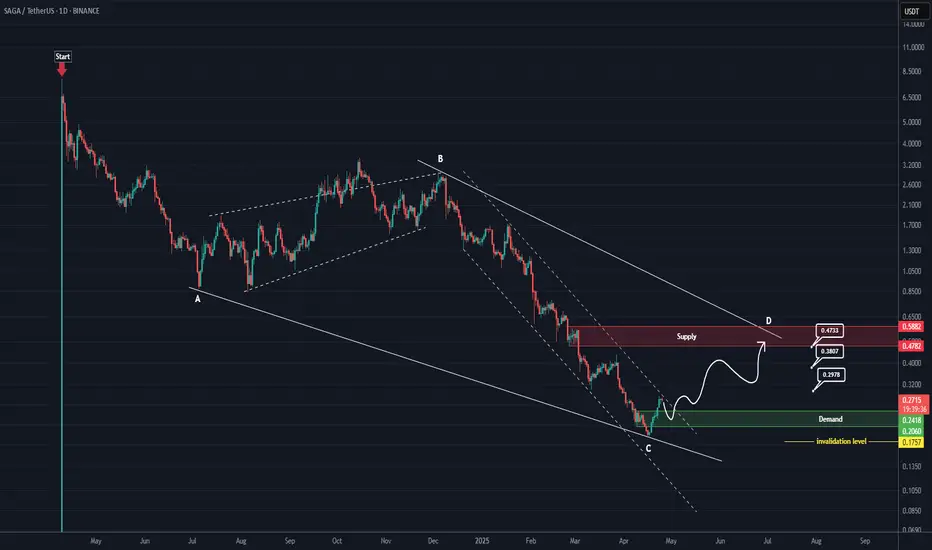
SAGA RoadMap (1D)From the point where we placed the red arrow on the chart, it appears that SAGA's correction has begun.
This correction seems to be either a diametric or a symmetrical pattern. Now, considering the extended duration of wave C, its relative comparison with the other waves, the heavy drop, and the formation of a demand zone at the bottom, wave C seems to have ended.
A rebuy can be considered on the pullback to the green zone.
The targets are marked on the chart.
A daily candle closing below the invalidation level will invalidate this analysis.
For risk management, please don't forget stop loss and capital management
Comment if you have any questions
Thank You
SAGA Rebuy Setup (8H)A strong move has formed, and we have a bullish CH (Change of Character) on the chart.
We can look for buy/long positions around key zones, as buyers are present in these areas.
We are focusing on buy/long positions at the entry points.
Targets are marked on the chart.
A daily candle close below the invalidation level will invalidate this analysis.
For risk management, please don't forget stop loss and capital management
Comment if you have any questions
Thank You

SAGA buy/long setup (4H)The SAGA symbol has made significant breakouts and formed a support zone. Additionally, there is a bullish iCH on the chart.
We can look for buy/long opportunities on this symbol.
Targets are marked on the chart.
A daily candle closing below the invalidation level will invalidate this analysis.
For risk management, please don't forget stop loss and capital management
When we reach the first target, save some profit and then change the stop to entry
Comment if you have any questions
Thank You

SAGAUSDT %500 HUGE VOLUME SPIKE DONT SLEEP ON THIS! SAGAUSDT Blue Box Entry Opportunity
I may join maybe around 1.315 too.
All the requirements for the blue box have been meticulously verified.
Highlights:
Volume Spike: A significant daily volume increase, confirming smart money involvement.
CDV & Heatmap Support: Positive cumulative delta volume with visible buyer activity on the liquidity heatmap.
Volume Profile: Perfect alignment with our blue box, indicating a high-probability zone.
Key Observations:
"The blue box is very carefully picked using volume footprint, volume profile, cumulative delta volume, and liquidity heatmap. When trading this zone, I will look for buyers and upward market structure breaks in lower time frames for confirmation."
Stay tuned for updates! 🚀
Let me tell you, this is something special. These insights, these setups—they’re not just good; they’re game-changers. I've spent years refining my approach, and the results speak for themselves. People are always asking, "How do you spot these opportunities?" It’s simple: experience, clarity, and a focus on high-probability moves.
Want to know how I use heatmaps, cumulative volume delta, and volume footprint techniques to find demand zones with precision? I’m happy to share—just send me a message. No cost, no catch. I believe in helping people make smarter decisions.
Here are some of my recent analyses. Each one highlights key opportunities:
🚀 RENDERUSDT: Strategic Support Zones at the Blue Boxes +%45 Reaction
🎯 PUNDIXUSDT: Huge Opportunity | 250% Volume Spike - %60 Reaction Sniper Entry
🌐 CryptoMarkets TOTAL2: Support Zone
🚀 GMTUSDT: %35 FAST REJECTION FROM THE RED BOX
🎯 ZENUSDT.P: Patience & Profitability | %230 Reaction from the Sniper Entry
🎯 DEXEUSDT %180 Reaction with %9 Stop
🐶 DOGEUSDT.P: Next Move
🎨 RENDERUSDT.P: Opportunity of the Month
💎 ETHUSDT.P: Where to Retrace
🟢 BNBUSDT.P: Potential Surge
📊 BTC Dominance: Reaction Zone
🌊 WAVESUSDT.P: Demand Zone Potential
🟣 UNIUSDT.P: Long-Term Trade
🔵 XRPUSDT.P: Entry Zones
🔗 LINKUSDT.P: Follow The River
📈 BTCUSDT.P: Two Key Demand Zones
🟩 POLUSDT: Bullish Momentum
🌟 PENDLEUSDT.P: Where Opportunity Meets Precision
🔥 BTCUSDT.P: Liquidation of Highly Leveraged Longs
🌊 SOLUSDT.P: SOL's Dip - Your Opportunity
🐸 1000PEPEUSDT.P: Prime Bounce Zone Unlocked
🚀 ETHUSDT.P: Set to Explode - Don't Miss This Game Changer
🤖 IQUSDT: Smart Plan
⚡️ PONDUSDT: A Trade Not Taken Is Better Than a Losing One
💼 STMXUSDT: 2 Buying Areas
🐢 TURBOUSDT: Buy Zones and Buyer Presence
🌍 ICPUSDT.P: Massive Upside Potential | Check the Trade Update For Seeing Results
🟠 IDEXUSDT: Spot Buy Area | %26 Profit if You Trade with MSB
📌 USUALUSDT: Buyers Are Active + %70 Profit in Total
🌟 FORTHUSDT: Sniper Entry +%26 Reaction
🐳 QKCUSDT: Sniper Entry +%57 Reaction
📊 BTC.D: Retest of Key Area Highly Likely
This list? It’s just a small piece of what I’ve been working on. There’s so much more. Go check my profile, see the results for yourself. My goal is simple: provide value and help you win. If you’ve got questions, I’ve got answers. Let’s get to work!

SAGA - Daily Bullish SignsBINANCE:SAGAUSDT coin is showing signs of a strong reversal on the daily chart, with bullish legs becoming stronger than the previous bearish ones. This suggests increasing buying pressure, and after a potential pullback, we could see more upward movement.
On the fundamental side, KRAKEN:SAGAUSD has been gaining traction since its mainnet launch in April 2024. It’s a unique Layer 1 protocol that allows developers to create dedicated chains, offering infinite scalability, interoperability, and cost-effective solutions. The project has already attracted around 350 projects, mostly in gaming, and has formed partnerships with key players like Polygon and Avalanche, which could drive its adoption further

SAGA UPDATE (12H)This analysis is an update of the analysis you see in the "Related publications" section
The price seems to have ended up with a symmetrical one instead of a diametric one.
We are now in wave C of a bullish pattern.
The price has two TP ahead which we marked on the chart.
If the price reaches TP 2, it can be strongly rejected downwards
For risk management, please don't forget stop loss and capital management
Comment if you have any questions
Thank You

SAGA ANALYSIS (4H)It seems that after the end of the first bearish diametric, we have entered another bullish diametric.
It seems we are now in wave E of the bullish diametric.
From the supply range, the price can be rejected downwards to complete the F wave.
Closing a daily candle above the invalidation level will violate the analysis
For risk management, please don't forget stop loss and capital management
Comment if you have any questions
Thank You

DON'T BUY SAGA COIN UNTIL $1.5 ZONEDON'T BUY SAGA COIN UNTIL $1.5 ZONE
My buy view:
EBTRY ZONE: $1.5
STOP LOSS ZONE: $1.41
TAKE PROFIT ZONE: $1.78
Re,ember, Crypto is highly volatile asset, trade with caution

SAGA - Strong Recovery with the bullish opportunity#SAGA/USDT #Analysis
Description
---------------------------------------------------------------
+ Price has hit the horizontal support zone twice and bounce back immediately, which implies that the support is holding strong and it's highly unlikely that price will go below the support zone.
+ Currently price is at the resistance zone and a strong breakout from this resistance zone will push the price higher yielding a decent profit for long trade.
---------------------------------------------------------------
VectorAlgo Trade Details
------------------------------
Entry Price: 1.7419
Stop Loss: 1.1308
------------------------------
Target 1: 2.0901
Target 2: 2.5828
Target 3: 3.1821
Target 4: 4.6493
Target 5: 6.4239
------------------------------
Timeframe: 1D
Capital Risk: 1-2% of trading amount
Leverage: 5-10x
---------------------------------------------------------------
Enhance, Trade, Grow
---------------------------------------------------------------
Feel free to share your thoughts and insights.
Don't forget to like and follow us for more trading ideas and discussions.
Best Regards,
VectorAlgo

SAGAUSDT Bullish Head and Shoulders PatternSAGAUSDT Technical analysis update
SAGA has formed an inverse head and shoulders pattern on the 4H chart, with the price moving towards the neckline for a breakout. On the daily chart, the price has formed a descending channel. Both breakouts could occur simultaneously. If the price breaks out, we can expect a strong bullish move.
Buy zone : Below $1.55
Stop loss : $1.21
Always Keep Stop Loss

SAGA - 4H Perfect Buy OpportunitySAGA had three bearish legs, each resulting in a 60% price fall, demonstrating a strong downward trend. Within these bearish moves, there were two bullish pullbacks, each with a 60% rise, indicating temporary reversals before the continuation of the downtrend. Currently, SAGA is at the bottom of the latest bearish leg.
Given the pattern, I expect a rise as a pullback to the first resistance zone, which is a typical market behavior after such significant drops. If SAGA manages to break through this resistance zone, it could potentially rise further to the order block of the last bearish leg. This scenario would align with previous patterns of price action, suggesting a short-term bullish move within the overall bearish trend.

Is SAGA bullish?As you know, SAGA does not have data to review and cannot be analyzed.
This project is a strong project backed by 13 billion dollar stake.
But this project was chosen as the 51st project of Binance Launch Pool
With our previous reviews of the Binance Launch Pool projects, we found out that usually the symbols listed in this way in Binance underwent a time correction between 70 and 90 days and then moved upwards.
We expect to see a trend change for SAGA on the date between the two vertical lines on the chart.
Note: For buying and risking, the price bottom is not clear, and only on the chart, we indicated the time of trend change schematically.
When we reach the time to change the trend, we can enter the buy position by getting the confirmation and the trigger

Beware, SAGA is near a resistance rangeAfter a good climb, it has reached a resistance FL range.
Even if SAGA wants to break out of this area, it must have a correction ahead. Note that this correction may not be deep, so when we reach the first target, save some profit and then place a stop on the entry.
This area can contain many sell orders.
It has also swept up a large liquidity pool.
Closing a daily candle above the invalidation level will violate the analysis.
For risk management, please don't forget stop loss and capital management
When we reach the first target, save some profit and then change the stop to entry
Comment if you have any questions
Thank You
