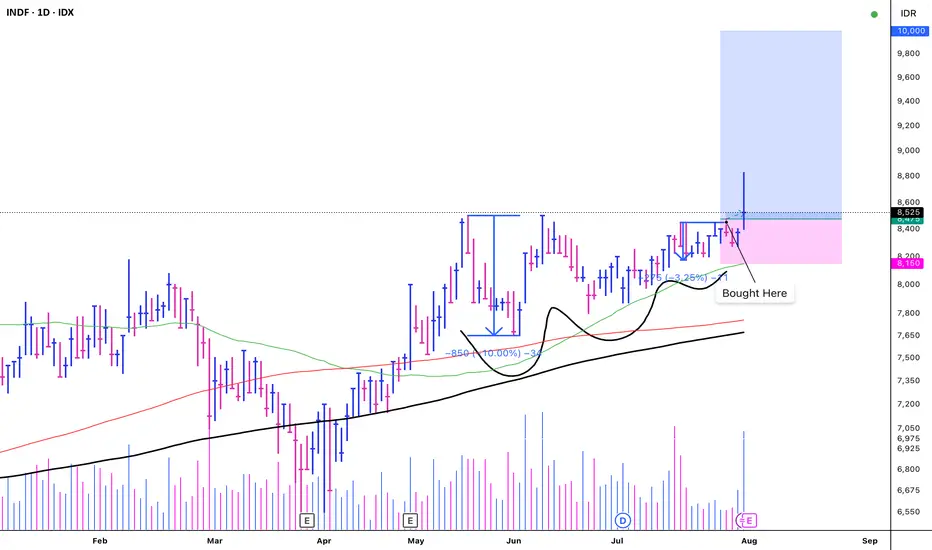
INDF - VCP (13W 10/3 3T)IDX:INDF - VCP
+)
1. Low risk entry point on a pivot level.
2. Volume dries up.
3. Price has been above the MA 50 > 150 > 200
4. Price is within 25% of its 52-week high.
5. Price is over 25% of its 52-week low.
6. The 200-day MA has been trending upwards for over a month.
7. The RS Rating is above 70 (71).
EPS Growth:
a. Quarterly QoQ: -
b. Quarterly YoY: +11.20%.
c. TTM YoY: +32.14%.
d. Annual YoY: +6.07%.
(-)
1. There is no significant breakout with substantial volume.
Saham
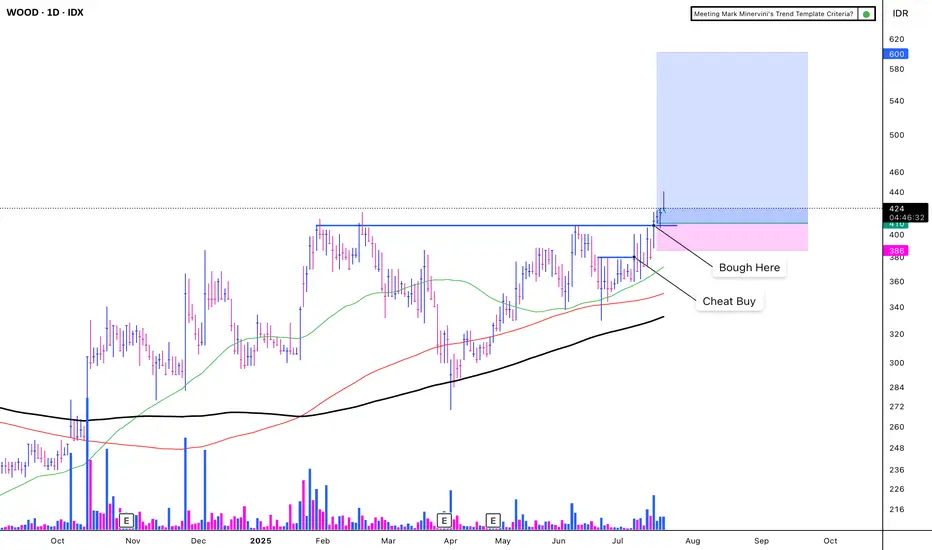
WOOD - CUP WITH HANDLEIDX:WOOD - CUP WITH HANDLE
(+):
1. Low risk entry point
2. Volume dries up.
3. Price has been above the MA 50 for over 10 weeks, with values exceeding 150, 200, and 300.
4. Price is within 25% of its 52-week high.
5. Price is over 30% of its 52-week low.
6. The 200-day MA has been trending upwards for over a month.
7. The RS Rating is above 70 (85).
8. Carbon sales increase 503%
9. Price breakout with VCP criteria
EPS Growth:
a. Quarterly QoQ: -13.24%.
b. Quarterly YoY: +68.81%.
c. TTM YoY: +49.09%.
d. Annual YoY: +33.27%.
(-)
Trump Implements a 32% Increase in Tariffs on Indonesia
The market is volatile due to the ongoing war
TAPG - VCP (11W 18/4 3T)IDX:TAPG - VCP
(+):
1. Low risk entry point on a pivot level.
2. Volume dries up.
3. Price has been above the MA 50 for over 10 weeks, with values exceeding 150, 200, and 300.
4. Price is within 25% of its 52-week high.
5. Price is over 30% of its 52-week low.
6. The 200-day MA has been trending upwards for over a month.
7. The RS Rating is above 70 (86).
8. There has been a significant breakout with substantial volume
**EPS Growth:**
a. Quarterly QoQ: -46.42%.
b. Quarterly YoY: +117.27%.
c. TTM YoY: +111.05%.
d. Annual YoY: +94.02%.
(-)
1. Trump Implements a 32% Increase in Tariffs on Indonesia
2. The market is volatile due to the ongoing war

DKFT - POWER PLAYIDX:DKFT - POWER PLAY
(+)
1. Low risk entry point on a pivot level.
2. Volume dries up.
3. Price has been above the MA 50 for over 10 weeks, with values exceeding 150, 200, and 300.
4. Price is within 25% of its 52-week high.
5. Price is over 30% of its 52-week low.
6. The 200-day MA has been trending upwards for over a month.
7. The RS Rating is above 70 (98).
8. There has been a significant breakout with substantial volume with VCP There has been a significant breakout with substantial volume, with VCP characteristic.
9. The price shoot up by 102% and paused only for 18%, indicating a strong uptrend
**EPS Growth:**
a. Quarterly QoQ: +79.70%.
b. Quarterly YoY: +819.89%.
c. TTM YoY: +356.12%.
d. Annual YoY: +484.31%.
(-)
1. Trump Implements a 32% Increase in Tariffs on Indonesia
2. The market is volatile due to the ongoing war

BNLI - VCP (11W 21/4 3T)IDX:BNLI - VCP
(+)
1. Low risk entry point on a pivot level.
2. Volume dries up.
3. Price has been above the MA 50 for over 10 weeks, with values exceeding 150, 200, and 300.
4. Price is within 25% of its 52-week high.
5. Price is over 30% of its 52-week low.
6. The 200-day MA has been trending upwards for over a month.
7. The RS Rating is above 70 (98).
8. There has been a significant breakout with substantial volume.
9. The price surged up by 150% and paused only for 24%, indicating a strong uptrend.
10. The stock is the leader of its sector.
**EPS Growth:**
a. Quarterly QoQ: +0.96%.
b. Quarterly YoY: -2.27%.
c. TTM YoY: +34.60%.
d. Annual YoY: +38.06%.
(-)
1. The major market is focused on Danantara and Hilirisasi stocks.

TRUK - VCP (118W 66/27 3T)IDX:TRUK - VCP
(+):
1. Low risk entry point on pivot level
2. Volume dries up
3. Price above MA 50 > 150 > 200 over 10 weeks
4. Price is within 25% of 52 weeks high
6. Price is over 30% of 52 weeks low
7. 200 day MA trending up over 1 month
8. RS Rating is over 70 (84)
9. Breakout with huge volume
(-)
1. There is nothing good with the fundamental

JARR VCP - (144W 80/28 4T)IDX:JARR - VCP
(+):
1. Low risk entry point on pivot level
2. Volume dries up
3. Price above MA 50 > 150 > 200 over 10 weeks
4. Price is within 25% of 52 weeks high
6. Price is over 30% of 52 weeks low
7. 200 day MA trending up over 1 month
8. RS Rating is over 70 (85)
9. EPS Growth:
a. Quarterly QoQ: +56.12%
b Quarrerly YoY: +255.56%
b. TTM YoY: +208.21%
c. Annual YoY: +237.44%
10. Breakout with huge volume
(-)
1. Nothing, just perfect :)

PSAB - CUP WITH HANDLEIDX:PSAB - CUP WITH HANDLE
(+):
1. Low risk entry point on pivot level
2. Volume dries up
3. Price above MA 50 > 150 > 200 over 10 weeks
4. Price is within 25% of 52 weeks high
6. Price is over 30% of 52 weeks low
7. 200 day MA trending up over 1 month
8. RS Rating is over 70 (92)
9. EPS Growth:
a. Quarterly QoQ: +47.80%
b. Quarterly YoY: +436.36%
b. TTM YoY: +436.36%
c. Annual YoY: +197.07%
10. Breakout with huge volume
11. Gold price is all time high, but this stock is still lagging
(-)
1. Need to break another high, to let this stock all time high

SAME - VCP (10W 25/5 3T)IDX:SAME - VCP
(+):
1. Low risk entry point on pivot level
2. Volume dries up
3. Price above MA 50 > 150 > 200 over 10 weeks
4. Price is within 25% of 52 weeks high
6. Price is over 30% of 52 weeks low
7. 200 day MA trending up over 1 month
8. RS Rating is over 70 (80)
9. 9. EPS Growth:
a. Quarterly QoQ: +852.30%
b. Quarterly YoY: +570.99%
b. TTM YoY: -3.34%
c. Annual YoY: -3.36%
(-)
1. Breakout with huge volume but long wick
Note: I will sell half if hit first Stop Loss, and sell remaining on the last stop loss on first cheat buy

MFIN - VCP (16W 41/18)IDX:MFIN - VCP
(+):
1. Low risk entry point on pivot level
2. Volume dries up
3. Price above MA 50 > 150 > 200 over 10 weeks
4. Price is within 25% of 52 weeks high
6. Price is over 30% of 52 weeks low
7. 200 day MA trending up over 1 month
8. RS Rating is over 70 (95)
9. EPS Growth:
a. Quarterly QoQ: +22.24%
b Quarrerly YoY: +185.92%
b. TTM YoY: +22.24%
c. Annual YoY: +23.08%
(-)
1. Breakout with red candle
2. Lack of liquidity

TAPG - VCP (20/5 3T)IDX:TAPG VCP
(+):
1. Low risk entry point on pivot level
2. Volume dries up
3. Price above MA 50 > 150 > 200 over 10 weeks
4. Price is within 25% of 52 weeks high
6. Price is over 30% of 52 weeks low
7. 200 day MA trending up over 1 month
8. RS Rating is over 70 (84)
9. Biggest net income +197.70% on Q4 2024 vs Q4 2023
(-)
1. Breakout with huge volume but created long red candle

NICL - VCP (192W 82/24)IDX:NICL VCP
(+):
1. Low risk entry point on pivot level
2. Volume dries up
3. Price above MA 50 > 150 > 200 over 10 weeks
4. Price is within 25% of 52 weeks high
6. Price is over 30% of 52 weeks low
7. 200 day MA trending up over 1 month
8. RS Rating is over 70 (93)
9. EPS Growth:
a. Quarterly QoQ: +45.05%
b. TTM YoY: +872.03%
c. Annual YoY: +1,029.03%
(-)
1. Breakout with low volume

FKLI Week 15 2025: To regain 1500 level.A rally today has provided a rebound for FKLI to regain the 1500 level. From the chart the lower low are not able to create a new lower low and price rebound today created a based where a move higher towards 1500 is likely. If price close above and stay above 1500 then a move towards 1600 is possible. Let's see.

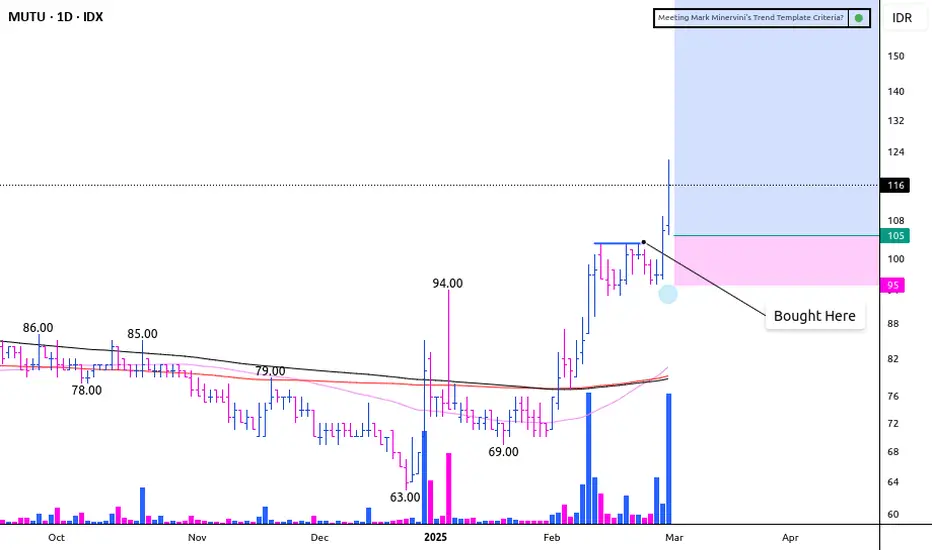
MUTU - 3 WEEKS TIGHTIDX:MUTU - 3 Weeks Tight
(+):
1. Low risk entry point when stock pause
2. Volume significantly drop on week 2, and huge volume on week 1
3. Price above MA 50 > 150 > 200 over 10 weeks
4. Price is within 25% of 52 weeks high
6. Price is over 30% of 52 weeks low
7. 200 day MA trending up over 1 month
8. RS Rating is over 70 (90)
9. High volume on breakout
(-)
1. In the text book, 2nd candle on 3 weeks tight is must corrected by 3% but this stock it was corrected by 9%
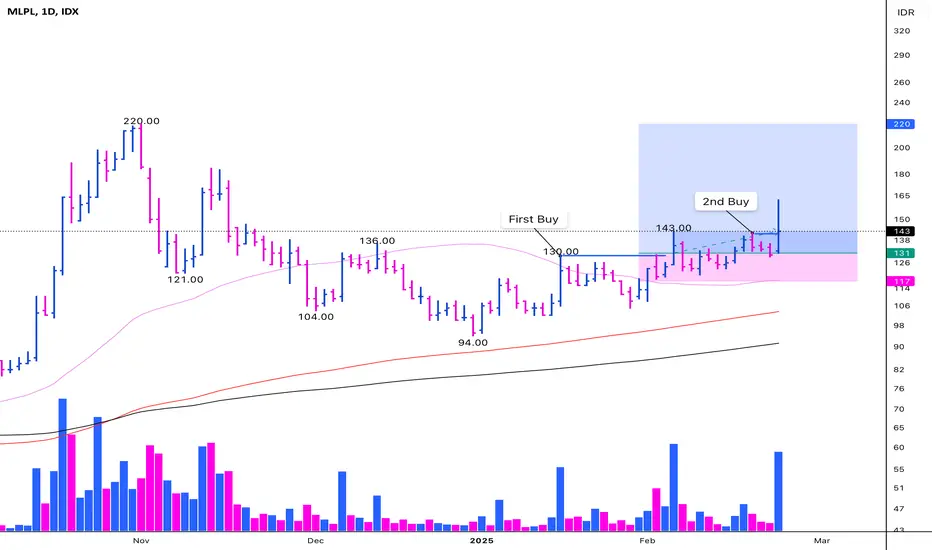
MLPL - LOW CHEATIDX:MLPL - Low Cheat
(+):
1. Very Low risk entry point on pivot level
2. Volume dries up
3. Price above MA 50 > 150 > 200 over 10 weeks
4. Price is over 30% of 52 weeks low
5. 200 day MA trending up over 1 month
6. RS Rating is over 70 (93)
7. VCP characteristic
10. Price breakout with huge volume
(-)
1. Price is below 25% of 52 weeks high
Try to Adding with some basic fundamental about EPS growth:
a. Quarterly QoQ: −91.66%
b. Quarterly YoY: −71.13%
c. TTM YoY: +12.23%
d. Annual YoY: −13.30%
About fundamental aspect, maybe is time to turn around
WIRG - VCP (18W 45/6/3T)IDX:WIRG
(+):
1. Very Low risk entry point on pivot level
2. Volume dries up
3. Price above MA 50 > 150 > 200 over 10 weeks
4. Price is within 25% of 52 weeks high
6. Price is over 30% of 52 weeks low
7. 200 day MA trending up over 1 month
8. RS Rating is over 70 (84)
9. Additional aspect about AI sentiment
10. Price breakout with huge volume
(-)
1. I am not sure about Volume from 15 January until today, i think it is a sign of taking profit action of big institute. Let see what's going on with this stock after i bought it
2. There is gap below on 17 january 2025, i am not a big fan of gap
Try to Adding with some basic fundamental about EPS growth:
a. Quarterly QoQ: −32.06%
b. Quarterly YoY: −14.26%
c. Annual YoY: +77.44%
d. TTM YoY: +46.99%
About fundamental aspect, maybe the stock is time to turn around

ELIT - LOW CHEATELIT - LOW CHEAT
(+):
1. Low risk entry point
2. Volume dries up
3. Price above MA 50 > 150 > 200 over 10 weeks
4. Price is within 25% of 52 weeks high
6. Price is over 30% of 52 weeks low
7. 200 day MA trending up over 1 month
8. RS Rating is over 70 (82)
9. Stock build VCP Characteristic
Try to Adding with some basic fundamental about EPS growth:
a. Quarterly QoQ: +31.29%
b. Quarterly YoY: 653.96%
c. Annual YoY: +75.48%
d. TTM YoY: +220.19%
(-):
1. Stock not confirm on stage 2 uptrend if not break the blue line
Note:
- Consider to add some position if break the blue line
- Market look bottoming, just wait this stock to breakout with high volume

ALDO - CUP WITH HANDLEIDX:ALDO (CUP WITH HANDLE)
28-10-2024
(+):
1. Low risk entry point, first time the stock showing it’s buying point
2. Volume dries up on handle
3. Stock showing it’s strength while market is corrected
4. Price above MA 50 > 150 > 200 over 10 weeks
5. Price is within 25% of 52 weeks high
6. Price is over 30% of 52 weeks low
7. 200 day MA trending up over 1 month
8. RS Rating is over 70 (82)
(-):
1. Not really confirmed Stage 2, there is high that need to break out at price 520

TLKM BULLISH PREDICTIONTLKM have reached the support area and in a consolidation area. i think the price will rebound in the future. the price have also reached the lowest price in the past 10 years

PBID - CUP-COMPLETION CHEATIDX:PBID (3C)
14-10-2024
(+):
1. Low risk entry point
2. Volume dries up
3. Price above MA 50 > 150 > 200 over 10 weeks
4. Price is within 25% of 52 weeks high
5. Price is over 30% of 52 weeks low
6. 200 day MA trending up over 1 month
7. RS Rating is over 70 (86)
(-):
1. Not really in Stage 2-a uptrend
2. No big volume on the breakout

UNTR - CUP WITH HANDLEIDX:UNTR CUP WITH HANDLE
13-12-2024
(+):
1. Low risk entry point on nice drifting handle
2. Price above MA 50 > 150 > 200 over 10 weeks
3. Price is within 25% of 52 weeks high
4. Price is over 30% of 52 weeks low
5. 200 day MA trending up over 1 month
6. RS Rating is over 70 (79)
7. Price break major downtrend, it's mean the stock started on Stage 2 uptrend
(-):
1. The stock is slow mover, it will take a while to reach the target
2. The volume when the stock is breaking out not quite big
Note:
Volume not dries up cause of big capital stock, some of big capital stocks doesn't need to dries up their volume

$NEST - POWER PLAYIDX:NEST - PRIMARY BASE
06-12-2024
(+):
1. Low risk entry point
2. Price surge up almost 100% since it’s IPO indicated that the stock is strong
3. Volume dries up with VCP characteristic during this tight pause
4. One of IPO leader after IDX:DAAZ
5. RS Rating is over 70 (80)
(-):
1. Not the best Power Play setup, on the textboox: There is an explosive price move up over 100% on huge volume within 8 weeks and not corrective more than 20%

PSGO - Primary BaseIDX:PSGO - PRIMARY BASE
25-11-2024
(+):
1. Low risk entry point
2. Volume dries up
3. Price above MA 50 > 200 over 10 weeks
4. Price is within 25% of 52 weeks high
5. Price is over 30% of 52 weeks low
6. 200 day MA trending up over 1 month
7. RS Rating is over 70 (78)
(-):
1. MA 150 < 200
2. The volume on breakout is too small
