2D Buy on $SAND.The atmosphere for a bull cycle within this bear market appears to be developing.
UCTS is indicating a 2D Buy on $SAND.
In search of a break or flip above the range high ($1.5) as a continuation
SAND
Price Determinant Range!Hello to all members of TradingView and my followers.
SAND continued to rise to $ 1.30 after a break of $ 0.80 last week with the support of buyers. The Sandbox continued to decline due to the dynamic resistance and the static resistance level of $ 1.20 to $ 1.30. Again, with the downturn in the market, there is selling pressure to move the price towards $ 0.80 support. If the monthly support is maintained, there is a strong growth potential up to the main downtrend range, ie, the price of $ 1.50 and the next target of $ 2. For the current week, as long as the price is below the $ 1.11 level, the price will move towards the support of $ 0.90 and $ 0.77.
If it is helpful to you, please like it. If you have a comment, I'll be happy to know. Respectfully.

Continue the good growth of last week?Hello to all members of TradingView and my followers.
SAND had good growth last week. It was one of the most active coins on Thursday, with values increasing by as much as 14%.
After reaching a low of $1.13 on Wednesday, its pair reached a session high of $1.28 earlier today.
The buying pressure has brought the price to the resistance range of $1.18 to $1.26, and if the buyers can stabilize the price of this currency above the resistance range, considering that the reverse head and shoulder pattern is also formed on the chart, in this case, the pressure Buying can lead the price to the resistance area of the ceiling of the descending channel.
The resistances of SANDBOX are in the ranges of 1.38, 1.55, and 1.85 dollars. A downtrend line is also drawn inside the channel; if it is not broken, the price can even break out of the downtrend channel.
In general, I expect the price to react negatively after hitting the $1.70 range resistance, and there is a possibility of a correction towards the supports.
If it is helpful to you, please like it. If you have a comment, I'll be happy to know. Respectfully.

SANDBOXSAND/USDT look at the chart we have 2 Support Zone and one Resistance zone should you think it will be followed that we expect in the chart!
Disclamer:
We are not financial advisors. The content that we share on this website are for educational purposes and are our own personal opinions.

Sand - Another one bites the dust!💨Reasons to take short if BTC allows:
⭐️ Trendline is 3 days long
⭐️ Trendline is clean
⭐️ Price is squeezing to the trendline
⭐️ Volume appeared at top
⭐️ Buyer is getting weaker
⭐️ 5th touch
⭐️ Under VWAP
Will enter when price squeezes to the trendline on 5m timeframe, the base will form and the tape will get faster.
If you don't understand the previous sentence, just use swing stop-loss 3-5%
Fix profit by parts:
1% - 1/3
2% - 1/3, stoploss to breakeven
What's left, hold to the maximum
What do you think of this idea? What is your opinion? Share it in the comments📄🖌
If you like the idea, please give it a like. This is the best "Thank you!" for the author 😊
P.S. Always do your own analysis before a trade. Put a stop loss. Fix profit in parts. Withdraw profits in fiat and reward yourself and your loved ones

Sand drop signal Sand creates a huge divergence and returns from its downward trendline.
I published Sand/Btc too and this pattern exists there too.

Sand/BTC Double top pattern (another confirmation of drop)Sandbtc creates a double top pattern too. Besides it had divergence and a very strong resistance level (I mentioned before)

Sandbtc can drop at least 7% from hereSand/BTC has reached its very strong resistance level and made a huge divergence. It can drop to its first TP1 and even more to TP2

SAND - Buying SignalBYBIT:SANDUSDT
4 Hours time frame
-
SAND is showing a potential double bottom here
We can long it here with strategy as below.
-
Targets:
1) 1.3491
2) 1.5173~1.585
3) 1.6582
Stop:
1) 1.1507

SandThat's clear! I waiting target to red line. That's clear! I waiting target to red line. That's clear! I waiting target to red line.

The Sandbox Bottomed Out (280% Target Mapped)Hello my fellow crypto-trader, let's start by looking at the Sandbox today shall we?
Here we can notice the Adam & Eve bottom formation which can easily lead to higher prices.
This is the exact same chart that most of the altcoins have and thus we are certain that this pattern will be followed with growth.
Other altcoins with the same pattern already broke bullish and many have growng by 50%, 80%, 100%, 200% & more.
You can find the target mapped on the chart.
Namaste.

SANDUSDT🚀 Short term tradeSubscribe to the channel that would receive new information about the cryptocurrency market✅
Hello everyone👋
SAND on the four-hour TF shows a mini descending channel, I expect a breakdown of the upper border of the channel in the short term.
Sample deal plan:
💡Entry $1.2026 (from the middle line of the channel)
🔝Take profit 1.4$ (can be fixed earlier)
✖️Stop-loss $1.1510 (short stop, 5X leverage)
All successful trading, do not forget about your risk management and move the stop in used.

#SAND, 2D UCTS buy is flashing#SAND
First time in the year that a 2D UCTS buy is flashing
Looking for a potential breakout above 5k sats while awaiting the candle to close today.

SANDBOX ⌛🦜 Off to 1,7$ (or higher) 🏴☠️☠The Sandbox (SAND) metaverse token gains 40% after Snoop Dogg, Warner Music partnership.
SAND’s 40% rally follows a two-month-long correction that wiped out nearly 70% of the token’s market valuation. Instead, the altcoin logged a breakaway recovery as traders assessed its recent high-profile partnerships as a sign that the project has strong fundamentals.
Traders decided to increase their exposure to SAND after the Sandbox announced partnerships with American rapper Snoop Dogg and Warner Music, a major record label.
On Jan. 27, Snoop Dogg tweeted a teaser of what appeared to be his upcoming nonfungible token (NFT) collection, dubbed "the Snoop Avatars." The rapper further hinted that his avatars would come as a part of the Sandbox metaverse.
Later, that day, the Sandbox announced that it would create a music theme park and concert venue within its metaverse with the help of Warner Music. In doing so, the gaming project noted that the Warner Music artists would virtually engage with their fans and generate real revenues streams.
“We’re shaping The Sandbox as a fun entertainment destination where creators, fans and players can enjoy first-of-a-kind immersive experiences and be more closely connected to their favorite musical artists through NFTs," Sebastien Borget, chief operations officer and co-founder of The Sandbox, told Cointelegraph.
Naturally, the high-profile partnerships boosted the prospects for SAND to find more takers in the future. That is primarily because of the token's role as a primary asset inside the Sandbox metaverse — a medium of exchange, governance and staking. As a result, it fared better than most of its top-ranking crypto rivals on Jan. 27.
What's next for SAND?
The latest bout of buying appeared in line with a choppy recovery in the broader cryptocurrency sector that started on Jan. 24.
Between its nadir of Jan. 22 and Jan. 28's top, the crypto market added over $150 billion to its net valuation. SAND, which recovered alongside other assets, bottomed out at $2.56 then went on to rally over 40% in just four days.
Snoop Dog style,
the FXPROFESSOR

SAND can give you a lot of Profit Right now!SAND is in a Cup and Handle Pattern which is Pretty Good Because This means the Price has a chance To increase Pretty Soon! This shows Us that Bulls Might be Coming Back ! You can see there has no Break out Occurred yet So we can not be So Sure about the Incoming Movement But It will Happen pretty soon. the expected movement is as much as the Length between the Top and the Bottom of the Cup (Measured price movement) and you know that the Price will be increasing as much as that Movement (AB=CD) if our prediction comes true, price will increase around 70% and will reach 2.21$ which is also a Decent Resistance.This chart and Info are Provided by our Sponsor WHITEBIT Exchange. Please Check their Exchange Using the link down below.
-SAND is in a Cup and Handle Pattern.
-No break out yet
-AB=CD
-2.21$ is a target and a Resistance
_ _ _ _ _ _ _ _ _ _ _ _ _ _ _ _ _ _ _ _ _ _ _ _ _ _ _ _ _ _ _ _ _
Thank you for seeing idea .
Have a nice day and Good luck

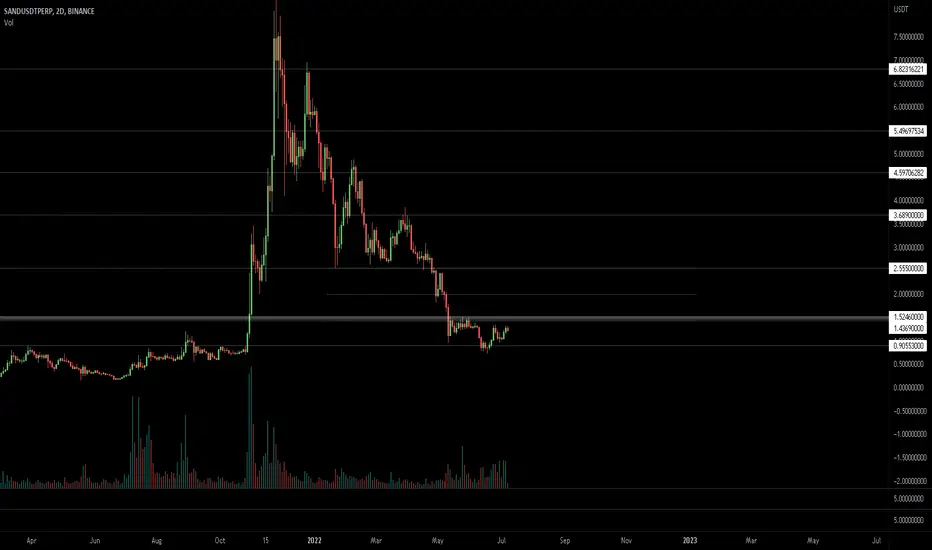
SANDUSDT 1D Is it time to play in The Sandbox again?)During the strong fall of the crypto market in May-June 2022, the SANDUSDT price reached a liquidity level around $0.70
Around this level that the liquidity position was gathered in October 2021 before the upcoming 1100% upward pumping.
In June 2022, the rebound from the bottom was +84%, but the price of SANDUSD, despite two attempts, at this moment could not get a foothold in the upper part of the downtrend channel.
The message of this idea is simple: if you believe that game tokens still have a future in the crypto market, then The Sandbox is worth your attention. At least on the chart we see activity and the struggle of buyers and sellers.
Ideally, wait for the Sand price to fix above $1.10-1.20.
The first target from above is $2
Large positions will begin to sell off no faster than in the liquid zone of $2.50-3.50
_______________________________
Since 2016, we have been analyzing and trading the cryptocurrency market.
We transform our knowledge, trading moods and experience into ideas. Each "like under the idea" boosts the level of our happiness by 0.05%. If we help you to be calmer and richer — help us to be happier :)

Sand can create double top If the double top pattern is confirmed it can drop onto its below trendline

21% profit from Sand divergenceSand is in the triangle. it came to its downside with very clearly divergence. Then it went up to its upside of triangle !

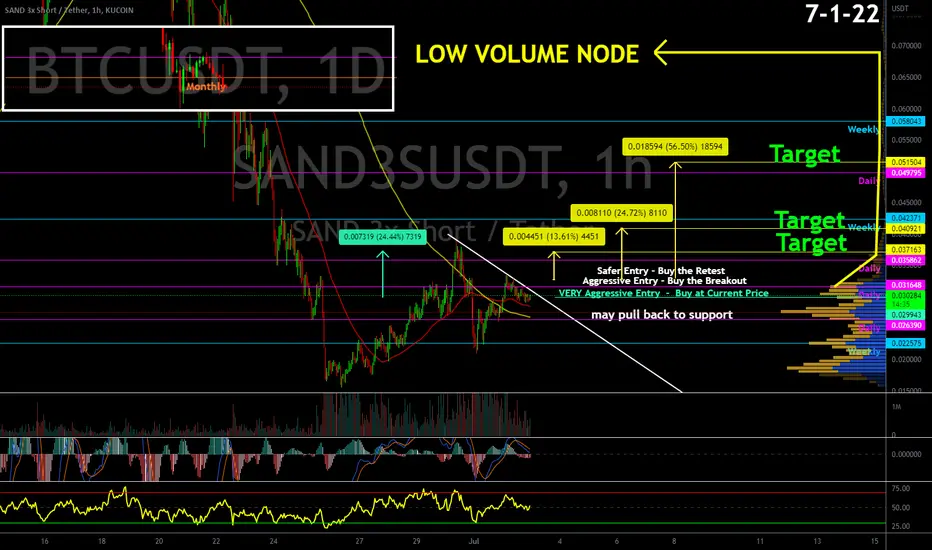
SAND3S SAND short price movement predictionSAND3S currently in downtrend - wait for break of trendline and safest entry is on retest of daily ( 0.031648 )
LOW VOLUME NODE identified on chart
no divergence on chart
DYOR - do your own research
Price Prediction
not financial advice
this is for entertainment purposes only
always DYOR
Cup & Handle x SANDLooking at SANDS daily chart and it can’t help but notice the obvious cup & handle pattern.
BULLISH.

SANDBOXSAND/USDT waiting to see next move on this coin now touching our Supply Zone but im waiting to make Double Top on SELL ZONE

lONG TERM ANALYSIS FOR SANDBUY NOW WITH SPOT OR WITH FUTURES @ 3X MAX.
Buy that new house with this investment.
This is not a financial advice.
Be Wise with your Money.

Long-term #SANDUSD #SANDUSDT Analysis - MONTLYWith the recent events on cryptocurrency; I think we will start seeing less coins getting pumped and more of the solid coins getting attention. By solid, I mean coins that actually has a project and some kind of revenue coming in. Currently a lot of coins are back to prices of last year, if not, then lower. This makes it a great entry point for those that wanted to get in a few months ago, but thought prices were too high. Sand's (4th) wave count has retraced to the peak of wave (1) and bounced nicely. This is usually a good indication that the bottom is in. We don't normally enter wave 1 territory unless btc does something drastic. The market sentiment is still uncertain and people are fearful, which makes it a perfect op BINANCE:SANDUSDT FTX:SANDUSD portunity for institutional investors to start investing.
