SAND/USD - Will it break above the top trend line?SAND/USD - If it breaks above the top trend line I expect it to explode.
SAND

Sandbox UptrendSandbox volume breakout 6 month downtrend.İ got position 3,06 entry main target it 4,5-4,6 zone i want to take TP.Lets go gl everyone..

SANDUSDTSANDUSDT daıly graphic.
Blue channel is working well.
black line breaking is important to buy.

GALA - MOONTIME !Hey traders,
The chart shows a Positive divergence in the RSI indicator.
You WILL see the Buy signal in the stock indicator,Maybe to night.
You can see the broken downtrend line.
Will it reach the moon?
Do not forget to use Stop loss.
Please like and share.
Thank you.

sand/usdtTesting/tracking elliot wave theory. Please do not trade off idea without S/L. Not financial advice.
Link to previous chart:
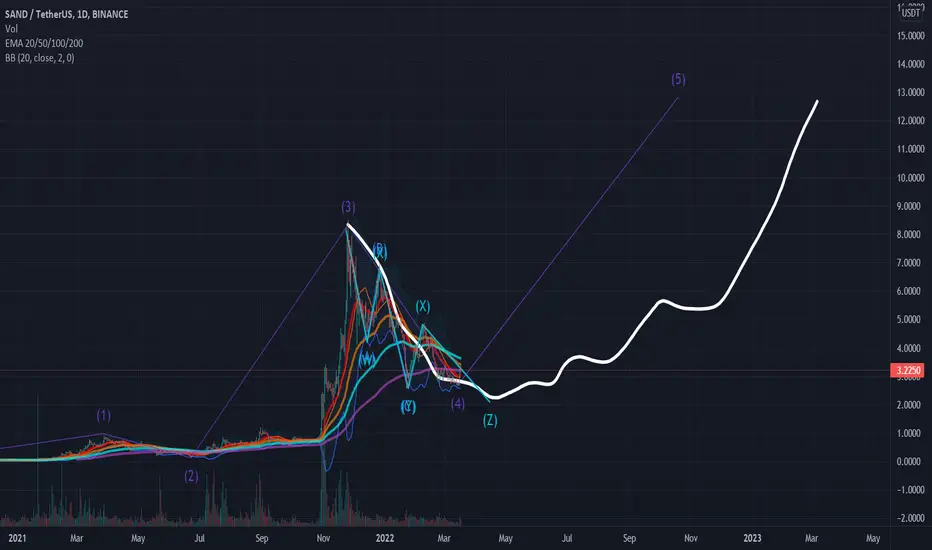
sand/usdtTesting/tracking elliot wave theory. Please do not trade off idea without S/L. Not financial advice.

SANDUSDT SETUPSANDUSDT price showed some strong bullish momentum with good volume and Now the price is trying to retest that level. Now if bulls successfully retain this breakout and retest it they can easily claim the near-term resistance area. Buy on dips will be a good strategy.

SANDBOX - $SANDI'm looking to accumulate Sand into my portfolio, so i'm posting this to see if i can see any patterns forming in how $Sand does in this current market state.
Short Term - I see Sand retracing a bit from today's HSBC news pump back to retest the previous support; the news helped break out of the current down trend. I'm expecting to see sideways action for the next month leading into the summer.
Long term - DCA during the dips and if it dips into the green area of support, then i will be buying more to lower my average.
Not financial advice - always do your own research.
This chart is for speculation purposes only.

SANDUSDTSand has broken above the falling trendline and formed a Marubozu close candlestick pattern, which is a bullish sign. It has a bullish divergence on the daily chart as well (the divergence is a bit weak). It needs to attract some volume which, in my opinion, will increase once it closes a daily candle above 3.38. You can either enter now (a bit-risky although) or after it closes above 3.38 for the target of 4.43 and 4.82.

Time to get excited?Here's a quick Look at SAND daily chart. As we can see, the price has been forming a bigger descending triangle and a break to the upside could be around the corner! The price is very close to a bigger break to the upside. The best entry would be, when the price breaks above the 3.45$ with good amount of volume . Definitely one to keep an eye on.
The market might shift soon, and big gains could be coming our way!
-------------------------------------------
The idea is: Buy when the price breaks above 3.45$ and take profits at the levels shown in the chart.
Targets:
1. 3.85$
2. 4.4$
3. 5.7$
-------------------------------------------
What are triangles when it comes to trading?
Key points:
"1. In technical analysis , a triangle is a continuation pattern on a chart that forms a triangle-like shape.
2. Triangles are similar to wedges and pennants and can be either a continuation pattern, if validated, or a powerful reversal pattern, in the event of failure.
3. There are three potential triangle variations that can develop as price action carves out a holding pattern, namely ascending, descending, and symmetrical triangles."
-------------------------------------------
If you like the content, then make sure to comment and like the post :D
Follow me for daily profitable trading setups
BTC dictates the market. If BTC falls, then Alts will fall as well. Trade safe!

hidden crab?crab harmonic pattern:
X=$16.4
AB=0.61 XA
BC=0.38 AB
1.6 BC=$2.79
0.78 XA=$3.23
2 BC=$5.6
0.88 XA=$6.91
2.24 BC=$8.66
2.6 BC=$17.24
1.13 XA=$43.9
3.6 BC=$106.5
4.23 BC=$328
1.6 XA=$1776

SandBox in the beginning of the 3rd wavecrab harmonic pattern:
X=$4.87
AB=0.38 XA
BC=0.38 AB
*1.6 BC=$0.197
2 BC=$0.31
2.24 BC=$0.41
*2.6 BC=$0.64
0.78 XA=$1.24
*3.6 BC=$2.12
0.88 XA=$2.36
4.23 BC=$4.43
1.13 XA=$11.13
1.27 XA=$27.47
1.41 XA=$66
6.85 BC=$98.9
*1.6 XA=$248

Sand Retest hereVolume on break out and retest looks a bit sus! But there is the possibility of the up move from here. Keep a close eye here.

SAND - A Gem in AltcoinsI have never made a chart about SAND ever however after looking at this chart, I think it's a real gem.
I am looking to enter the trade once it touches the support trendline or $2.3 and target will be $60.
Let's see if this executes or not.

SANDUSDTHello Crypto Lovers,
Mars Signals team wishes you high profits.
We are in the daily time frame. The price has moved down to the support zone. There are two scenarios. The price can go up to the first resistance and if rejected, it will move back down and if broken, it will move up to the next resistances where you can save profit. If the support zone is broken, it will fall further.
Warning: This is just a suggestion and we do not guarantee profits. We advise you to analyze the chart before opening any positions.
Wish you luck

SAND Potential Swing Long Set UpThe first and second green fib retracement lines will be the entry zones. Depending on the market in the following weeks and months, Sand could potentially come back down to retrace the 0.5 level or even the 0.618 in which new entries could be placed.
The purple fib levels will be your take profit. Take note, in the scenario in which price actions of sand goes up without hitting the purple take profits fib levels, take some profits.

A SHORT TRADE FORMING IN SAND FOR INTRADAY LEVELSBy the looks of it, SANDUSDT is forming a good trap for buyers. If everyhting goes my way, then I think that we might see a false breakout of the current resistance level at 30 min timeframe, makes a bullish candle in order to trap buyers to enter a LONG position.But the problem is that there is a continuing resistance trendline which started from 9th March. What I think is that SAND will take resistance from there and I am planning of entering a short trade whenever the right time comes and with a decent Stop Loss.
If u can relate to my planning, then please Like, share and follow my channel. (NOT A FINANCIAL ADVISOR)
THANKS (:

ROADMAP: SAND/USDT, Potensi Bullish di 2 area SupportSAND/USDT pada Timeframe 1D, menggunakan teknik support sebagai area Buy dan resistance sebagai area TP

IS THE SANDBOX MADE UP OF QUICK SAND? (BUY ZONES!!!) METAVERSEGreetings Investors!
Today we consider the trading pair SAND/USDT
Alright, Lets begin!
Sand has seen impressive price growth since it's listing back in August last year, forming an Ascending Channel that price has continued to respect each time it has been tested.
Question is, will it respect it this time?
Taking a Look at our RSI, a bottom formation started to form while also creating an accumulation range in price action, and confirming with a second bounce on rsi support before a breakout from the range. Growth was 1537% from above the range.
Soon after, Sand will go on to form Resistance for it's current channel (both on price and RSI) marking a top and confirming it with a mini acuumulation in Price and RSI(blue circle), before getting rejected bact to the channel's support, breaking below the 50 level rsi as well as it's trendline and confirming a bottom with multiple bounces in the oversold region.
Finding a bottom on wave 2 correction, Price seems to be replicating the same pattern on the RSI and price action after a wave 3 top.
Each accumulation range from breakout to top had diminishig returns, hence multiple range forecasts shown depending on if it's time to go down or if we test resistance one more time.
ENDGAME:
Wait for price to either return to RSI oversold region or Channel support for Buying action.
ATR Bands suggest a sharp move is incoming as well.
Should the two not sync this time around, do not rule out Fifth Wave Extension Bottom Scenario.
If you agree with this idea, Please leave a like & share🙏 as well as your thoughts in the comments section.
As always, feedback is appreciated🙏
NOTE: DURATION OF WAVE FORECAST MAY BE INACCURATE!

SAND LONG FINISHING PATTERNSand bounced off of a support 3 times, and is at the end of a flag pattern, after break out we should see retracement to the 50% fib zone.
Aroon: On a daily time frame we see orange line crossed a blue one which shows start of a bullish trend.
MACD: We are already seeing light red candles which indicates bullish movement gain.
Bollinger band: We just bounced off of a bottom Bollinger band which indicates bullish trends start.
Entry: 2.97
Invalidation: 1.95
Target: 5.38

SAND Short SetupSAND Short Setup
Sell Momentum
Please noted this setup is HIGH RISK because its already hit fibo 1,68 (Take profit of sell momentum area)
Entry:
Sell market high risk
Sell limit 4.2082 - 4.3809
Target:
TP1 4.0355
TP2 3.7561
TP3 3.3040
Stoploss:
You decide
Always do your own research!

SANDUSDPotential Move to the upside to Fill in this Daily FVG before we get a continuation to the downside to take out the Equal Lows and and retest $2.00

Sand elliot wave , SHORT THERMA possible scenario for sand , if u see price follows this pattern u know when to enter when to sell .
