I think the sand will repeat its rise to at least $ 7 -> X10I think the sand will repeat its rise to at least $ 7, this is X10 from today's level
SAND

SAND/USDT | Seems like Ready for Massive Bullish Rally..!!
#SAND Looks Promising for Descending Channel Breakout in 1D TF..!!
Expecting +300% Bullish Rally in the Midterm.. 📈
It's important to maintain a Disciplined and Patient approach to investing in order to achieve Long term Success.
Please like the idea for Support & Subscribe for More ideas like this and share your ideas and charts in Comments Section..!!
Thanks for Your Love & Support..!!

SandBox ($SAND) : Bullish Pattern development in long term?Hello everyone!
If we look at $SAND in a medium-long term, we cannot rule out a big picture as shown on weekly chart. The big signal of Price Action will be the Neckline achievement (shown on chart as wave IV retest) of a large "Head & Shoulders". Working on daily time frame, I found some interesting resistance levels, useful for evaluating the strength of the trend, step by step.
I came up with this idea thanks to our last trade on Sandbox, which developed a potential bullish impulse structure.
(Click and Play on Chart below)
If there are conditions, I will update this idea below.
...trade with care! 👍
Cheers!
If you think that my analysis is useful, please...
"Like, Share and Comment" ...thank you! 💖

SAND had a strong bullish trend over the past weekSAND had a strong bullish trend over the past week, holding the support of the $0.70 range, creating a strong bullish wave on the daily timeframe.
The break of the previous ceiling has been confirmed, but there has been a strong reaction as the price has hit the resistance identified in the $0.90 range. One of the important resistance levels of the sandbox is in the range of $1 rand, which is the target of buyers.
Sandbox has had a range trend over the past week. The price fluctuates between the considered resistance support levels.
The support range of this currency is at the price of 0.610 to 0.670 dollars and its resistance is at the level of 0.880 to 0.900 dollars. Above this resistance, there is a very strong level in the $1 range, breaking these levels requires special support from buyers. Given the selling pressure created in the market yesterday, we expect the Sandbox corrective trend to deepen more likely, and by breaking the current support, the decline could continue to the $0.550 range.
But in the bullish scenario, if minor support is maintained in the range of $0.700 to $0.685, and in the 4-hour timeframe, we can expect another positive swing.
The important point for the medium and long term is the strong bullish wave started at the $0.40 range, if the supports hold, there is the potential for the sandbox to break the $1 resistance, to the $1.25 level. to continue
SAND TO HIT $1$SAND was below 200 daily MA since April, 2022!
This daily breakout candle is a strong buy signal indicator. Retest looks clean.

THE SANDBOX Price Analysis TO THE MOOOON!!??$$$ DAILY CHART $$$Here are some key LVLS of support and resistance for the sandbox token :)
After this nice PUMP to the upside.. Will SAND keep the momentum!>>>????
LET ME KNOW WHAT YOU GUYS THINK :)
BINANCE:SANDUSDT

Like Sand in the hour glass...If you find this info inspiring/helpful, please consider a boost and follow! Any questions or comments, please leave a comment! Also, check out the links in my signature to get to know me better!
From an Elliott Wave stand point I would be looking for at least a sweep of the low. My main focus is on these levels that seem to be reactive atm.
I will be keeping an eye on these levels for plays.
Cheers!


Formation of the next bullish waveBuying pressure on SANDBOX increased again after going through a corrective trend, and buyer support led to the formation of the next bullish wave. The target that we considered in the previous analysis is seen, and the main target is in the range of $1.02. Of course, due to the high strength of yesterday's bullish candle, which is closed at the ceiling, there is also a possibility of breaking this resistance. Its strongest resistance is considered in the range of 1.42 to 1.49 dollars.

The Sandbox #SANDWhat Is The Sandbox (SAND)?
Launched in 2011 by Pixowl, The Sandbox is a blockchain-based virtual world allowing users to create, build, buy and sell digital assets in the form of a game. By combining the powers of decentralized autonomous organizations (DAO) and non-fungible tokens (NFTs), the Sandbox creates a decentralized platform for a thriving gaming community.
According to the official whitepaper, the Sandbox platform’s main mission is to introduce blockchain technology in mainstream gaming successfully. The platform focuses on facilitating a creative “play-to-earn” model, which allows users to be both creators and gamers simultaneously. The Sandbox employs the powers of blockchain technology by introducing the SAND utility token, which facilitates transactions on the platform.

Sandusdt Formed Bulish FlagFormed Bulish Flag In h4 Timeframe
Incase Of breakout expecting 25 To 30% bulish Move

Sandbox Testing TrendlineIn Daily Timeframe Testing More Then Year Old trendline Incase Of breakout expecting 140 to 150% Bulish Move
Entry Would Be Only Valid After breakout


SAND Coin (Sandbox) : "Buy the dip" with a nice TargetHi everyone!
Sand's main trend is still bearish, but we do not rule out some interesting corrective moves in the near term. If our analysis is correct, it might be interesting to accumulate on corrective swing and let Long positions run up to 0.6765 area.
If this idea will be supported by your "Likes" we will continue to follow the crypto with updates below.
thanks for your attention and please... trade with care! 💖


#SAND $SAND #SANDUSDSand have to finish above the MA 200 with big volume to confirm we are in a bullish trend, only then i will enter the trade!


SANDBTC 1DThe SAND after being trapped in a falling wedge for a long period has finally broken out. Now it needs to pass the resistance of 0.00004347 , the ichimoku cloud and MM200, which at first appear to be strong resistances, but also act as a “magnet” pulling SAND up. The pair alone is worth the hold. Mataverse tokens were dormant and undervalued, and there is already positive movement towards them.

SAND analysis...check ithello guys...
sand breaks up its descending parallel channel very well and strongly!
in my opinion, it will touch the next line of the channel.
it is great if it pullback to the breaking line but if not be aware of the next movement!
there are two targets for spot assets, I show those as a pink area!
always do your own research.
If you have any questions, you can write them in the comments below, and I will answer them.
And please don't forget to support this idea with your likes and comments.

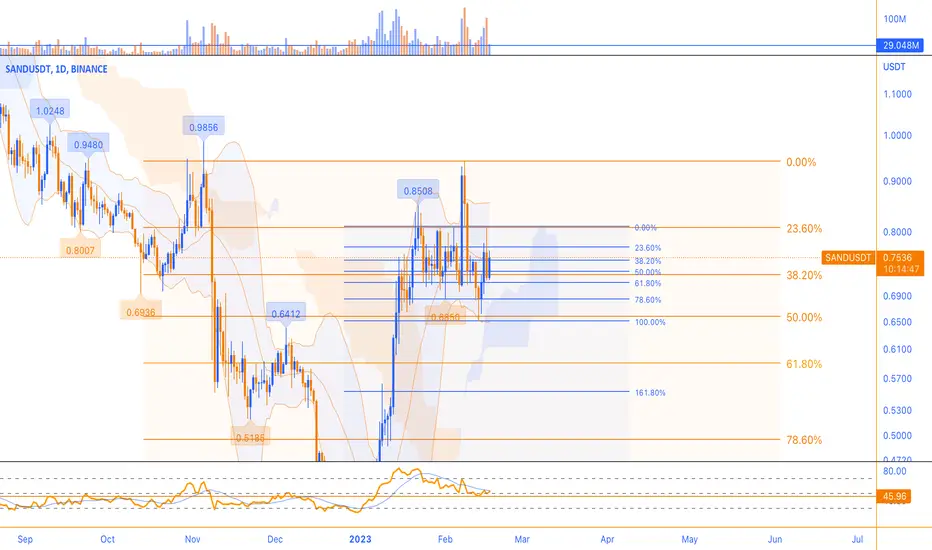
We can expect a stronger positive reactionSAND's price, which had a negative reaction in the resistance range of $0.805, pulled back to its support in the range of $0.657 to $0.750. If this area has a positive reaction, SAND can grow to the targets of the $1 range this week or next. The strength of the bullish wave is enough to change the trend in the daily time frame. But a bottom pivot and the formation of a corrective wave are needed, which with more probability, we can expect a stronger positive reaction in the second support range, i.e., the price of $0.584 to $0.641. So, if the support area of $0.67 is broken, the decline can continue to the level of $0.584, and in this area, we can expect the formation of reversal patterns.

SANDUSD IdeaA reversal idea for SANDUSD
Showing an inverted H&S pattern with each arm of the H&S pattern being above the channel
I expect this pattern to act as a reversal pattern and push price up further towards the dashed green line
This dashed line is the first place of resistance

Theta coin formed a bullish Gartley | A good buy opportunityHi dear friends, hope you are well and welcome to the new trade setup of The Sandbox (SAND).
Previously I shared a long-term trade setup for SAND, which is still in play as below:
Now on a 4-hry time frame, SAND with BTC pair has formed a bullish Gartley pattern for another pump soon.
Note: Above idea is for educational purpose only. It is advised to diversify and strictly follow the stop loss, and don't get stuck with trade

SandThese are his resistances for a month ago, when we said he would reach them, and they have just reached them
Now we have a green box in 5 minutes as support and one hour time for those lines
For ease of work, we drew a channel in 15 minutes, which will probably go to the midline of the channel, and then we will see if it goes to attack the roof again or not.
