Sandbox

Sandbox following the same double bottom pattern as most altsYet another alt with the same pattern. It’s currently above its smaller double bottoms neckline and will likely confirm a breakout from that zone in the next couple daily candles.

SAND DESCENDING TRIANGLE PATTERNSand is looking bullish…. But for now, I want the market to make one last pullback to eat already entered buyers SL’s and then what can happen is that SAND can take support from its demand zone and can continue to go on to break the descending triangle pattern upwards…
I am thinking of entering around 2.40 - 2.45 level….
1st Target → 2.55
If it keeps on going, then I'll think of trailing my stop loss and continue the ride…
Hope you like it and plz press the follow button to support my ideas (:
(((((NOT A FINANCIAL ADVICE)))
BINANCE:SANDUSDT

I guess there are no any other options does #sand hashere we are what we have about #sand one of my favorites and it always will be, I marked every possibility on the chart for you but be careful don't use this analyz as a trading setup!

Sandbox longSandbox bounced off the lower boundary of descending channel. Bullish movement to resistance level at 2.8899 is possible.

SANDUSDT SETUPSANDUSDT price has reached a confluence zone of Fib level and EMA 400. This area is critical for bulls to retain as on breaking there is no major support available. So, we are expecting the triangle squeezing and support may attain some accumulation and an upward surge will start soon.

#Sandbox #SAND and the $2.70 mark - Doctor, how bad is it?Sandbox (SAND) and the $2.70 mark - Doctor, how bad is it?
SAND lost the important volume mark and might now fall with huge speed since we miss volume below this mark until the $1 level.
All bulls must hope for a fakeout followed by re-entering above $2.70.
What do you think?
Drop me a nice comment if you'd like me to analyze any other cryptocurrency.
*not financial advice
do your own research before investing

SANDUSDT, The price has consolidate below the resistanceHello everybody
Im sure that anyone know about what is sandbox in crypto ? and what do they do in metaverse ?
If you dont know or dont hear about SAND, go and learn at first then investing in crypto
According to the chart and last analysis that we published, the price is moving until now in upward channel from the begining of making.
As you can see the price broke the support level and it changed to resistance and now the price is doing to consolidate itself to accept the level and its ready to continue move downwards.
The trend is going in downward and it better to take short position.
The price can drop to the pivot main support level that we shown it on chart, if you wanna take in position please dont forget use stop loss and observe to capital management.
Good Luck
Abtin
Previous analysis :

I GUESS IT IS QUICKSAND? - METAVERSEIt's been a while since our last idea.
We're looking at SAND/USDT today.
In our previous SAND analysis, we predicted a drop down to these current levels and potentially further down, and we've been spot on so far as shown below:
Question is will we drop further down?
Well, as you can see from today's analysis in the chart above, SAND is currently trading at strong support zone, also in line with the bottom of the ascending channel. Should we close below this, a drop down to the blue zone is very much likely with 0.9 being our worst case scenario(provided the First Wave Extension Scenario confirms).
In our last update we also showed that price action was forming a bullish pennant, but failed to get anything out of it. Now this support region is the last go for the bulls to make a comeback.
Whilst we should average down at this level, we want to see a drop further down to preferably 1.5-1.2 region for large buys.
When we see price trading within the purple zone, we will have confirmation of a breakout and ATH's imminent as seen in past price action.
June 15 & July 7 dates are potential dates to watch for a bottom or for price to enter the purple consolidation zone depending on how the market responds.(Don't depend on the dates)
If you agree pls like and share and comment your thoughts below.
Feedback is always appreciated!😉

SAND/USDT : Huge sell signal is about to trigger !BINANCE:SANDUSDT
Hello everyone 😃
Before we start to discuss, I'll be so glad if you share your opinion on this post's comment section and hit the like button if you enjoyed it!
$SAND has formed a Flat bottom triangle and now it has reached the bottom's support zone.
The formed demand here has held the pair four times and now it's the fifth attempt of break.
Based on five break-out attempts; There's a high chance for bears to take the lead below the local demand.
- Also two bullish trendlines are located right below the current rate of market price:
Based on the chart above, If we get the closings below the demand zone, Then it's more likely for bulls to lose their bullish trendlines neither...
This can become a great opportunity to locate our Short on a proper retest of the broken demand zone or the broken trend zone/line!
This idea comes with a clear Short Setup :
Trading setup :
🔻 Entry Pointes : $2.562 ( On Retest after daily closings below )
📍Targets : $2.25 - $2.00 - $1.75 - $1.44
🟥 Overall stop-loss : $2.9 ( Daily closing above )
Hope you enjoyed the content I created, You can support us with your likes and comments!
Attention: this isn't financial advice we are just trying to help people with their vision.
Have a good day!
@Helical_Trades

DOSE $0.17 | From the POWERS of Sandbox Welcome to FITNESS METAVERSE
in a ny business especially in packaging and marketing
we go with the experts...
ANIMOCA shall take this to insane levels

Hello Sands My Old Friend. Hello Sand, Last Time we met, You were the master, now my Power in the force is immense- Padawan-
Hand me my lightsaber

SAND/BTCSAND/BTC pair at a long term support on the weekly chart, StochRSI very oversold, price sitting just above the 0.618 fib level. The chart says it all. Good luck!
Not financial advice.

SandBox ( SAND/USDT ) 1000% Potential from here... Read Detail#SAND/USDT TA Update:-
$SAND currently trading at $2.69
Overall Chart is in an Uptrend on a Long Term basis , But Still need a Breakout for the confirmation of Further Bullishness .
Breakout Point = $3.30 Level .
( Need a Breakout of this level for Bullish momentum )
According to Price Action , and what I'm also expecting is $SAND can Bounce from this Support levels.
So , Let’s hope Price not break This support levels.
After Breakout ,✅ Target = $29 ( 1000% )
Exit Point = if Candle close below $2.10
Risk = Low
Reward = High
But keep in mind for Bear Scenario , if happen and Candle close below $2.10 then We can see $SAND price at $0.85 level .
But $SAND holds huge potential for Long term.
Especially #Metaverse
✅Targets:- $4.71/$7.26/$29
I hope I explained very well and you also Learn and Understand very well.

Virtual vs Real-Estate: The US Housing Slowdown vs the MetaverseRising interest rates by the Federal Reserve has people concerned of a potential slow-down in the housing market (worse-case scenario, a recession, or even a depression).
How would this affect crypto - and metaverse assets in particular? A closer and updated look at what's been going on in virtual vs. real-estate, especially in China (still down by 60%+).

New entry idea for SAND! - Keep an eye on this setupHere's a quick Look at SAND daily chart . As we can see, the price has been forming a bigger descending triangle and the price is at the apex of the triangle! The price is very close to a bigger break to the upside. The best entry would be, when the price breaks above the descending triangle with good amount of volume . Definitely one to keep an eye on.
The market might shift soon, and big gains could be coming our way!
-------------------------------------------
The idea is: Buy when the price breaks above the descending triangle and take profits at the levels shown in the chart.
Targets:
1. 3.4$
2. 3.75$
3. 4.4$
4. 5.5$
-------------------------------------------
What are triangles when it comes to trading?
Key points:
"1. In technical analysis , a triangle is a continuation pattern on a chart that forms a triangle-like shape.
2. Triangles are similar to wedges and pennants and can be either a continuation pattern, if validated, or a powerful reversal pattern, in the event of failure.
3. There are three potential triangle variations that can develop as price action carves out a holding pattern, namely ascending, descending, and symmetrical triangles."
-------------------------------------------
If you like the content, then make sure to comment and like the post :D
Follow me for daily profitable trading setups
BTC dictates the market. If BTC falls, then Alts will fall as well. Trade safe!

SAND/USDT - Potential 74% SetupHello Traders!
SAND has been moving in a downtrend for a long time. The price has found support near the $2.73 level. RSI on the exit from the bearish zone, the price is approaching the breakdown of the downtrend.
Counting on the exit of the asset from the long correction, it is possible to work short-term from purchases, looking for such purchases can be in the price range of $2.72 - $3.00.
The targets for such purchases will be price levels of $4.00 and $4.74.
Close the deal using stop-loss only in case of price decrease below the price level of $2.05
Good luck and watch out for the market
P.S. This is an educational analysis that shall not be considered financial advice

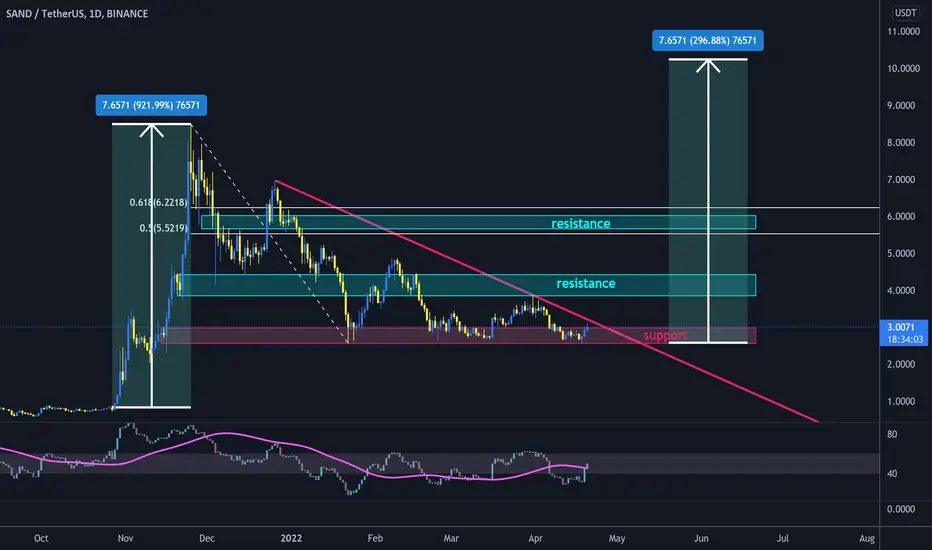
SAND near to break out triangle#SAND/USDT
$SAND hold the lower line of triangle, and price is below upper line of this pattern.
🐮 break out from upper line of triangle will head up price to resistance zone between 0.5 and 0.618 fib levels and potential to reach $10 in mid term.
SandBox Bullish can give 10X returnsSand Box one of the best projects in gaming industry ,with NFt's and much more . This project has so much potential in coming months that it can easily give 10X returns. Best coin for holders
Please Like, Share and Comment.

$SAND 1D chart to watchprobably bitterer off trading confirmations
huge IF is ofc how $BTC plays out
4H EMAs ww
execute accordingly

SANDBOXSAND/USDT As we can see, the price has been forming a bigger descending BullFlag Pattern .
TP 1 = 3.50$
TP 2 = 4.35$
TP 3 = 5.00$

Sandbox (SAND) and the $2.70 markSandbox (SAND) and the $2.70 mark
At this price level the volume in the first half of November 2021 was by far the biggest.
See how the price reacted so far at this level.
Good accumulation point on the one hand... bad if we loose this support on the other hand.
Who would buy here dear Crypto Nation?
Drop me a nice comment if you'd like me to analyze any other cryptocurrency.
*not financial advice
do your own research before investing

SAND is bullish$SAND broke through the resistance level and the descending trendline. Bullish movement to resistance level at 3,68$ is expected to happen.
