The Sandbox (SAND) formed bullish BAT | A good buy opportunityHi dear friends, hope you are well and welcome to the new trade setup of The Sandbox (SAND).
Previously I shared a long-term trade setup for SAND, which is still in play as below:
Now on a 2-hr time frame, SAND is about to complete a bullish BAT move for the bullish reversal move.
Note: Above idea is for educational purpose only. It is advised to diversify and strictly follow the stop loss, and don't get stuck with trade.
Sandbox

long for sand is goodWe are waiting to receive for long or short, but the reviews give more possibility of growth, so let's be optimistic.

Sand Preparing For Massive recovery Seems Like getting ready For Massive Breakout Formed Descending Channel In 3days Timeframe Incase Of Breakout expecting 250 to 280% Bullish Wave

SANDUSD Strong RSI The RSI structure here heavily favours the bulls as the rise up has already began in comparison to others where they are still in free fall phase
I expect a double bottom on chart and a complete reversal

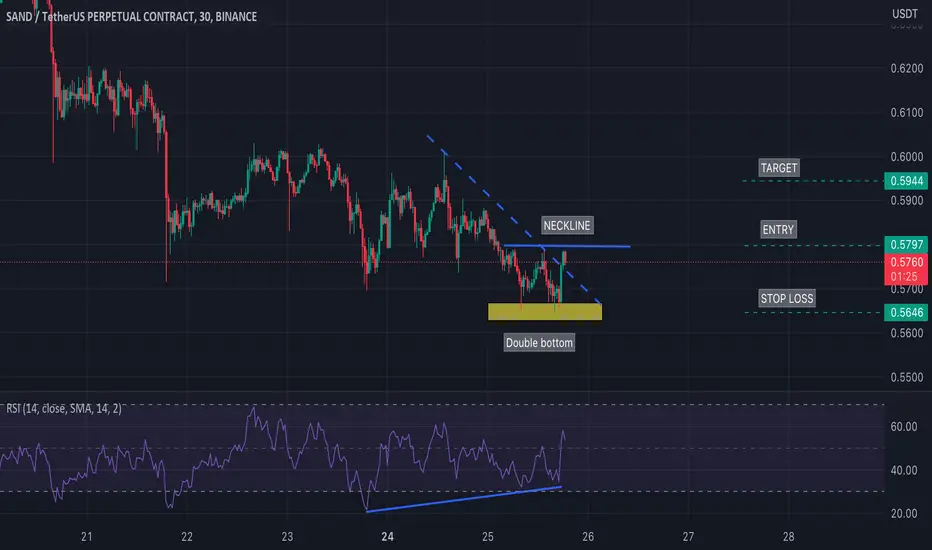
🔥SANDBOX CAN CHANGE IT'S TREND SOON: BE READY FOR IT!🔥Hi, friends! SANDBOX is only falling since the beginning of 2023. I think the seller's pressure will end after the squeeze to the trendline and its breakout.
We must enter our long trades before SAND skyrockets.
📊 TRADING PLAN FOR SAND:
🔥 volume growth during the false breakout
🔥 squeeze to the trendline
🔥 bullish BTC is a must-have for altcoins growth
✅ THE MAIN TARGETS FOR SAND:
1. $0.57-0.65 - the value area and strong resistance
2. $0.76-0.80 - the value area
💻Friends, press the "boost"🚀 button, write comments and share with your friends - it will be the best THANK YOU.
P.S. Personally, I open an entry if the price shows it according to my strategy.
Always do your analysis before making a trade.

W10-36 SAND BULLISH IDEAPotential Bullish Entry Dow Theory In Place -
Higher High and Higher Low Expected in Place
Formation of double bottom coupled with bullish divergence (Bullish reversal pattern)
Entry, SL & TP Levels are defined.

W9.1-29 SAND SHORT TERM BULLISH IDEAPotential Bullish Entry Dow Theory In Place - Higher High and Higher Low Expected in Place Formation of DOUBLE bottom coupled with bullish divergence (Bullish reversal pattern) SL & TP Levels are defined.
W9-33 SAND BULLISH IDEA (HARMONICS BULLISH PATTERN)Potential Bullish Entry
Dow Theory In Place - Higher High and Higher Low Expected in Place
Formation of Harmonic Bullish reversal Pattern coupled with bullish divergence at potential reversal zone (PZR)
Entry at the new HH
SL & TP Levels are defined.

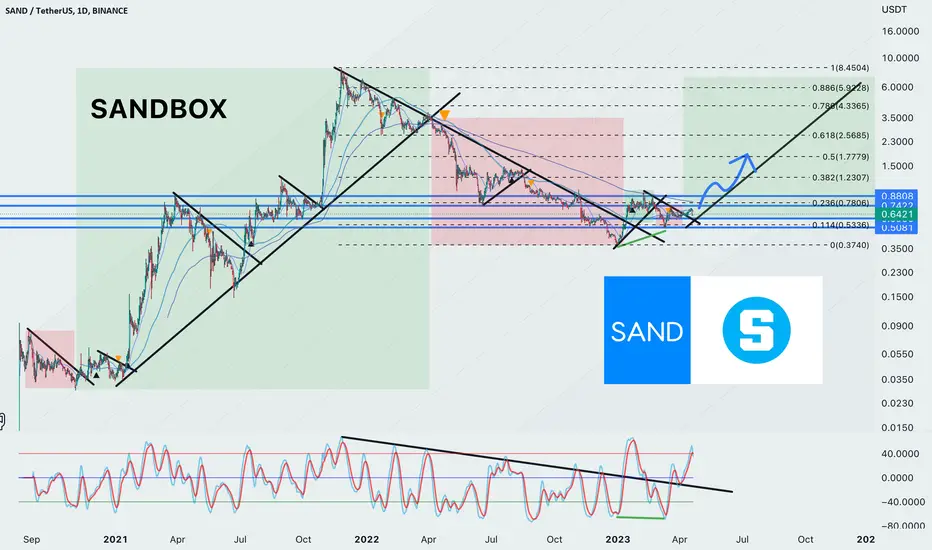
Analyzing the Price Trends of SAND Cryptocurrency SANDBOXThe growth of SAND cryptocurrency in the 2021 year has been nothing short of remarkable. In just 13 months (from 2020), the price of SAND rose from a humble 0.02$ to an impressive 8.00$. This meteoric rise has caught the attention of many investors, who are now scrambling to get in on the action. What is even more impressive is that this growth occurred after a time of great uncertainty in the world, as the COVID-19 pandemic was wreaking havoc on the global economy. Despite these challenges, SAND was able to grow exponentially, proving that its unique blend of gaming and blockchain technology is resonating with a wide range of people. As we look to the future, it's clear that SAND has the potential to continue its growth trajectory.
The SAND cryptocurrency experienced a significant price drop in 2022, with the token falling from its previous high of 8.00$ to just 0.37$. This decline took many investors by surprise, and many were left wondering what the future held for SAND. However, it's important to note that this price drop was not unique to SAND, as the entire cryptocurrency market experienced a bearish trend during this time. Despite this setback, the team behind SAND remained committed to the project, and continued to work on improving the platform and expanding its partnerships. In 2023, the price of SAND finally established a bottom, with the token hovering around the 0.37$ mark. While this is a significant drop from its previous highs, it's important to keep in mind that cryptocurrency markets follow same cycles over and over again.
Based on technical analysis of SAND's chart and its Fractal structure, it's possible that the token may experience a price increase in the coming months. The chart indicates that SAND has been consolidating in a range between 0.3$ and 0.8$ for several months, which could indicate a period of accumulation by investors. Additionally, there has been a recent uptick in trading volume, which may signal increased interest in the token. Based on these factors, it's possible that SAND could see a price increase in the spring or summer of 2023, with the token potentially reaching levels of 2.0$ to 2.56$.
GAMiUM: $0.005 | The Next Sandbox first of its kind with decent tokenomics where everyone gets a fair allocation
lock up is 3 months and 12 months
dressing up in play for Metaverse Theme . and June September Crypto Summits
could be mis priced or under valued intentionally just like GMT stepn
and we await listing in Binance and Coinbase for that massive adopotion
for now... only few are invested
soon they will come
many
and desperate to FOMO at Insande Levels with Volune
gamium.world

SANDUSD long positionSANDUSD looks bullish.
Not the best entry now and kina difficult to setup the stop loss but the trend continuation is very likely now so if you wanna take a risk and long SAND, you can catch the uptrend continuation now.
Take profit levels / targets , stop loss are shown on the chart


Sand On verge Of massive breakout Seems Like already Bottomed Out And getting ready for massive Breakout
formed Descending Channel In Htfs Incase Of breakout expecting 200 to 220% bullish Move

Sand shortLiquidation process is activated, bears were liquidated on $0.94 level, now price target is $0.59 to liquidate bulls from the last consolidation...

SANDUSDT on weekly support, long favorable towards weekly resistThe price has hit the weekly support and trading currently just above it. Since the price is around support, a long is favorable here.

DEVT: $0.60 | Buy and Forget towards Key Levels & $18Battle Royale evolution with Griffith and Circle as peddlers to Big Shots
only if you saw SAND and MANA back in the day before it mooned above Unicorn Status $1bn moolah

SANDUSD Daily: 25/03/2023: First long then short!!!
You can see all the details on the chart.
Please pay attention, we need low-timeframe confirmation.
It's not investment advice, so do your own research!!!
If you have questions, feel free to ask!
💡Wait for the update!
🗓️25/03/2023
🔎 DYOR
💌It is my honor to share your comments with me💌

Crunching the Numbers!Sandbox is currently trading at 0.65, which is down by 6.29% in the past 24 hours. The good news is that the coin seems to be finding some support at the 0.5 Fibonacci level in the 4-hour timeframe. This could be a sign that the price won't drop much further in the short term. However, there is some resistance to watch out for at the upper Bollinger band of 0.71.
The Relative Strength Index (RSI) for SAND is currently at 47.5. This suggests that the coin is not oversold or overbought at the moment. However, the stochastic oscillators are at 28.5, which does suggest that the coin is currently oversold.
Looking at the MACD, which measures the momentum of the coin, it's currently at 0.0033. This is a bullish signal that suggests that the coin could see a potential uptrend in the near future.
The hourly Exponential Moving Average (EMA) 50 for SAND is at 0.64, meaning the coin is currently trading below its moving average. This could indicate a bearish trend for the currency. However, the On-Balance-Volume (OBV) is currently at 6B, suggesting that trading volume has increased over the past few hours. This could be a bullish signal for the coin.
The trading volume for SAND has decreased by 13.2% recently, which is something to keep an eye on. The 24-hour high for the coin is at 0.6882, while the 24-hour low is at 0.6251. This indicates that the coin has been quite volatile over the past day.
Overall, it seems that SAND is in a bit of a bearish trend right now. However, there are some positive indicators to keep in mind, such as the MACD and OBV. It's important to keep a close eye on the resistance levels and the trading volume to get a sense of where the coin is headed next.

SAND ANALYSIS (ROAD MAP) (12H)Hi, dear traders. how are you ? Today we have a viewpoint to BUY/SELL the ICP symbol.
For risk management, please don't forget stop loss and capital management
When we reach the first target, save some profit and then change the stop to entry
Comment if you have any questions
Thank You

SANDBOX ⌛🦜 Needs to Break the 70c 🏴☠️☠SANDBOX is my preferred Metaverse crypto project and it is time for an update.
As always SANDBOX has 'something new cooking' :
Sandbox is Launching Limited-Edition Gordon Ramsay Web3 Avatars on March 15th
The 2,333 avatars are expected to come in two waves and will grant exclusive access to “exclusive experiences” on the platform. The partnership between the Sandbox and ITV’s Hell’s Kitchen was initially revealed in August 2022.
Now off to the chart:
0,70 breakout would clear the way for a rise to 1.36 target, where the next resistance lies.
0.59 is support we might need to retest but not necessarily.
Overall, great project and always looking for Long positions here as I see potential for 5-12$ in the next run.
one Love,
the FXPROFESSOR

Buying these crypto for the next bull run(ZEC,FIL,SAND,MANA,XTZ)We are approaching very interesting entry points regarding these coins. We have confirmation entries in some of them and some risky entries in others. Let me know what do you think?

SAND shortSAND broke trough the ascending trendline. Asset broke trough the support level. Bearish movement to support level at 0.491 is possible.

Sandbox ($SAND) - must reclaim Feb openFebruary open (red line) is a must reclaim for me at this point to push any higher. It was also a significant s/r price point back from June '22 - reclaim it and targets above (T's)
I am personally leaning towards trading at the DCP level around .57 cents again in the short-term - it's a breakout origin and also in line the the 618 fib of this overall rally since yearly open.
57 cents for me is a macro must hold, below it and we just continue the accumulation phase down to the lows imo.
Would provide a great opportunity though if another leg comes thereafter - I doubt it would trade there long if this is still macro bullish.
Trade safe!
