ETH/USDT – Weekly Chart Analysis !! ETH/USDT – Weekly Chart Analysis
ETH is testing a major historical resistance between $3,700 – $4,000 (highlighted green zone).
A clean breakout above this level could push price toward the next key resistance at ~$4,660.
Previous accumulation zone around $2,400 – $2,800 (yellow box) now acts as strong support.
Long-term floor at $1,420 and $1,025, though currently far below.
Bullish Breakout Potential: If ETH sustains above the green resistance, it may retest $4,660+.
A failure to break above $4K could lead to a healthy pullback toward the yellow zone (~$2,800).
Stay updated and manage your risk accordingly.
DYOR | NFA
Sanders

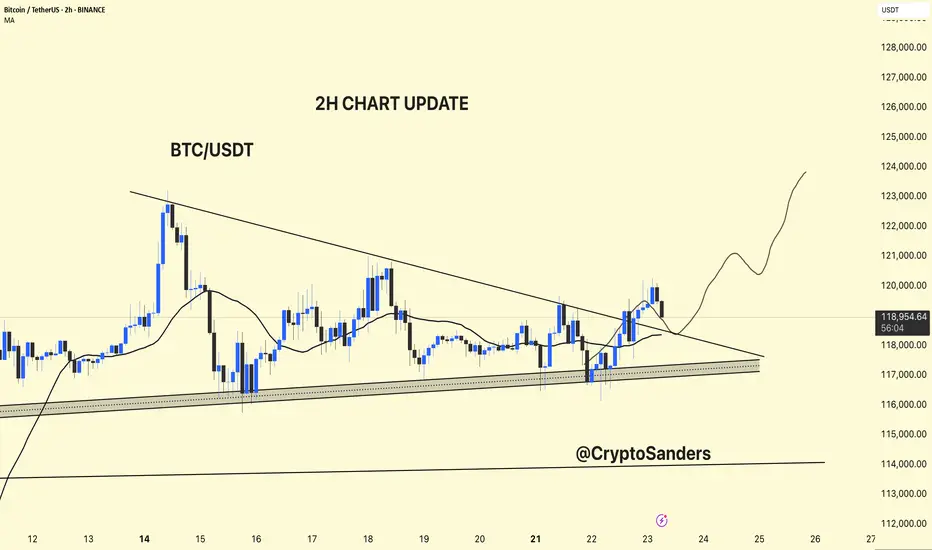
BTC/USDT – 2H Chart Update!!BTC/USDT – 2H Chart Update
Breakout Confirmed:
BTC has broken above the descending trendline but is currently facing resistance at around $ 119,500.
Support Zone:
Strong ascending support between $ 117,000 and $ 118,000 remains intact.
Moving Average:
Price is currently testing the 2H MA (~$118.3). Holding above this could confirm bullish continuation.
Outlook:
If BTC holds above $ 118,000, a move toward $ 123,000–$ 125,000 is likely.
Failure to hold may retest $117K support.
Bias: Short-term bullish unless price breaks below ascending trendline.
Thanks for your support!
DYOR. NFA
BTC/USDT 4H Chart Update –BTC/USDT 4H Chart Update –
After a strong rejection from the $110K+ zone, Bitcoin is now retesting a critical trendline support on the 4-hour chart.
Key Highlights:
Price dropped sharply to $103K, almost tagging the key ascending support zone.
The previous breakout from the descending trendline is now being retested, which is a classic bullish retest pattern.
If bulls defend this region successfully, expect a potential bounce towards $108K–$ 114 K.
However, a clean breakdown below $102K would shift short-term momentum bearish.
Eyes on this zone. High-probability decision area.
Watch for reaction candles and volume spikes to confirm the next move.
Thanks for your support!
DYOR. NFA

ETH/USDT 4HOUR CHART UPDATE !!ETH/USDT – 4H Chart Update
Ethereum is trading near an ascending channel's upper boundary, around the $2,790–$2,800 area. This level has historically acted as strong resistance, and we are seeing early signs of price hesitation.
ETH is testing the top of the channel. Rejection from this area could lead to a reversal towards the lower channel trendline near $2,450–2,500.
First Support: $2,600–2,620 (25MA and 100MA area).
Deep Support: $2,450 (Channel Bottom).
Strong Demand Area Below: $2,050–$2,150 (highlighted yellow box).
Moving Averages:
The 25MA (black) and 100MA (purple) are currently bullishly aligned.
Thanks for your support!
DYOR. NFA

BTC/USDT 1DAY CHART UPDATE !!Bitcoin displays a classic “cup and handle” structure on the daily timeframe – a historically bullish continuation pattern. The price has successfully broken above the neckline (~$107,000), indicating that bullish momentum is underway.
Thanks for your support!
DYOR. NFA

BTC/USDT CHART UPDATE !!Chart Pattern: Inverted Head and Shoulders (iH&S)
The chart shows a classic reversal pattern of the head and shoulders formation.
Left Shoulder: Late January 2025
Head: April 2025
Right Shoulder: Potentially forming near current levels (~$100K–$102K)
This bullish reversal pattern often leads to a strong bounce if the neckline is respected.
Support Zones:
$98,000 – $100,000: 50 EMA (red) and retest of the area near the neckline
$94,500 – $95,000: 200 EMA (green), last resort support
Resistance Levels:
$108,000 (horizontal neckline resistance)
$112,000 and $125,000 (bullish breakout targets)
Scenario Outlook
Bullish Case: If BTC maintains the $100K area and breaks above $108K with volume → rally towards $115K–$125 K.
Bearish Case: Breakdown below $94K invalidates the iH&S structure.
Thanks for your support!
DYOR. NFA

BTC/USDT Chart Analysis.
BTC has been in an uptrend since early April 2025, breaking above a strong horizontal resistance line (visible in the chart).
However, we can now observe a descending channel (falling wedge) after the peak, indicating a potential pullback.
Support Levels:
The price has tested the 50-day SMA (red) and is approaching the 200-day SMA (green), which is a strong dynamic support (around $94,740–$98,000).
Horizontal support lines are around the $103,000 and $100,000 levels, acting as immediate support.
Price Pattern:
The pattern resembles a bullish flag or descending wedge, suggesting a possible continuation of the previous upward move if a breakout occurs.
Before a bullish reversal, a retest of support levels (highlighted in the blue circle) near the moving averages is possible.
Future Path (as drawn on the chart):
Possible pullback to around $100,000–$98,000 levels.
Reversal and breakout are expected to be between $112,000 and $115,000 initially, and possibly higher to $125,000–$130,000.
Volume & Momentum:
No volume data is shown, but the price action indicates a correction with weakening momentum.
Trend lines are sloping upwards, indicating underlying strength despite the correction.
Trade Setup Based on This Analysis
Entry Zone: Around $100,000–$98,000 (if price tests support and forms reversal patterns like a bullish engulfing or hammer).
Stop-Loss: Below $94,000 (below the 200 SMA and the trendline support).
Short-Term Target: $112,000–$115,000.
Mid-Term Target: $125,000–$130,000.
Risk Considerations
If BTC breaks below the 200 SMA and horizontal support near $94,000, the trend may weaken.
Thanks for your support!
DYOR. NFA

Bitcoin (BTC/USDT) – Daily Chart Analysis. Bitcoin (BTC/USDT) – Daily Chart Analysis
Bitcoin has tested the overhead resistance and is currently retracing towards the $104k–$105k support area.
Moving Average (MA 25):
The price is slightly above the moving average, indicating that the medium-term trend is still bullish but faces resistance.
Pattern Formation:
There is a clear breakout from the inverted “V” pattern, and now the price appears to be retesting the breakout zone.
Scenario:
If BTC maintains support at ~$105k and bounces off again, a potential push towards $112k—$115k can be seen.
If the support fails, a deeper pullback towards $100k or below could occur.
Thanks for your support!
DYOR. NFA

ETH/USDT 4HOUR CHART UPDATE !! ETH/USDT Chart Analysis
Ascending channel: Price is moving within a rising channel, with higher highs and higher lows, indicating bullish momentum.
Strong support area (~$2,600): Price repeatedly bounced off this level, reinforcing it as a key support zone.
Immediate resistance: Price is testing the upper boundary of the channel around $2,800–$2,850.
The 50-day MA (red) and 200-day MA (green) are trending upward, supporting the bullish structure.
A breakout above the channel’s resistance (above $2,800) could trigger a move toward $3,000–$3,200.
Failure at resistance might lead to a retest of support around $2,600, and a break below that could send the price back to the yellow zone (~$2,200).
Conclusion:
Bullish above $2,600, especially if $2,800–$2,850 is cleared with volume.
Bearish risk if price breaks below the channel, especially under $2,600.
Thanks for your support!
DYOR. NFA

#SAND/USDT#SAND
The price is moving within a descending channel on the 1-hour frame and is expected to break and continue upward.
We have a trend to stabilize above the 100 moving average once again.
We have a downtrend on the RSI indicator that supports the upward move with a breakout.
We have a support area at the lower boundary of the channel at 0.2790, which acts as strong support from which the price can rebound.
Entry price: 0.2828
First target: 0.2890
Second target: 0.2971
Third target: 0.3048

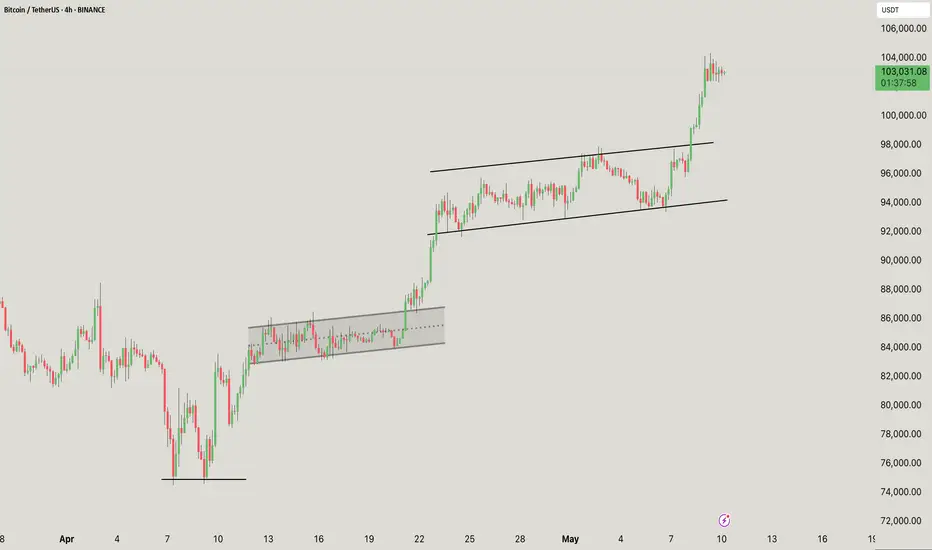
BTC/USDT Analysis – 4H Chart
This chart shows classic bullish continuation through ascending channels and consolidation breakouts:
A solid double-bottom structure was formed in early April
Marked the start of the uptrend
First consolidation box (~$90K–$93K)
Horizontal accumulation (highlighted gray box)
Resulted in a clean breakout and continuation
Rising channel (~$94K–$99K)
Rising Mid-trend consolidation wedge/channel
Price respected both trendlines
Eventually broke out to the upside → Strong momentum candle followed
Current Status (~$103K)
Price has broken above the rising channel
Now forming a new mini flag or consolidation at the top
Momentum is still in favor of the bulls
If you found this analysis helpful, hit the Like button and share your thoughts or questions in the comments below. Your feedback matters!
Thanks for your support!
DYOR. NFA
ETH/USDT – Weekly Chart AnalysisETH/USDT Unique Technical Structure: Large Accumulation + Recovery Setup
This chart shows Ethereum’s price action over the past few years, highlighting key support and resistance areas. A strong visual signal (blue arrow) indicates bullish potential.
Chart Pattern Implications:
The pattern on this chart is not a classical shape (e.g., cup and handle), but it does show a Wyckoff-style accumulation phase followed by a failed breakout and reaccumulation:
Strong base formed between $1,000-$1,400
A series of lower highs and a range-bound structure after the 2022 peak
The bullish projection illustrated by the arrows shows a potential recovery towards the ATH again
This setup suggests that Ethereum is at a critical juncture – either:
It retests current support and begins a new uptrend.
Or it risks another test of the $1,400-$1,050 range before a breakout.
Risk-Reward: Current levels ($1,796) offer attractive long-term entries if you’re bullish.
Caution Zone: If ETH breaks below $1,400 with volume, $1,050 becomes the next key defense.
If you found this analysis helpful, hit the Like button and share your thoughts or questions in the comments below. Your feedback matters!
Thanks for your support!
DYOR. NFA

BTC/USDT – Weekly Chart Analysis (Long-Term View)BTC/USDT Chart Pattern: Multi-Year Cup and Handle Formation
The chart shows a textbook “cup and handle” formation, a highly reliable bullish continuation pattern. This pattern has played out over several years (2021-2025), indicating long-term accumulation and a breakout attempt.
Cup Phase:
Extended from mid-2021 to early 2024.
Formed a deep and rounded base, often indicating institutional accumulation.
The rounded lows reflect a gradual sentiment recovery from the 2022-2023 bear market.
Handle Phase:
A short-term consolidation after moving above the $70,000-$74,000 resistance area.
Price action pulled back marginally after hitting $110,000, forming higher lows near $85,000.
The structure resembles a bull flag or pennant, which is usually seen before the next upward move.
Key Support and Resistance Areas:
Key Support $70,000–$74,000. Previous resistance turned into support
Psychological Support $85,000 Local Retracement Low
Immediate Resistance $100,000–$110,000 Near ATH, selling pressure area
Long-term Target $130,000+ Measured move from cup pattern
Volume: Volume was high during the breakout from late 2024 to early 2025, which validates the breakout from the cup resistance area.
If BTC breaks above $100,000–$110,000 with strong volumes, we can expect continuation towards:
$130,000 (short-term target)
$150,000–$180,000 (extension based on pattern symmetry)
Bearish Risks:
Failure to hold $85,000 could lead to a retest of the $70K support area.
Sustained breakdown below $70K would invalidate the bullish pattern, but this seems unlikely given the strong fundamentals and macro structure.
If you found this analysis helpful, hit the Like button and share your thoughts or questions in the comments below. Your feedback matters!
Thanks for your support!
DYOR. NFA

BTC/USDT Technical Analysis. Current Price: ~$94,600
BTC has cleanly broken above the descending trendline resistance, a structure that capped price since mid-February.
This breakout was accompanied by a surge in volume and momentum — a strong bullish sign.
Golden Cross Area
A key technical confluence occurred where the 50-day MA (red) and the 200-day MA (green) were tested simultaneously, marked by the blue circle.
Price moved sharply upward after reclaiming both MAs, suggesting increased buying confidence — a textbook golden cross behavior, even if not a perfect cross yet.
Support & Resistance Flip
Previous resistance at the GETTEX:92K —$93K zone (highlighted in yellow) has now become support.
As long as BTC holds this zone, it suggests healthy consolidation and potential for a continued move up.
Trend Indicators:
50-Day MA (Red): Now curving upward — short-term bullish momentum is building.
200-Day MA (Green): Flattening and starting to rise, showing early signs of a shift in long-term trend direction.
The price is currently above both MAs, which is a key bullish condition.
Key Levels to Watch:
Immediate Resistance: $96,000–$97,500
Major Psychological Barrier: $100,000
Support Zone: $91,500–$92,500
Stronger Support (if broken): $84,000–$85,000 near the MAs
If the price continues to hold above the breakout zone and consolidates well, the next upside target will be $ 100 K.
Failing to hold the GETTEX:92K zone could invite a pullback toward the MAs around $85K — a zone where bulls may step in again.
Final Thoughts:
BTC is showing signs of renewed bullish momentum after breaking key resistance and reclaiming critical MAs. However, confirmation through consolidation and volume is essential to sustain higher levels.
Structure remains bullish unless we see a breakdown below ~$85K with volume.
DYOR. NFA. Stay sharp.

Bitcoin is currently trading around 85,269.35 USDT. Bitcoin is currently trading around 85,269.35 USDT.
Support Zone: A crucial support zone marked in green suggests strong buying interest between 80,000 and 81,000 USDT.
Resistance: The upper trend line indicates resistance; if Bitcoin can break it, it could target levels close to 88,000 USDT.
Bullish Case: A breakout above the upper trend line could lead to an upward rally towards 88,000 USDT or above.
Bearish Case: If the price breaks below the support zone, a downward move towards 75,000 USDT can be expected.
Monitor the trade closely to see how it reacts around these crucial levels. Adjust your strategy accordingly based on the price action. If you have further questions or need analysis on specific indicators, feel free to ask!
If you found this analysis helpful, hit the Like button and share your thoughts or questions in the comments below. Your feedback matters!
Thanks for your support!
DYOR. NFA

Based on the BTC/USDT 4-hour chart:Current Price Levels: Bitcoin is currently trading around 85,269.35 USDT.
Support and Resistance:
Support Zones: A crucial support zone marked in green suggests strong buying interest between 80,000 and 81,000 USDT.
Resistance: The upper trend line indicates resistance; if Bitcoin can break it, it could target levels close to 88,000 USDT.
Bullish Case: A breakout above the upper trend line could lead to an upward rally towards 88,000 USDT or above.
Bearish Case: If the price breaks below the support zone, a downward move toward 75,000 USDT can be expected.
Monitor the trade closely to see how it reacts around these crucial levels. Based on the price action, adjust your strategy accordingly. Feel free to ask if you have further questions or need analysis on specific indicators!
If you found this analysis helpful, hit the Like button and share your thoughts or questions in the comments below. Your feedback matters!
Thanks for your support!
DYOR. NFA

BTC/USDT 1DAY CHART UPDATE !!A downward trendline connecting the recent high points indicates bearish pressure.
A horizontal support level around 77,500 USDT shows where the price has struggled to drop.
Current Price:
As of your chart's timestamp, BTC is trading at approximately 79,883.75 USDT.
Potential Movement:
If the price can break above the descending trendline and stay above the support level, there could be potential upward momentum. The upward arrow suggests a bullish outlook.
Key Levels to Watch:
Resistance: Look for resistance at trendline breaks and the next significant levels above the current price (e.g., 82,500 USDT).
Support: The 77,500 USDT level is crucial; a drop below it could signal further downward movement.
If you found this analysis helpful, hit the Like button and share your thoughts or questions in the comments below. Your feedback matters!
Thanks for your support!
DYOR. NFA

BTC/USDT 4H Chart Analysis !!Current Price: $83,809
The chart shows a symmetrical triangle pattern, indicating a possible breakout soon.
Upper Resistance: Around $86,000
Lower Support: Around $82,000
Key Support Levels: $79,183 and $78,424
Bullish Breakout (Green Arrow)
If BTC breaks above the resistance trendline (~$86K), it could see a strong move towards $90K-$92K.
Confirmation would be a candle close above $86K with volume.
Bearish Breakdown (Red Arrow)
If BTC loses the support trendline (~ GETTEX:82K ), it could drop towards $79K-$78K.
The candle closing below GETTEX:82K could fuel further selling.
Market Sentiment:
Fear & Greed Index: 28 (Fear) – Investors remain cautious.
The direction of the breakout will depend on market sentiment and volume.
If you found this analysis helpful, hit the Like button and share your thoughts or questions in the comments below. Your feedback matters!
Thanks for your support!
DYOR. NFA

Bitcoin (BTC) on 4-hour timeframe. Current Price: Bitcoin is currently trading around $81,830.
Trend Line: There is a downward trend line indicating bearish sentiment over the observed period.
Support Level: There is a green support area around $78,424 to $80,000. Bitcoin needs to stay above this level to avoid further declines.
Recent Activity: After the decline, Bitcoin has attempted to stabilize near the support but has not made any significant upward move.
Considerations
If the price breaks below the support area, the bearish trend may continue.
Conversely, if Bitcoin breaks above the trend line, it may signal a reversal and potential upward movement.
Feel free to ask for further analysis or specific technical indicators!
If you found this analysis helpful, hit the Like button and share your thoughts or questions in the comments below. Your feedback matters!
Thanks for your support!
DYOR. NFA

BTC/USDT 1DAY CHART UPDATE !!A downward trend line indicates resistance; the price is struggling to move above this line.
The green line at around 78,000 to 79,000 USDT is a crucial support level, providing a base for the price movement.
Recent fluctuations: The price shows a recent bounce, indicating a potential bullish reversal if it breaks the trend line.
Future forecast: The upward arrow indicates a bullish outlook; if the upward movement continues, then targets around 102,500 to 110,000 USDT can possibly be set.
If you have specific questions or need further analysis on certain aspects, feel free to ask!
If you found this analysis helpful, hit the Like button and share your thoughts or questions in the comments below. Your feedback matters!
Thanks for your support!
DYOR. NFA

BTC/USDT 4-Hour Chart Analysis. The chart shows Bitcoin (BTC) previously trading within an ascending channel (marked by two parallel black lines).
Recently, BTC broke below this channel, signaling a bearish shift in momentum.
BTC is currently attempting to retest the lower boundary of the broken channel.
This is critical—if BTC fails to reclaim the channel, it could confirm a downtrend continuation.
The chart suggests a possible short-term bounce toward resistance around $85,000-$86,000.
However, after this retest, BTC is expected to drop sharply toward $79,000 - $78,400 (green support zone).
$79,059 & $78,424 are identified as key support zones.
If BTC reaches these levels and holds, a rebound is possible.
If broken, BTC could see a deeper decline toward lower levels.
Breakout invalidation: If BTC breaks above $86,000 with strong volume, it could regain bullish momentum and move higher.
If you found this analysis helpful, hit the Like button and share your thoughts or questions in the comments below. Your feedback matters!
Thanks for your support!
DYOR. NFA

Ethereum (ETH/USDT) 1D Chart Update ETH is still trading inside a descending channel, showing signs of a possible reversal. The price is bouncing off support levels around $1,750-$1,830, with a possible retest of higher resistance levels. The 50-day moving average (red line) is acting as a dynamic resistance above the price.
Bullish scenario: ETH needs to sustain above $1,830 to confirm a short-term correction. If ETH breaks the $2,200-$2,400 resistance zone, a rally toward $2,800-$3,000 could follow.
Bearish scenario: Rejection at the resistance could push ETH back towards $1,830 and possibly $1,750. A loss of $1,750 could trigger a further decline towards $1,600.
Resistance: $2,200, $2,400, $2,800
Support: $1,830, $1,750, $1,600
If you found this analysis helpful, hit the Like button and share your thoughts or questions in the comments below. Your feedback matters!
Thanks for your support!
DYOR. NFA

Bitcoin (BTC/USDT) 4H Chart Update. BTC has broken out of a descending triangle, leading to a strong upside.
Currently trading inside an ascending channel, facing resistance near $90,000.
Bullish Scenario:
If BTC holds above $87,000-$88,000, a continuation toward $92,000-$95,000 is possible.
A strong breakout from this channel could lead to an attempt at $100,000.
Bearish Scenario:
A rejection at the channel's top may push BTC back to the $84,000-$85,000 support level.
If the support breaks, BTC could drop to $79,000-$78,400
Resistance: $90,000, $92,000, $95,000
Support: $85,000, $84,000, $79,000
If you found this analysis helpful, hit the Like button and share your thoughts or questions in the comments below. Your feedback matters!
Thanks for your support!
DYOR. NFA
