S&P 500 Index See More Gains In 2022The market is likely to see a bit of a pullback continue, which is healthy in what has been a very strong uptrend anyway.
I have no interest in shorting this market, and if it falls apart, I think that January will simply end up being at a great longer-term buying opportunity as traders will look to be putting on risk to kick off the new year as per usual.
The S&P 500 initially tried to rally on Wednesday to reach towards the 4660 level again. This is an area that has been resistance over the last couple of days, and it certainly came into the picture on Wednesday. We pulled back to form a bit of an inverted hammer on the monthly chart, and close at the very bottom of the range. This is a very difficult-looking candle, so if we break down below the bottom of the candlestick, it is very likely that we go looking towards the uptrend line underneath.
That uptrend line should be very important, as it has been supportive for quite some time. The 4500 level is right around the same area, so with that being the case I think it is only a matter of time before value hunters will come back into the picture. That being said, the real catalyst for the move is probably going to be a scenario on Friday after the jobs number. Between now and then, I would anticipate a lot of noisy behavior, but it certainly looks as if we are still favoring the downside. That being said, when you look at this chart, you can see that we are in a bit of a negative move, but when looked at through the prism of the longer term, it is not that big of a deal.
That is the thing about pullbacks in an uptrend: the pullbacks feel much worse than they really are. We are only a few percent off from the highs, so a little bit of perspective is probably necessary. Keep in mind that Friday will cause a lot of noise, but Friday sessions end up being somewhat uneventful by the time they close most of the time, as we go back and forth only to end up somewhat unchanged. The initial knee-jerk reaction is almost always turned around so it is very likely that the market will continue to be very noisy. The market will continue to be one that you need to be cautious about putting too much money in, especially between now and the jobs number. The market is likely to see a bit of a pullback continue, which is healthy in what has been a very strong uptrend anyway.
The S&P 500 bounced a bit from the 50-day EMA during a very volatile session on Tuesday. Jerome Powell shook the markets up by suggesting that inflation was “no longer transitory.” In other words, Capt. Obvious has spoken. That being said, he is about 18 months behind the curve, which is typical for central banks. As he worries about inflation, it is very likely that we are starting to peak. Take a look around you; we are seeing the word inflation everywhere, and it has suddenly become a major talking point. That typically means that we are closer to the end than the beginning. Think of Bitcoin a few years ago. Think about the US dollar and when models were demanding to be paid in euros about 12 years ago. It is normally when you hear the most hysterical wailing that you are towards the end of something.
Looking at this chart, we have slammed into the 50-day EMA which quite often offers a bit of support, so it is worth paying attention to. I think given enough time, we will probably see this market try to find buyers, but it may be closer to the 4500 level. After that, we have the uptrend line that comes into the picture as well. The S&P 500 typically has the “Santa Claus rally” at the end of the year were money managers try to make up for a lack of returns. After all, they have people that they need to pay attention to in the form of clients, who will most certainly demand some type of return. This is a well-known phenomenon, and therefore that is why December is one of the most profitable months for the S&P 500 from a historical perspective.
I have no interest in shorting this market, and if it falls apart, I think that January will simply end up being at a great longer-term buying opportunity as traders will look to be putting on risk to kick off the new year as per usual. While I would not necessarily be a buyer right here, I am waiting to see if we can get some type of stability to get involved. Keep in mind that the jobs number comes out on Friday as well.
S&P 500 can be a profitable investment option. S&P 500 rate equal to 4537.02 on 02/12/2021... With a Mid-Hold investment, the revenue is expected to be around 7.29% - 13.00% grow in 2022
Buy & Hold | +ROI
Investment Suggestion: MID-TERM
Holding Duration : Min 6 months
Probability: 63%
INVT Fundamental Report: POSITIVE
INVT Technical Report: POSITIVE
INVT News Report: POSITIVE
- SELLING PRESSURE PRICE: 4560.00
- FAIR BUYING PRICE: 4400.00 - 4500.00
It’s important to keep in mind that cryptocurrency markets are extremely volatile, making it difficult to accurately predict what a coin’s price will be in a few hours or a few days and even harder to give long-term estimates. As such, analysts and online forecasting sites can get their predictions wrong. We recommend that you always do your own research and consider the latest market trends, news, technical and fundamental analysis , and expert opinion before making any investment decisions. Be patient and look long term wisely and never invest more than you can afford to lose.
Trading & Investing both are the master of RISK.
Please comment, like and follow if it was helpful for you.
Thank you for your time.
Have a profitable day.
| Review and analysis by Samadi.Finance |
Sandp500

Market tops after yield compressionThis is a chart showing treasury yields, color coded by duration (yellow is the 1 year, dark blue is the 30 year), with the $SPX in the lower frame. Each red line shows a major market top and how they relate to yield compression followed by inversion. It looks to me like shorter term yields always rise vs longer term yields quite awhile before bear markets occur (in the past its been months or years before). It also looks like short term yields are rising abnormally quickly this time.
Yield inversion is a huge red flag that a bear market is coming and I wonder how long we have this time before that happens.

Feb 24, 22 S&P 500 - 140 pt Take ProfitCrazy world we live in - who would think in 2022 that a country would actually invade another country forcefully.
With that going on, the index crashed obviously, actually all of them did. I put my order in a few days ago hoping price would get down to 4200. I put my TP there but price action almost hit 4100. I'm not complaining though - from 4340 to 4200 is still a decent profit.
Once Biden made an address a few hours ago, price action reversed and started to come up. I decided to stay out of the market just in case price action went wonky. I will re-asses the markets and keep you all updated tomorrow.
From my and my family to all the families that are hurting over in Ukraine/Russia, we wish you all the best to stay safe and we pray for a speedy end to this invasion.
HEIKO

S&P500 Head and ShouldersThis is not a trade idea, more of a market observation. S&P500 head and shoulders speaks volumes. Markets are jittery at the moment (to say the least) with a major sell-off occurring across risk assets and currencies. Markets are over extended and volatile. Not a time to be actively trading imo, sometimes its best to sit back and wait for the dust to settle.

Feb 21, 2022 S&P500 Sell-The Big One?Could this be it? The BIG one we have all been waiting for? At least I have been waiting for it. Has ALL the forces come together in the perfect storm to have the S&P drop 30% or 40%??
I know it's going to happen, just don't know when. But so far my Sell order is doing well.
Next up is 4200 level - this is a good psycholgical level and will be a decent support level - if however price action smashes through this level and keeps on going down, who knows when it's going to stop.
Every 100 points will be a bit of a support level and of course 4000 even will be a major support.
Anyway, my plan is to put in another Sell Order at around 4180 if price action crashes through the 4200 level. I will keep you posted.
Stay safe.
HEIKO

Feb 20, 2022 S&P500 Sell Order I don't know what's going to happen this week in Europe, but I know one thing - tensions are high!! When tensions are high, investors get spooked. When investors get spooked, they get out of the S and P and put their money into Gold. Right now Gold is up and the S and P is down.
I got into a Sell Order at 4340 and we shall see what happens this week. I think it could test 4300 for sure, but I'm moreso thinking 4200. Next month I'm looking at below 4000 once the Fed decides if they will boost rates up a quarter point as everyone is expecting....or half a point which is when the S and P should fall nicely :-)
I will keep you updated as the week progresses.
HEIKO

S&P 500 (SPX) more downside incoming over the next weeks? #SPX For the S&P 500 the right shoulder of a possible bearish SKS has started to form. Crucial support is at ≈ $4200. Should we break below, it would open up the possibility of a downward correction. Relevant support levels are at $3818 (0.382 Fib. retracement) and at $3507 (0.5 Fib. retracement) which could act as possible technical safety nets in which we could bounce off upwards. As always we are heavily dependent on macro factors such as Federal reserve´s decision to hike interest rates in the upcoming months and the conflict in Eastern Europe! Not financial advice!

SPY Bearish Monthly MACD CrossIt appears we might see a bearish cross on the monthly MACD for SPY.
The histogram reached its highest level back in Jun-Aug 2021. The histogram measures the spread between the two EMAs.
We might conclude that we've never seen the market rally as much as this in such a short amount of time. The Covid recovery was truly unprecedented.
The QQQ monthly MACD has already crossed bearish. Might be a leading indicator of what's to come for SPY.

S&P 500 long term trend analysis - Where to from here?There is no doubt that the S&P 500 is expensive on almost any valuation metric. If one "zooms out" a few things become overwhelmingly apparent. The first is that pre-great depression and dot.com bubble, the index was well above its average trend line as it breaks into the blue shaded area. Currently the index has broken into the blue shaded area whilst testing the support of the upper green band.
During 1955 and 1973 the index continued to rise whilst the upper green band acted as a resistance line. The question is, could history repeat itself whereby the index continues to rally along the upper green band with minor retracements along the way or will it continue to rise towards the upper blue band and thus perpetuating the feeling that the index is in bubble territory (extreme greed).
if interest rates remain relatively low compared to historical standards and given the quantity of money in the system (QE) could the index remain more expensive than we are typically used to?
Please like and follow. Please also share your views on the trading ideas and whether or not you find them to be of any value to you as a trader.
Please note, this idea is shared for educational and discussion purposes only and should not result in speculative investment decisions in any asset class.

SAND/USDT 12 HOUR UPDATEWelcome to this quick SAND/USDT analysis.
I have tried my best to bring the best possible outcome to this chart.
Reason of trade:- SAND/USDT Triangle pattern create to buy the dip and green zone
Entry:- buy green zone
Traget:- 75% to 100%
Stop loss:-Greenline downside candle close
Remember:-This is not a piece of financial advice. All investment made by me is under my own risk and I am held responsible for my own profit and losses. So, do your own research before investing in this trade.
Happy trading.
Sorry for my English it is not my native language
Do hit the like button if you like it and share your charts in the comments section.

SHORT S&P500A financial crisis is a term that covers various realities whose common denominator is an abrupt fall in dematerialized economic activity. Currency crises, banking crises and stock market crises are thus financial crises.

SP500: Market Crash Incoming?! Are We In a Bubble?We are now at a critical point in the markets since the Wallstreet and other commodities hit the ATH with an outstanding performance. This is how I see the S&P500 Index for the upcoming weeks and a huge crash is possible in the markets. If this scenario plays out this %32 drop is coming after the %100 rally in SPX and 3K is the main support for this crash IMO.

Is the S&P 500 About to Crash? It's getting close....The holy grail of trading is being able to confirm trend reversals. Using a proprietary indicator, I'm able to confirm, with a backtested over 90% accuracy a major trend direction change in the S&P 500.
The chart
On the left you have 3M candles. This is best for confirm a full blown bearish trend reversal as occurred in 2000 and 2008.
In brief, if on April 1st, price is BELOW the green line, there's a 90% chance price will not only continue down but that the longest bull trend in market history has come to an end. So watch that line and that date.
On the right you can see the 1M candle in the top right.
It's already breached it's support. If it closes on February 1st below the green line, price is likely to keep going down.
On the bottom right you can see the 1W candle. It's already clearly in a trend reversal. 1W is not long enough to predict overall market trends.
Time will tell, but my indicator, I call the Tenoris Indicator, latin for 'trend' is highly accurate back tested going back over 40 years. If you're interested in it LMK.

Predicting and Confirming Real Market Crashes on the S&P 500The holy grail of stock investing , IMO, is predicting and or even confirming a market crash, a trend change from bullish to bearish that's going to last for an extended period of time. I'm defining a 'market crash' as a trend change from bullish to bearish or bearish to bullish.
How do we know when a pullback or correction is just that and when it's the start of a long term bear market?
I'm old enough to vividly remember and having been impacted financially by the crashes and bear markets of approximately 2000 and 2008. So I became obsessed with creating an indicator that could weed out pullbacks, fake outs, and minor corrections and confirm a real bear market. Here's my best effort after years of work.
The arrows on the chart would have appeared when the candle they are above closed. I'm using a 91D candle for starters. This gives the best results. And several other proprietary methods under the hood of my indicator. However, you can see that it over the last 40 years, only indicated two bear markets....and both correctly. For the S&P 500 to confirm another bear market, major trend reversal, it will need to drop under the red dotted line for an extended period of time...then you'll know it's likely headed further down.
Curious what other think and how you determine if the stock market is at the beginning of a real trend change.

Repeat of the 2000 dot-com bubble? Some dubious speculation...I took the bar pattern of the 2000 bubble pop and subsequent bear market and copied it to the present day to see what it would look like.
I did adjust the shape a little to make the H&S look more symmetrical, just like the H&S in 2000.
You can see it fits rather well.
- The RSI is topping and expected to trend lower.
- The bottom of the breakdown lines up with the market top in 2000 and 2008.
- It bottoms at the lower support of the megaphone pattern.
- Finally, the length of the move is proportional to the one in 2000.
Despite how 'perfectly' it all fits, extrapolating 2 years out to find the bottom is dubious speculation. It goes without saying, but it most likely will not go down like this.
Disclaimer: I am not bearish nor am I bullish. I don't hold a macro outlook. I simply react to what the market tells me. This was just a fun hypothetical.

Long on US500 on 15...Go long on us500, around area of value, possible retest.. stop loss and take profit around zones shown by trade tool...


SPX Long TargetDYOR
Bull Case:
MACD : Bullish
Crossover
PRICE: Close above resistance level?
Volume keeps price moving up
Long target 4895
Thanks!!

S&P500
short for s & p in resistan zone
In :4559.9
SL:4584.2
TP:4498.1
after price down to 4525 get risk free .
(( always use STOP LOSS my friends ))


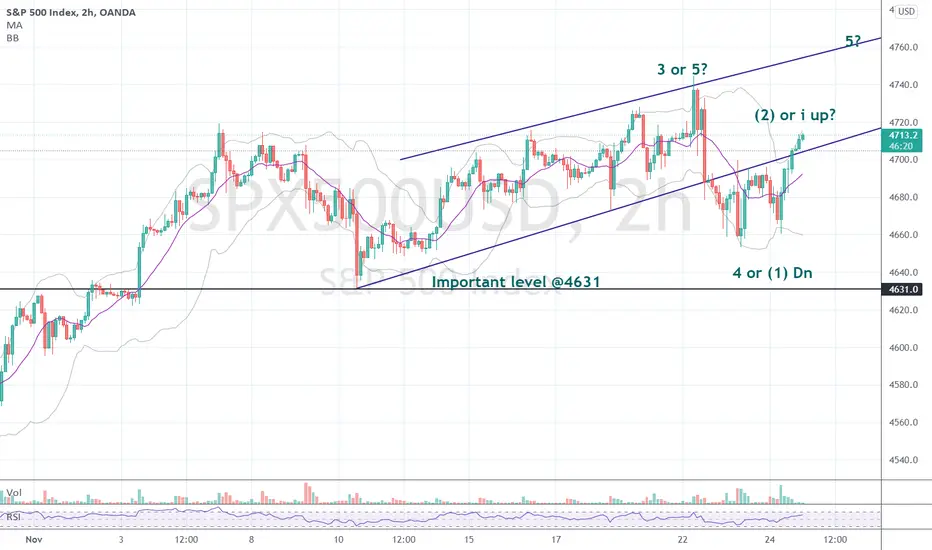
Seriously overbought. SnP 500. How long can it last? Take 2Long held trends tend to hold-up, well... long. I've labeled the chart with 2 of what I think are the most plausible EW count scenarios. It does allow to see where the risk and acceleration levels likely are. Only time will tell if the top is in, or if we are going still higher yet.
SPX/ S&P ShortMy idea, not an advice
S&P facing a downward trend, for a potential support after the recent all time high, before possibly making another all time high or a potential 'stock market crash' with all that high inflation data from the recent US CPI.
