US500 4229.4 SHORT IDEA + 0.86 % * PRICE ACTION & STRUCTUREHELLO EVERYONE
HOPE EVERYONE IS DOING GOOD HAVING A GOOD ONE IN THE MARKET THIS WEEK, HERE'S A LOOK AT THE US 500 INDEX FROM A 4H PERSPECTIVE. Will be looking for reversal patterns for this trading plan to be effective a break above of the resistance level changes the plan.
* follow your entry rules on entries
* significant moves with the bears change the plan.
lets see how it goes.
many stars must align with the plan before executing the trade, kindly follow your rules.
HAPPY TRADING EVERYONE & LET YOUR WINS RUN...
_________________________________________________________________________________________________________________________
ENTRY & SL - FOLLOW YOUR RULES
RISK-MANAGEMENT
PERIOD - SWING TRADE
__________________________________________________________________________________________________________________________
If this idea helps with your trading plan kindly leave a like definitely appreciate it.
Sandp500

S&P on the 15 minute. It's in a period of narrowing consolidation after retreating from the highs. At the moment it's testing the upper portion of the wedge. The bulls made some peaks on the way down that they will now have to work against on the way back up, but breaking out of the first one is the biggest step to achieving momentum.
I don't trade based on my predictions. I let the market tell me which way it's going then I try to hop on as the train is leaving.

S&P on the 4 hour.I don't have any predictions based off what I'm seeing. I think it will likely move higher, but if we start to make lower lows instead of higher ones then we will look to lower levels.

S&P500 Bearish for the next 2 weeks will fly soonIf you are familiar with gap
all gap has been touch is rejecting the price
which is the next move for the next 2weeks will be bearish, but price will fly soon

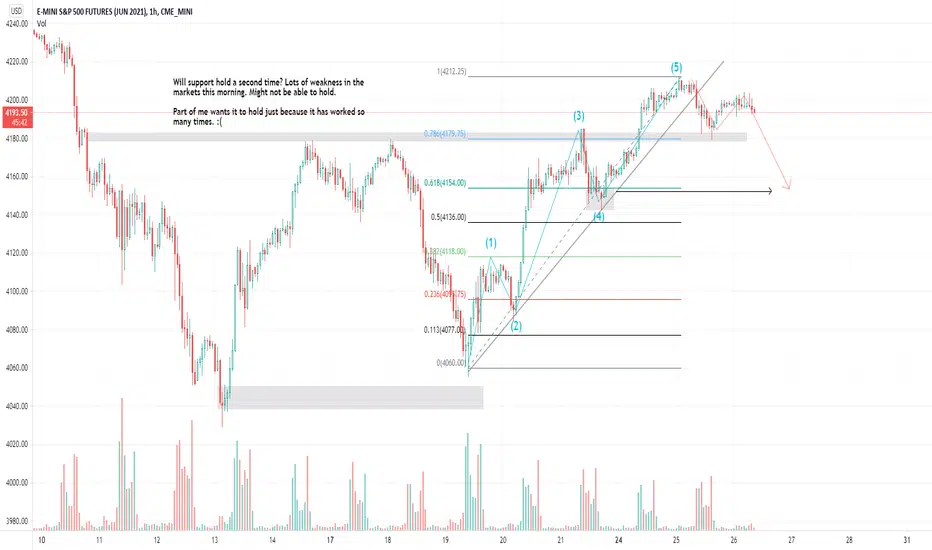
S&P short. Market showing weakness before open. The selling doesn't have to continue, but price has been showing relative weakness this morning, and is triggering our some sell short signals.
Let's see if we get any continuation or if/how the support/resistance areas effect the path of price.

Short S&P 500Hello everyone, one of my best analyzes. We are near the end of a cycle, it should end before 2027. The fibonacci retracement follows the crash of 1929, which is also the start of the uptrend. We can see that we have only exited the yellow channel twice. Once from 1997 to 2001 and again from December 2020 to today. The bullish trends inside the bullish channel end when the white support line is broken. The second bullish base lasts about 70% of the time of the first, if we project that the third bullish base should last around 6500 days. When we have been above the 2 years * 1.2 EMA there has been a decline each time, we are currently above that moving average. The RSI: We can see that every time we hit or cross the 77, it follows a decline. Crashes are preceded by a bearish divergence, there is currently an unconfirmed bearish divergence. The crashes lasted 2250 days and 3100 days, each time we returned to the previous level of fibonacci and the channel support. If this is repeated we can expect a drop of more than 35% from the current level.

Signal crashing. Just for fun. Keeping myself engaged.I am pitting two of my favorite signals against each other.
On one side, we have the downward sloping 20/50 sma’s.
The challenger: a semi robust reversal chart pattern.
The chart pattern isn’t a ‘perfect’ one, so I wouldn’t trade it regardless. Even if it does work. It’s ok to be picky.
———
Please kids don’t trade this way at home. Do a multi timeframe analysis on all of your trades. I’m just letting my inner child have some time with the charts.

$SPX - memeline shortMemeline supporting uptrend has broke
Backtest of underside of SR
Seems a good bet especially with growing inflation concerns
Close through the SR box would make me re-evaluate and likely close though!

ESM2021. Reversal crystal formed off .5 reaction.S&P looks like it will be reversing. By that I mean the recent bottom may have revealed itself.
Bulls will worry about the previous price consolidation that it will be encountering shortly, but there are a lot of good bullish elements to suggest that they will power through.
The dip and recovery at the .5 level on the fib two times in a row should be satisfying the longs as well as the profit takers. If things remain in balance (which can be a big 'if') we can predict that a further impulse is on the way.
I don't see much weakness in the market. You could use the story-telling method. People might not be certain that the stock market can continue bullishly with Biden instead of Trump. So far, this narrative has been disproven. Based solely on the evidence available from the chart it seems like a healthy bullish market.
My worst case scenario is that we see another low before the reversal.
If you are looking to buy and hold for long periods of time, like how the people with enormous holdings are doing, you would think what just happened in the markets is a gift from god, and you would probably be buying aggressively. I think that's exactly what created the reversal pattern.

$SPY SNP500 ELLIOTT WAVE ANALYSIS UPDATEDSeems like what I previously thought to be wave four was wrong, I do believe we are now currently in wave 4. Im watching for a bounce at 413.7-414.5 , this would complete the fourth wave and send us to the last leg in the rally. As of now my price target on spy is 426. A daily close under 410 would signify the start of the correction and the first leg of downward action on spy in my opinion. good luck to all

SAND looking good for a 10x LONG at $0.53I bought $50k SAND on spot at this level and sold at $0.061 for a nice gain on the last BTC dump. This is looking good to reenter on today's BTC dip. Coinbase listing is on the horizon.

Possible Ascending triangle? Not completely sure about this, but looking at the 1M chart, it looks like Apple is forming an ascending triangle. However, looking at the 1W chart, it begins to look like a head and shoulders pattern. Can anyone clarify?

SPY swing puts - the RSI bear storyPlease see notes on chart.
I bought 21 May 418 strike puts when SPY was over 422.30.
Strangely, the U.S. markets are flying high today while individual stocks are chopping around and/or still leaning bearish on 30 or 60m timeframes.
SPY weekly chart has been extended for so long that I am ignoring it for now and paying attention to the daily and 30m for context.

Spy Bouncing Off Long Term Trend ChannelSpy is currently bouncing off this long term trend channel. Going to have to see today and tomorrow's close to confirm if we continue this trend and stay within the channel.

S&P 500 Due A Breather?The S&P 500 continues to trend well and has been making use of the 20 and 50 simple moving
averages as support.
On April 1st 2021, price finally broke above $4000 which was anticipated to be a potential
strong level of resistance. Price broke through with ease, forming a linear move to the upside.
A pullback is due as price has seen a nice move upwards, so some selling off is natural. We just
need to identify levels of support price may come down to.
We have the 20 simple moving average, the $4000 round number, followed by the 50 simple
moving average.
Whichever level acts as support is irrelevant, we just need to continue to see a pattern of
higher highs and higher lows to confirm the uptrend is still in play.
Overall, the stock market is bullish and we may well continue to see bull trends throughout
the rest of the year.
See below for more information on our trading techniques.
As always, keep it simple, keep it Sublime.

$SPY nearing a top (Mid-May), support in the low $300sIt looks to me like $SPY is nearing the end of its bull run. We should see one more large push up. Thinking it'll top out around $425-$430 in the middle of May and find support in August around the $320 area (Green support line). If price falls under $323 and the selling continues, price could go all the way down to the lower support line at $287 where I would expect a bounce.
Key levels and pivot dates on the charts. Same idea as before, updated timing and levels.
Good luck.

SPY bearish divergence on 1HSeeing some bearish divergence here on the hourly. Higher time frames aren't showing divergences, though.
RSI has been overextended for a number of trading sessions now, similar to September 2020 when we saw a 10% correction.

S&P 500 looking overbought. Expecting 100+ point correction.It's your friendly neighborhood trader-man. S&P looks overextended.
I'm looking for a deep correction that is also healthy. I think the year will be a crazy one that finishes up, so I'm not long term bearish. Only when I see the signs.
Longs use tight stops, and keep a close eye on the overnight action.
The biggest thing for me is just how low the volume has been this recent week. Moves up on lower volume don't last!
Will it correct tomorrow?.. I would never tell the market what to do. If it finishes the week high, I would only grow more bearish.

SPY momentum is reversing - Lots of DIVERGENCECurrently there is some divergence between the ROC and the price of SPY. ROC (rate of change) is a momentum indicator.
There have been multiple divergences like this before, and each one resulted in a trend reversal.
The ROC has moved back towards the mid-line, which is a sign of waning momentum. If we cross below the mid-line (0 value) then we could see some downward momentum and lots of selling.
We also just hit the 21-period moving average in the previous session. If we cannot stay above it then I will remain bearish.

SPY rising wedge looks eerily similar to post-covid rallyLots of similarities between the two rising wedges (orange lines).
Both have a double top in the RSI.
Both rallies about 150 days long.
Both rallies breached the upper resistance level of the wedge.
In both instances, a correction of about 7% gets us back to the green support line.
If we break down from that, then the purple line should be the next support level (assuming things play out the same way).

QQQ poised to outperform SPY?This chart is the ratio between QQQ and SPY. When the ratio increases, it means QQQ is outperforming SPY.
Just recently the ratio broke out of a symmetrical triangle, and now we may be entering into an ascending channel (purple lines).
If we can manage to stay within the ascending channel, then it's safe to assume that QQQ could outperform SPY by 5 percentage points in the short term. E.g. if SPY returns 10% in a month, then QQQ returns 15% - a difference of 5 percentage points.
If we break out from the ascending channel and move higher, then QQQ could really outperform SPY.

What about S&P 500?It seems the journey is still going on// Even though it is charming I cannot say it is cheap to buy and hold except some energy companies.
in my opinion the next target is 4130!
If you are a long term investor then no worries but if you are not then you may consider the better options
I know it is already bought higher than its worth but the governments need to feed the markets in these bad days so money needs been put somewhere, right? Maybe the new Everest will be seen .. who knows!
I wish you good profit!
Follow me!
Thanks
Important Notice
- The index, stock, commodity, etc. I share here should not mean that I personally take a position.
- It is important that my shares are not interpreted as buy-hold-sell advice in any way.
-Please process according to your own risk appetite
-You can send me a direct message for your financial, technical or training requests.
- Liking the shares and following the account is an important indicator for the continuation of the shares.
- All the works I have shared; all the information, drawings, graphics and comments, the notes I have taken for myself and / or my experiments on technical analysis , my training notes.
Legal Notice
Investment information, comments and recommendations contained herein are not within the scope of investment consultancy. Investment consultancy service: It is offered within the framework of an investment consultancy agreement to be signed between brokerage houses, portfolio management companies, banks that do not accept deposits and the customer. The comments and recommendations contained herein are based on the personal opinions of those who make comments and recommendations. These views may not be suitable for your financial situation and risk and return preferences. Therefore, making an investment decision based solely on the information contained herein may not produce results in line with your expectations. Nevertheless, I cannot be held responsible for any direct and / or indirect damages, loss of profit, moral damages and damages that may be incurred by third parties, which may be incurred by investors as a result of the use of the information on the site and the resources used for the site
