SAND - Daily Chart ✅Let's see how SAND is behaving.
This is a 1D chart.
The Fib retracement shows that the price had a dump and got corrected to a new support area.
The market is showing NEUTRAL volumes for SAND. We might see more consolidations coming for now.
Two resistance levels push down on value, and two support levels hold the price high and show strength. The higher band can work as resistance.
The middle Bollinger Band can push down the value, and the lower band pushes the price up.
If the price crosses the local resistance and stays above it for confirmation, we can open our long positions, aim for the next resistance, and use it as a TP point.
The RSI shows that SAND is below the 50 levels, the center.
If you want to know how the RSI indicator works, take a look at this Educational Idea. It'll help you have better readings:
Current Market Price: $4.62
Let me know your ideas.
Good luck.
SANDUSD

SAND - BUYZONEHey Guys, I bought more Sand in this zone! And made also my prediction. Hope it will go trough :)

You can Long Sand short-term with Divergence...-Now, Sand is on a Demand Zone in the daily time period.
-4H RSI shows a bullish divergence.
-There is a huge falling wedge breakout.
IMPORTANT-
Keep a tight Stop Loss below the Demand Zone shown in green color. because BTC IS NOT STILL CONFIRMED A REVERSAL !!!!!.

SAND - Daily Chart ✅Let's see how SAND is behaving.
This is a 1H chart. (Valid for 24 hours)
The Fib retracement shows that the price had a dump and got corrected to a new support area, and now it's retesting the local resistance.
The market is showing SELL volumes for SAND.
Two resistance levels push down on value, and two support levels hold the price high and show strength. The higher band can work as resistance.
The middle Bollinger Band can push down the value, and the lower band pushes the price up.
If the price crosses the local resistance and stays above it for confirmation, we can open our long positions, aim for the next resistance, and use it as a TP point.
The RSI shows that SAND is below the 50 levels, the center.
If you want to know how the RSI indicator works, take a look at this Educational Idea. It'll help you have better readings:
Current Market Price: $4.8548
Let me know your ideas.
Good luck.

⌛🦜 SANDBOX-Metaverse Rules 🏴☠️☠SANDBOX ready for another flight higher.
Was happy to see that one of the new ICO tokens i purchased recently announced that they bought on Sandbox!
Virtual Real estate is no longer fiction..It's here, now, happening.
As you know for my previous ideas, i consider the Sandbox to be better than Mana (Decentraland).
In any case they should both rise.
One Love,
the FXPROFESSOR

SAND - Daily Chart ✅Let's see how SAND is behaving.
This is a 1H chart. (Valid for 24 hours)
The Fib retracement shows that the price is getting rejected by the local resistance area.
The market is showing SELL/NEUTRAL volumes for SAND.
Two resistance levels push down on value, and two support levels hold the price high and show strength. The higher band can work as resistance.
The middle Bollinger Band can push down the value, and the lower band pushes the price up.
If the price crosses the local resistance and stays above it for confirmation, we can open our long positions, aim for the next resistance, and use it as a TP point.
The RSI shows that SAND is below the 50 levels, the center.
If you want to know how the RSI indicator works, take a look at this Educational Idea. It'll help you have better readings:
Current Market Price: $5.48926
Let me know your ideas.
Good luck.

SAND variable chartSAND tracks BTC, the chart shows reactions to the behavior of BTC and the high volatility of trends, the situation is dynamic, so it is worth following SAND live, because every hour can be decisive

SAND on The Way to 9$ (New ATH)Hello every one
SAND/USDT
SAND is forming a Bullish Pattern which is a Cup & Handle Pattern! The Pattern Hasn't Formed completely Yet, But It will Complete Eventually and That's When We Need a Break out For SAND. IF it Happens, we Can Expect a Bullish Movement as Much as The Measured Price movement To happen (AB=CD). If our Predictions Come True, We can Expect SAND to Be at 9$ soon Which is a New ATH for It.
💎Traders, if you liked this idea or have your opinion on it, write in the comments, We will be glad.
Things can change...
The markets are always changing and even with all these signals, the market changes tend to be strong and fast!!
Thank you for seeing idea .
Have a nice day and Good luck

Sandbox beginning of the year predictionSandbox has still a Buy signal for the beginning of 2022.
I look for a return to $7.5 by the end of January!
Happy New Year!

SAND Scalping OpportunityThis is my scalping position on Sand USDT, Sand already has broken out from falling wedge pattern, keep looking on target price, if the price break the target price, we should not close the position, let it fly

SANDUSDT, We are in sell position ...Hello everybody
According to the chart, the price is moving on upwards channel in daily time frame but in lower time frame in 4h time frame we are making a pattern price and we need to have pullback of the wave to the sell zone area then its ready to drop to reach to our target.
At first take signal then entrance in sell position and dont forget use stop loss
Our stop loss is Assumption and we should take signal to entrance then we manage our stop loss
Previous analysis :
Good Luck
Abtin

Early C Entry Bullish BAMM Continuation on SANDWe have some Bullish Variables at the 200 Hour Moving Average Suggesting a reversal and a move up that could be part of one big 1 HR BAMM that would take us up 30 percent from entry.

SAND - potential trade.A trend line has formed on the SAND chart. The price is starting to squeeze near this trend line, which is a good signal for a breakout and a continuation of the rise.
In case of a breakout, there might be a good opportunity for a breakout, in case of a false breakout, there might be a good opportunity for a sell.
Write in the comments all your questions and instruments analysis of which you want to see.
Friends, push the like button, write a comment, and share with your mates - that would be the best THANK YOU.
P.S. I personally will open entry if the price will show it according to my strategy.
Always make your analysis before a trade.

Sand Price Prediction for Upcoming daysHello everyone and merry Christmas, hope you guys are doing well.
First of all this is not financial advice and this is only my personal TA.
Between Jan 20.2021 and March 27.2021 we saw the same behavior from Sand on daily chart. It is highly possible for it to repeat the trend as other coins have repeated the same concept before.
I can see easily sand between 10 to 12$ for the next couple of months.
Yeah! That's it for now.

SAND Road to 6.5 USDHello Traders,
BINANCE:SANDUSDT was in a triangle that now is broken so the target i think can be 6.50 USD

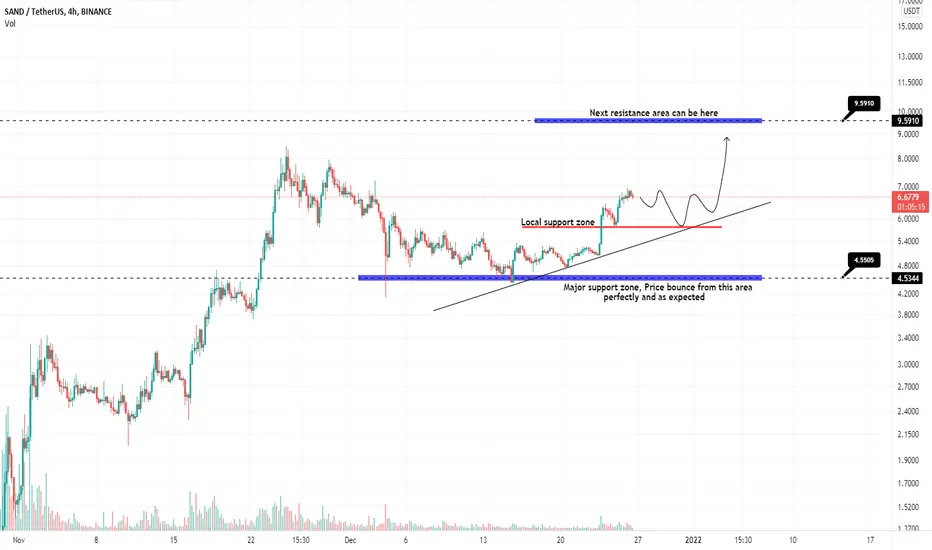
SAND is so bullish, Where is the next potential target?#SAND Mid term Update
SAND bounced from 4.5$ support area as we expect. Now the next target for this coin can be 9.6$ area which is a potential resistance zone.
Some pullback up to Local support area and dynamic ascending trend line is possible. Don't forget that, The dynamic support must be kept.
Sand Box analysis SandBox has potential to reach 12$ in this bull run have some in the bag and hold tight.Bull Flag breakout confirm waiting for the retest to enter this trade setup. DCA and BTD.

SAND new price levelSAND after a few days, wakes up and we see a new price level, the next few days will show if this level will be defended, the situation on the chart looks very good

SAND sideways trend and slow stabilizationSAND looks stable at the moment, the support line has not been broken, we will see how strong the impact of BTC will be on the situation of SAND on the chart

take 8% profit on SANDOur team thinks SAND growth is beyond the specified range.
Stop Loss is your best friend.

SAND slow stabilizationSAND is currently in a stable situation, slight price fluctuations are not a big problem, the situation looks transitional and soon we will see big things (metaverse)

Time to Buy SANDBuy: $5.1 - $5.25
Nice inverse head and shoulders forming.
Stop loss 15 min candle close below trendline support

SAND sideways trend with slight fluctuationsSAND is stabilizing the situation on the chart and apart from slight fluctuations, no major changes are visible
