SAND nice price rebound SAND shows that the current price level is not right, the current direction is up and whether we continue this depends only on BTC
SANDUSD

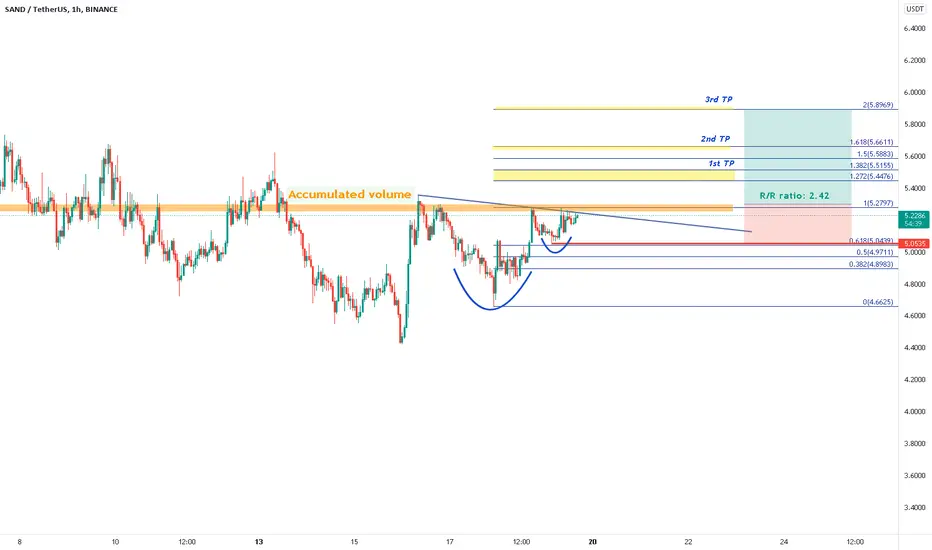
SAND - Possible Cup and Handle, and TP/SL BYBIT:SANDUSDT
1H trend chart
-
SAND is forming a potential cup and handle pattern on 1H
We can see accumulated volume are gathered around the orange zone.
If price can take it out (Fib 1), we can have a great risk-reward ratio with trading strategy as below.
-
Profit Targets:
a) 5.4476~5.5155----Fib(1.272~1.382)
b) 5.6616----Fib(1.618)
c) 5.8969----Fib(2)
Stop losses:
a) 5.0535-----Red horizontal ray
-
If you like this analysis, smash the "like button" and leave a comment below to share your thoughts
or let me know what crypto you want to see!
Trading is a reflection of yourself. Learn more daily and be ready for every opportunity.
Have a nice trading!

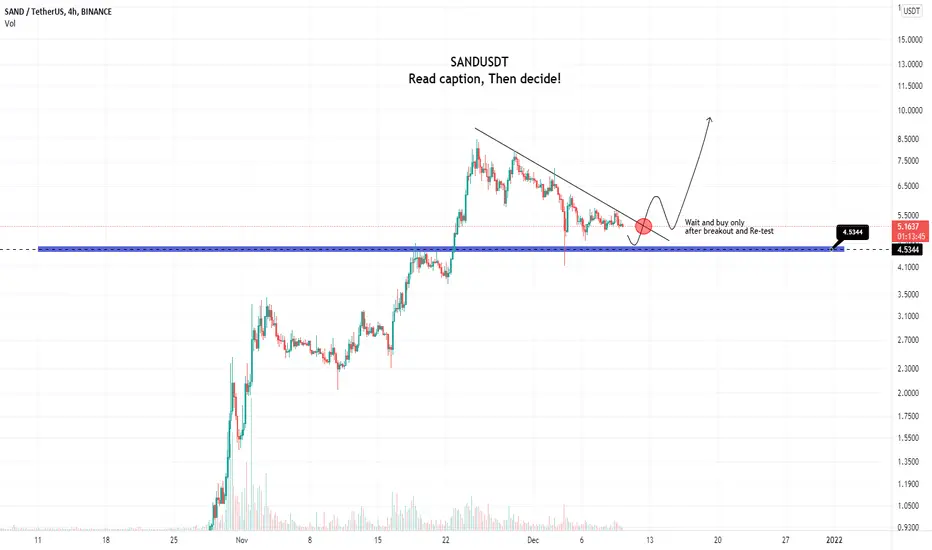
SAND Talked about it the end of November 🤯🍕🍣Good morning to all traders,
we had discussed sand towards the end of November when I was expecting a good retracement to enter below $5.
I think that moment has arrived since we are in a descending channel with various support zones, the first of which is around 4.60 usd but it is not certain that it will hold. As always I will behave accordingly waiting for a confirmation or the reaching of my areas of interest (Support and the POC).

Falling Wedge Breakout for SAND/USDTSAND/USDT just broke above the very clear falling wedge in the 4H , which started its formation around the 29th of November.
Currently waiting for a retest on the trend line to enter a LONG position.
My SL will be set a little bit below the base of the triangle and my TPs as seen on the chart.

SANDBOX, Huge Reversal-Pattern Indicates PARAMOUNT BREAKOUT!Hi,
Welcome to this analysis about SAND/SANDBOX and the 4-hour timeframe perspective. When looking at my chart we can watch there how SAND has initiated this main descending-channel-formation marked with the blue boundaries and the wave-count reaching from A to C to the downside. Now SANDBOX also established an important support base within the 4.855 level from where several bounces occurred also matching coherently with the lower boundary of the descending-channel and the ascending-trend-line marked in dashed grey. Now as SAND bounced off the 4.855 USD Level marked in orange SAND continued to develop a main double-bottom-formation with the first bottom and the second bottom already completed. If SAND now manages to hold the structure appropriately and bounce off within the range this can be an appropriate origin for a breakout to the upside which will offer the first descending-channel-breakout-setup and once this happened when SAND continues with further bullish-demand-increasing it will show up with the second confirmation above the neckline of the double-bottom. Both confirmations will activate the main upper-target-projection as a target-zone and once this zone has been reached the situation needs to be elevated anew, it will be an important development ahead.
In this manner, thank you for watching the analysis, it will be great when you support it with a like, follow and comment for more upcoming market analysis, all the best!
"Good fortune is when opportunity meets preparation."
Information provided is only educational and should not be used to take action in the markets.

Keep an eye on SAND - We could see a break to the upside soon!Here's a quick Look at SAND 4 hr chart. As we can see, the price has been forming a bigger descending triangle and we could see a break to the upside soon. The best entry would be, when the price breaks above 5.8$ with good amount of volume. Definitely one to keep an eye on.
-------------------------------------------
The idea is: Buy when the price breaks above 5.8$ and take profits at the levels shown in the chart.
Targets:
1. 6.2$
2. 6.7$
3. 7.6$
4. 8.4$
-------------------------------------------
What are triangles when it comes to trading?
Key points:
"1. In technical analysis , a triangle is a continuation pattern on a chart that forms a triangle-like shape.
2. Triangles are similar to wedges and pennants and can be either a continuation pattern, if validated, or a powerful reversal pattern, in the event of failure.
3. There are three potential triangle variations that can develop as price action carves out a holding pattern, namely ascending, descending, and symmetrical triangles."
-------------------------------------------
If you like the content, then make sure to comment and like the post :D
Follow me for daily profitable trading setups
BTC dictates the market. If BTC falls, then Alts will fall as well. Trade safe!

SAN LOOK GREATLONG ON SAND
If we got momentum and breakout the tringle that's will be great and we will hit previous target

SAND can fly from this zone! Buy just in this caseSAND Short term Analysis
SAND is near a strong support zone, So this can be a good opportunity for buying this strong project's coin here.
4.5$ is a strong support zone, so you can buy one step near that area, The safest buy is when breakout has completed. So you can buy in retest.
If we lose this strong support zone, The next target will be 3.5$ zone.

Sand To the Moon Sand
Gala
Alice these are Metaverse coins and will pump soon..
Buy setup is given in chart..
Buy.
Sand/Usdt
Entry = 5.48-5.53$
Tragets
For Future
5.70$
5.78$
6.00$.
Stop Loss = 4.99$
Levrage.. 5X..
Targets for Spot.
Tragets mentioned in chart..

Sand Bullish or Bearish ? ) I think today is the determination day of the Sand. for now it seems to be bullish it is about the break the edge of the triangle
if break and goes up, fir sure new ATH will come

🔔SAND/USDT Long opportunitySAND is trying to break out, volume isn't convincing but still there is a lot of potential upward movement to be made. If we manage to break out and re-test in order to make confirmation then it shall fly or it can fly without retest. There is a GC on 1hr timeframe on MACD which allso suggest upward movement, RSI is in bullish zone.
Always manage your risk well. Don't risk more than you can afford to lose.
It is not a financial advice, I'm just sharing my personal view.

sand in the complex pullbackafter complex pullback and strong resistant in zone 6 it can watch lower goals.Not an investment offer.

SAND Short 200 DEMA denial I am calling a short term short on SAND based on the recent 200 DEMA denial coming on strong volume on my one hour chart. As pointed out in my chart this is the second strong denial of the 200 DEMA in the last handful of days.
SAND just does not simply look ready for a breakout, I believe it will continue to trade in this current channel until the fear/greed index starts moving out of "extreme fear" and towards neutral/greedy.

SAND RETRACEMENT IS COMPLETE$Sand pulled a solid 10X reaching the $8 mark. it has however retraced to wipe out the late buyers and margin traders . The retracement to 4.1-4.7 range bouncing off the green trendline is good for the market as it shows the uptrend market is still active. Now we can rebuy our bags for the next leg up
Buy $4.5 - $5.1 range is good to buy
Take profit at $6.5
Goodluck

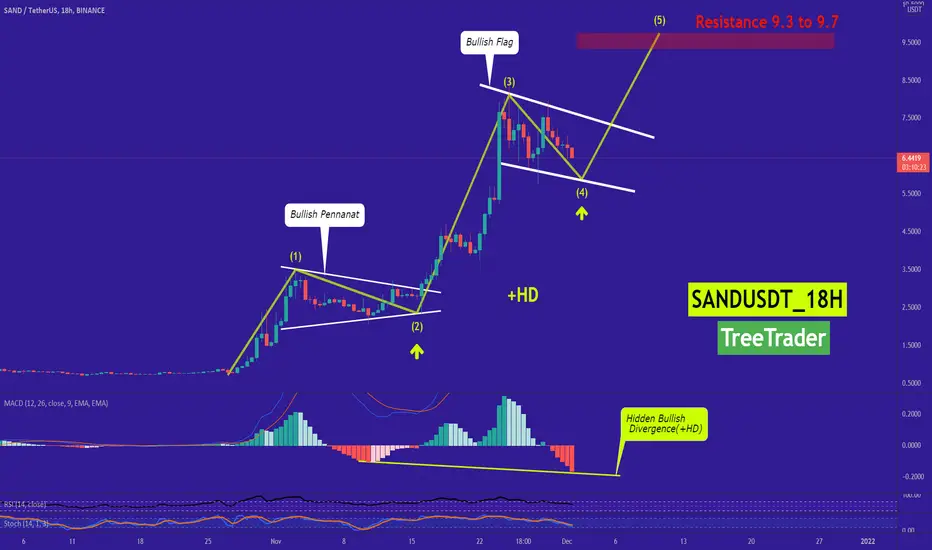
SAND can Reach 9.7$Hi every one
SAND/USDT
SAND has done a Massive Bullish Movement Recently But It seems There is Room For Bulls For another Bullish Wave! as you can See The Price has been Increasing Beautifully according To Elliot Waves Principle! The First 3rd Impulse waves Has Been Completed,The Price is In The 4th Impulse wave Right now which is a Correction wave! after The 4th wave is completed which is Expected to happen in a Few days, The 5th wave Will be Started & the Bullish Wave can Increase Up to 9.3 or 9.7$. Not Only The Elliot Waves Suggest This, But There is also a Bullish Flag on The chart which Suggest The Same Price Prediction! The Price was In a Bullish Pennant Not Long Ago & It worked Perfectly So There is a High chance That The Same Thing Happen Here with This Flag! There is also a Hidden Bullish Divergence (+HD) On MACD as well! all Evidences Suggest a Bullish Movement For Sand ! The 5th Wave and The Bullish Break out can Happen Soon and We shall See SAND reach 9.7$!
Summery:
-SAND's Elliot Impulse waves Suggest a 9.7$ Target
-Bullish Flag also Suggest The Same Target
-(+HD) On MACD
🔴This is only an idea and not a financial advise ( NFA )🔴
💎Traders, if you liked this idea or have your opinion on it, write in the comments, We will be glad.
Thank you for seeing idea .
Have a nice day and Good luck
SAND downward wedge #2 + MACD over zeroMACD has now crossed over zero on @HPotter MACD indicator. This is a bullish indication and the explanation I have quoted from the writer of script himself:
"Moving Average Convergence Divergence. The MACD is calculated
by subtracting a 26-day moving average of a security's price from a
12-day moving average of its price. The result is an indicator that
oscillates above and below zero. When the MACD is above zero, it means
the 12-day moving average is higher than the 26-day moving average.
This is bullish as it shows that current expectations (i.e., the 12-day
moving average) are more bullish than previous expectations (i.e., the
26-day average). This implies a bullish , or upward, shift in the supply/demand
lines. When the MACD falls below zero, it means that the 12-day moving average
is less than the 26-day moving average, implying a bearish shift in the
supply/demand lines.
A 9-day moving average of the MACD (not of the security's price) is usually
plotted on top of the MACD indicator. This line is referred to as the "signal"
line. The signal line anticipates the convergence of the two moving averages
(i.e., the movement of the MACD toward the zero line).
Let's consider the rational behind this technique. The MACD is the difference
between two moving averages of price. When the shorter-term moving average rises
above the longer-term moving average (i.e., the MACD rises above zero), it means
that investor expectations are becoming more bullish (i.e., there has been an
upward shift in the supply/demand lines). By plotting a 9-day moving average of
the MACD , we can see the changing of expectations (i.e., the shifting of the
supply/demand lines) as they occur."
Source:
credit: @HPotter

SAND short term short playlooking for bearish confirmation on what appears to be evening doji star candle pattern (1hr) and strong sell volume. might open 3xs short etf on mexc.

Sand Short term setupBased on support lines and trend lines,hope you will like it!
if you have any feedback about the chart pls feel free to tell me:)
MY IDEA ONLY NOT A FINANCIAL ADVICE!!! Love Yall :)

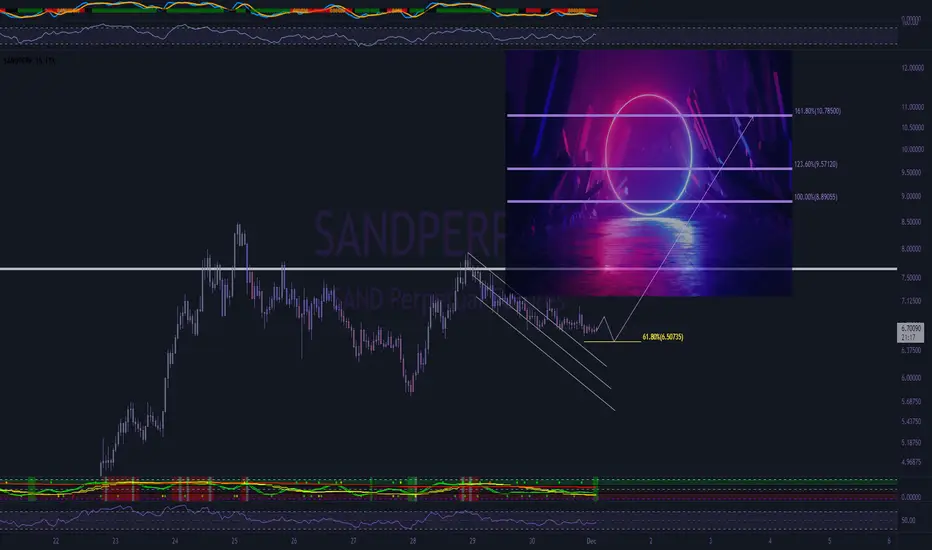
🌌The Sandbox🌌sand looks ripe for a move up, our system is calling a pretty significant buy right here.
came down in 3 wave in this local region, indicative of a simple zig-zag - followed by a clean 5 wave move.
after some consolidation \ a break of downtrend, sand is gearing up for the last hurrah.
possible it raids $6.50, but ultimately it looks really good for a sharp move up.
i'm targetting $10.70 on this swing, but will take profit at the two levels along the way (as portrayed on the chart).
Sell SAND due to breaking down the uptrend 🚨Sand has broken down the support trendline and it seems it's gonna fall to lower lows. Targets are seen
GOOD luck

#SAND UNSTOPPABLE Are we about to test $7 SAND is unstoppable since we have reached out Targets as posted earlier of $5.5, it seems we have now pierced FIB 1.618 without any upper wicks seems there is little or no selling pressure so far,
if it keep going like this we are going to test the centre of fib between 1.618 and 2.618 which takes us to approx. 7.10$.
