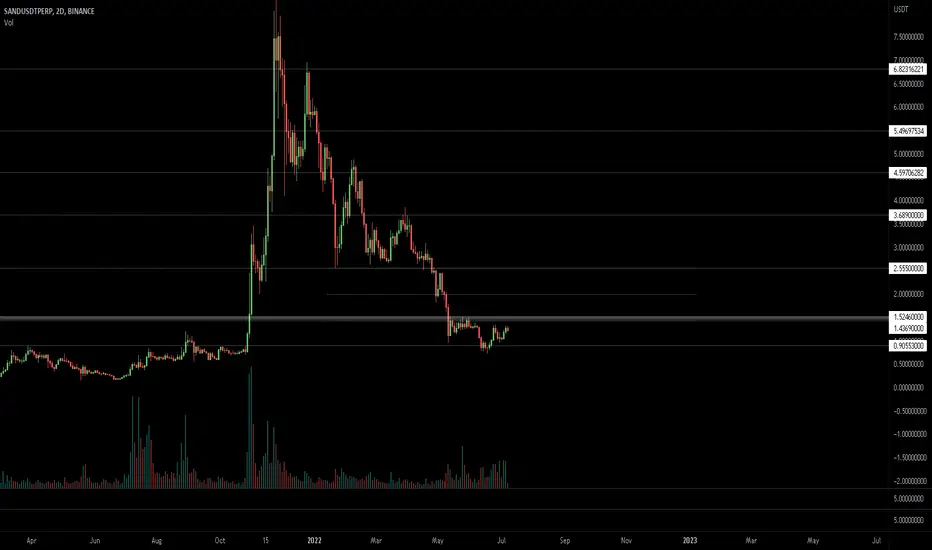
2D Buy on $SAND.The atmosphere for a bull cycle within this bear market appears to be developing.
UCTS is indicating a 2D Buy on $SAND.
In search of a break or flip above the range high ($1.5) as a continuation
SANDUSD
SANDUSD ❕ global descending trend lineSAND is above the liquidity zone, but under the global downtrend.
Volatility has declined.
On the 30m Timeframe, price and trading volumes have formed a bearish divergence.
TD Sequential - downside reversal signal (30m TF)
Main MAs - bullish sentiment, turning into excessive optimism against the background of the other market (4H, 1H and 30m TFs)
I expect that SAND may start a significant correction after fixing below the support level.

SANDBOXSAND/USDT look at the chart we have 2 Support Zone and one Resistance zone should you think it will be followed that we expect in the chart!
Disclamer:
We are not financial advisors. The content that we share on this website are for educational purposes and are our own personal opinions.

✅TS ❕ SANDUSD: important resistance✅✅SAND has reached an important resistance level. It is quite possible to rebound down again. ✅
🚀 SELL scenario: short to 1.148.🚀
----------------------------------------------------------------------------
Remember, there is no place for luck in trading - only strategy!
Thanks for the likes and comments.

SAND - Buying SignalBYBIT:SANDUSDT
4 Hours time frame
-
SAND is showing a potential double bottom here
We can long it here with strategy as below.
-
Targets:
1) 1.3491
2) 1.5173~1.585
3) 1.6582
Stop:
1) 1.1507

SandThat's clear! I waiting target to red line. That's clear! I waiting target to red line. That's clear! I waiting target to red line.

SAND can give you a lot of Profit Right now!SAND is in a Cup and Handle Pattern which is Pretty Good Because This means the Price has a chance To increase Pretty Soon! This shows Us that Bulls Might be Coming Back ! You can see there has no Break out Occurred yet So we can not be So Sure about the Incoming Movement But It will Happen pretty soon. the expected movement is as much as the Length between the Top and the Bottom of the Cup (Measured price movement) and you know that the Price will be increasing as much as that Movement (AB=CD) if our prediction comes true, price will increase around 70% and will reach 2.21$ which is also a Decent Resistance.This chart and Info are Provided by our Sponsor WHITEBIT Exchange. Please Check their Exchange Using the link down below.
-SAND is in a Cup and Handle Pattern.
-No break out yet
-AB=CD
-2.21$ is a target and a Resistance
_ _ _ _ _ _ _ _ _ _ _ _ _ _ _ _ _ _ _ _ _ _ _ _ _ _ _ _ _ _ _ _ _
Thank you for seeing idea .
Have a nice day and Good luck

SANDUSDT 1D Is it time to play in The Sandbox again?)During the strong fall of the crypto market in May-June 2022, the SANDUSDT price reached a liquidity level around $0.70
Around this level that the liquidity position was gathered in October 2021 before the upcoming 1100% upward pumping.
In June 2022, the rebound from the bottom was +84%, but the price of SANDUSD, despite two attempts, at this moment could not get a foothold in the upper part of the downtrend channel.
The message of this idea is simple: if you believe that game tokens still have a future in the crypto market, then The Sandbox is worth your attention. At least on the chart we see activity and the struggle of buyers and sellers.
Ideally, wait for the Sand price to fix above $1.10-1.20.
The first target from above is $2
Large positions will begin to sell off no faster than in the liquid zone of $2.50-3.50
_______________________________
Since 2016, we have been analyzing and trading the cryptocurrency market.
We transform our knowledge, trading moods and experience into ideas. Each "like under the idea" boosts the level of our happiness by 0.05%. If we help you to be calmer and richer — help us to be happier :)

SAND - WHAT I THINKHey Guys, I think we can get there and opened already a long!
JUST MY THOUGHTS | NO FINANCIAL ADVICE | DYOR | HAPPY TRADING

SANDBOXSAND/USDT waiting to see next move on this coin now touching our Supply Zone but im waiting to make Double Top on SELL ZONE

Long-term #SANDUSD #SANDUSDT Analysis - MONTLYWith the recent events on cryptocurrency; I think we will start seeing less coins getting pumped and more of the solid coins getting attention. By solid, I mean coins that actually has a project and some kind of revenue coming in. Currently a lot of coins are back to prices of last year, if not, then lower. This makes it a great entry point for those that wanted to get in a few months ago, but thought prices were too high. Sand's (4th) wave count has retraced to the peak of wave (1) and bounced nicely. This is usually a good indication that the bottom is in. We don't normally enter wave 1 territory unless btc does something drastic. The market sentiment is still uncertain and people are fearful, which makes it a perfect op BINANCE:SANDUSDT FTX:SANDUSD portunity for institutional investors to start investing.

SAND/USDT - H 4 Adam@Eve My target price : 0.85 $ .
Prove me if I'm wrong .
Also, the Daily Stoch RSI is at the beginning of the correction .
I'm waiting for weekend to see if my stupid analysis is on the point.

SANDUSD ❕ similar to Zcash, but the situation is differentSAND has broken down the upward channel.
Main MAs are bearish (30m TF)
Volatility narrowing.
50MA have broken down 100MA on the 1H Timeframe.
Price and RSI have formed a bullish divergence on the 30m Timeframe.
I expect price may test the resistance level, but will continue to decline once it has fixed below it.

SANDBOXSAND/USDT waiting for these moves On SANDBOX these moves will make on this BOX Support is on 0.9591

SAND/USDT Main trendThe chart shows the main trend. Timeframe 3 days. The main trend to understand in which zone in the secondary or local trend you are working.
Coin in the coin market: SAND
This is what this secondary trend looks like on a line chart.
I want to note that the price of excess profits has been in the main trend since the beginning of trading, the coin is quite fresh.
Therefore, if the work is long, then only "pull out" the price movement without the accumulation of large positions.
If the mirror level of the “wedge support” (gray zone) is broken, then a huge potential for short-term work opens up. But at the moment I'm working with a wedge.
Observe risk management in your work and this is very important - limit possible losses with the help of a stop loss, this is very important with such excess profits. But, don't be greedy, take into account the intraday volatility of the trading instrument. If it knocks out and the pump continues to work without you, it's okay.
The reversal zones and the main levels on which the development of the trend will depend, I showed on the chart. Explore ideas for working in a minor trend in detail.
Secondary trend (a trend worth working in when an acceptable entry point occurs). Deadline 1 day. Candles. Logo.
SAND/USDT Secondary trend. Wedge

📊 SAND pumped and now it's facing resistanceHello, dear TradingView members.
This idea is a SAND analysis.
SAND had a pump and broke two resistance levels.
It is now pushing up below the upper BB, and now we are expecting
The RSI is not overbought, but it doesn't seem strong either in the buy volumes.
The price might get rejected by these two resistance levels and land on support.
The Speedometer indicator shows Buy volumes on the market for SAND on a 1D interval.
Now have in mind: ANY news about this coin can cause a big pump or dump at this moment!
Let me know if you guys have any questions;
I will be more than happy to help.

SANDBOXSAND/USDT forming Symmetrical Triangle Pattern !!
What is Symmetrical Triangle Pattern?
A symmetrical triangle is a chart pattern characterized by two converging trend lines connecting a series of sequential peaks and troughs. These trend lines should be converging at a roughly equal slope.

SAND long ideaIve been grappling as to what is happening with SAND today.
It is higher up on coinmarketcap, so i feel that when we do get a breakout it won't be as volatile.
Im suggesting two overhead resistance (diagonals). One is from more recent price action and the other goes further back, more macro. Im thinking that recent price action is more important, and therefore its actually the resistance line to the right (that we are yet to encounter, that is more important).
Looking to take longs in the box below, expecting some consolidation in price action before we see a break of the horizontal resistance and a rally to the overhead diagonal resistance line.

SANDUSD ❕ the price came out of the descending channelSAND has broken through the upward descending channel.
The price is above liquidity.
Trading volumes have fallen as the decline continues.
TD Sequential has formed a reversal signal down (30m TF)
During the rise in price, a gap was formed (4H TF)
BB indicator shows that it is overbought (1H TF)
Price is above the major MAs (1H TF)
50MA broke up 200MA (30m TF)
I think price could retest the support level, but after it fixes above it will continue to bounce.

SANDBOX the last chance (bottom) and the range market 📖🚀Hello 🐋
Based on the chart, the price is close to the major support (bottom) or better to say the previous zone that started its amazing pump to the upside ✔️
we
expect to see gain besides the range market is acceptable scenario too 📖💡🚀
and
if the price break the rang area to the upside, we will see more gain 🚀
Please, feel free to share your point of view, write it in the comments below, thanks 🐋

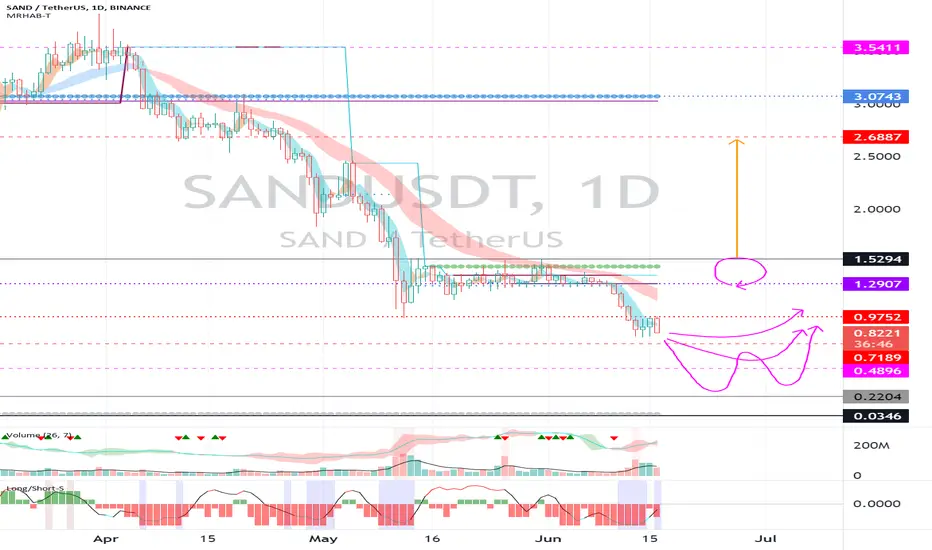
The Sandbox (SAND) - June 17hello?
Welcome, traders.
If you "follow", you can always get new information quickly.
Please also click "Like".
Have a good day.
-------------------------------------
(SANDUSDT 1W Chart)
Below 1.5294 is likely to be a mid- to long-term investment area.
So, whether it can move higher than 1.5294 is the key.
(1D chart)
In the short-term and medium-term perspective, it needs to rise above the 1.2907-1.5294 section to turn into an uptrend.
So, we need to see if we can find support and move higher above 0.7189.
An important volume profile section is formed around 0.2204.
------------------------------------------------------------ -----------------------------------------------------
** All indicators are lagging indicators.
Therefore, it is important to be aware that the indicator will move accordingly as price and volume move.
However, for the sake of convenience, we are talking in reverse for the interpretation of the indicator.
** The MRHAB-T indicator used in the chart is an indicator of our channel that has not been released yet.
** The OBV indicator was re-created by applying a formula to the DepthHouse Trading indicator, an indicator disclosed by oh92. (Thanks for this.)
** Support or resistance is based on the closing price of the 1D chart.
** All descriptions are for reference only and do not guarantee a profit or loss in investment.
(Short-term Stop Loss can be said to be a point where profit and loss can be preserved or additional entry can be made through split trading. It is a short-term investment perspective.)
---------------------------------
SAND will fall like sand!🔥🔥Subscribe to the channel, get notifications about signals!🔥
#SAND
▪️In the near future will fall by -30%. I don't see any growth opportunities. Meet me at the next stop $0.87

The Sandbox SAND Entry Range, Take Profits and Stop Losstargets reached here
SAND/USDT short
Entry Range: $1.20 - 1.36
Take Profit 1: $1.10
Take Profit 2: $0.97
Take Profit 3: $0.60
Stop Loss: $1.52
